Zip Codes with the Highest Percentage of Population Employed in Food Preparation & Serving in Radford, VA
RELATED REPORTS & OPTIONS
Food Preparation & Serving
Radford
Compare Zip Codes
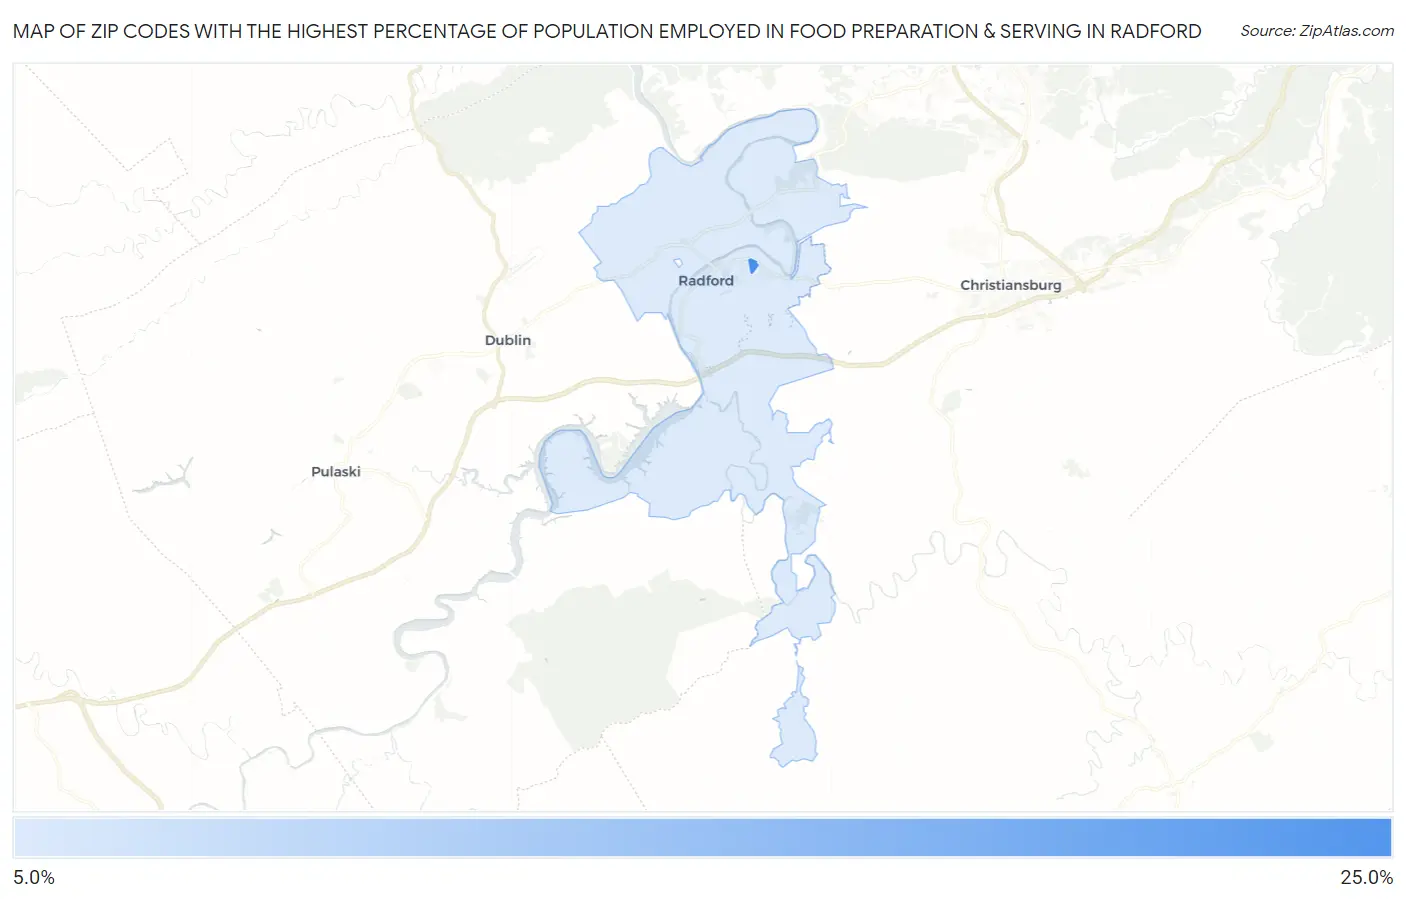
Map of Zip Codes with the Highest Percentage of Population Employed in Food Preparation & Serving in Radford
0.0%
25.0%
Zip Codes with the Highest Percentage of Population Employed in Food Preparation & Serving in Radford, VA
| Zip Code | % Employed | vs State | vs National | |
| 1. | 24142 | 23.2% | 4.8%(+18.4)#16 | 5.3%(+17.9)#379 |
| 2. | 24141 | 9.6% | 4.8%(+4.86)#82 | 5.3%(+4.36)#2,930 |
1
Common Questions
What are the Top Zip Codes with the Highest Percentage of Population Employed in Food Preparation & Serving in Radford, VA?
Top Zip Codes with the Highest Percentage of Population Employed in Food Preparation & Serving in Radford, VA are:
What zip code has the Highest Percentage of Population Employed in Food Preparation & Serving in Radford, VA?
24142 has the Highest Percentage of Population Employed in Food Preparation & Serving in Radford, VA with 23.2%.
What is the Percentage of Population Employed in Food Preparation & Serving in Radford, VA?
Percentage of Population Employed in Food Preparation & Serving in Radford is 12.6%.
What is the Percentage of Population Employed in Food Preparation & Serving in Virginia?
Percentage of Population Employed in Food Preparation & Serving in Virginia is 4.8%.
What is the Percentage of Population Employed in Food Preparation & Serving in the United States?
Percentage of Population Employed in Food Preparation & Serving in the United States is 5.3%.