Zip Codes with the Highest Percentage of Population Employed in Food Preparation & Serving in Petersburg, VA
RELATED REPORTS & OPTIONS
Food Preparation & Serving
Petersburg
Compare Zip Codes
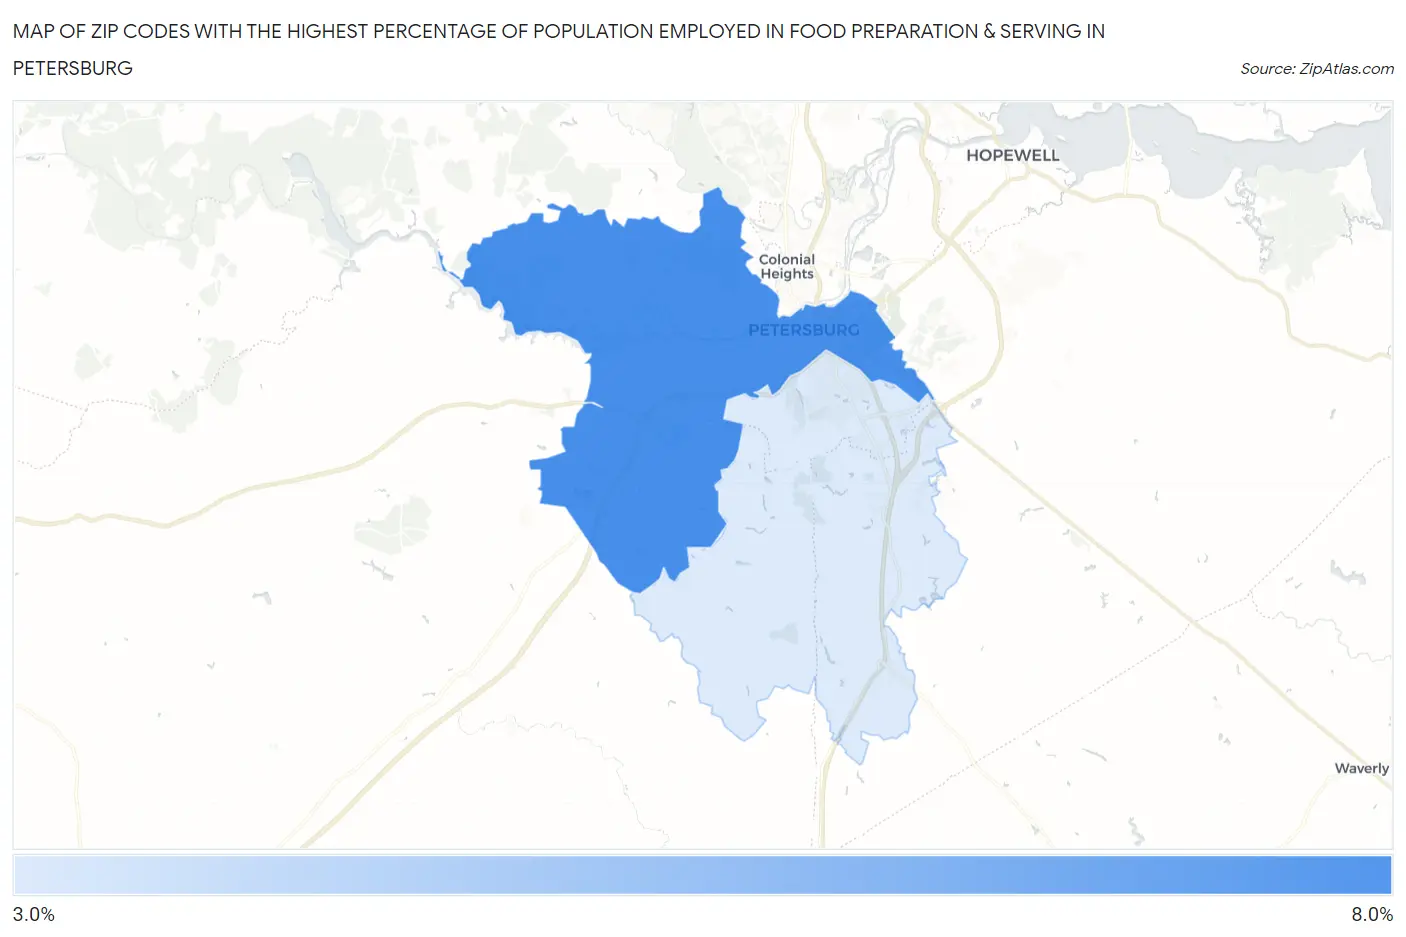
Map of Zip Codes with the Highest Percentage of Population Employed in Food Preparation & Serving in Petersburg
0.0%
8.0%
Zip Codes with the Highest Percentage of Population Employed in Food Preparation & Serving in Petersburg, VA
| Zip Code | % Employed | vs State | vs National | |
| 1. | 23803 | 6.4% | 4.8%(+1.64)#183 | 5.3%(+1.14)#8,065 |
| 2. | 23805 | 3.3% | 4.8%(-1.46)#488 | 5.3%(-1.96)#19,930 |
1
Common Questions
What are the Top Zip Codes with the Highest Percentage of Population Employed in Food Preparation & Serving in Petersburg, VA?
Top Zip Codes with the Highest Percentage of Population Employed in Food Preparation & Serving in Petersburg, VA are:
What zip code has the Highest Percentage of Population Employed in Food Preparation & Serving in Petersburg, VA?
23803 has the Highest Percentage of Population Employed in Food Preparation & Serving in Petersburg, VA with 6.4%.
What is the Percentage of Population Employed in Food Preparation & Serving in Petersburg, VA?
Percentage of Population Employed in Food Preparation & Serving in Petersburg is 6.0%.
What is the Percentage of Population Employed in Food Preparation & Serving in Virginia?
Percentage of Population Employed in Food Preparation & Serving in Virginia is 4.8%.
What is the Percentage of Population Employed in Food Preparation & Serving in the United States?
Percentage of Population Employed in Food Preparation & Serving in the United States is 5.3%.