Zip Codes with the Highest Percentage of Population Employed in Food Preparation & Serving in Chesterfield, VA
RELATED REPORTS & OPTIONS
Food Preparation & Serving
Chesterfield
Compare Zip Codes
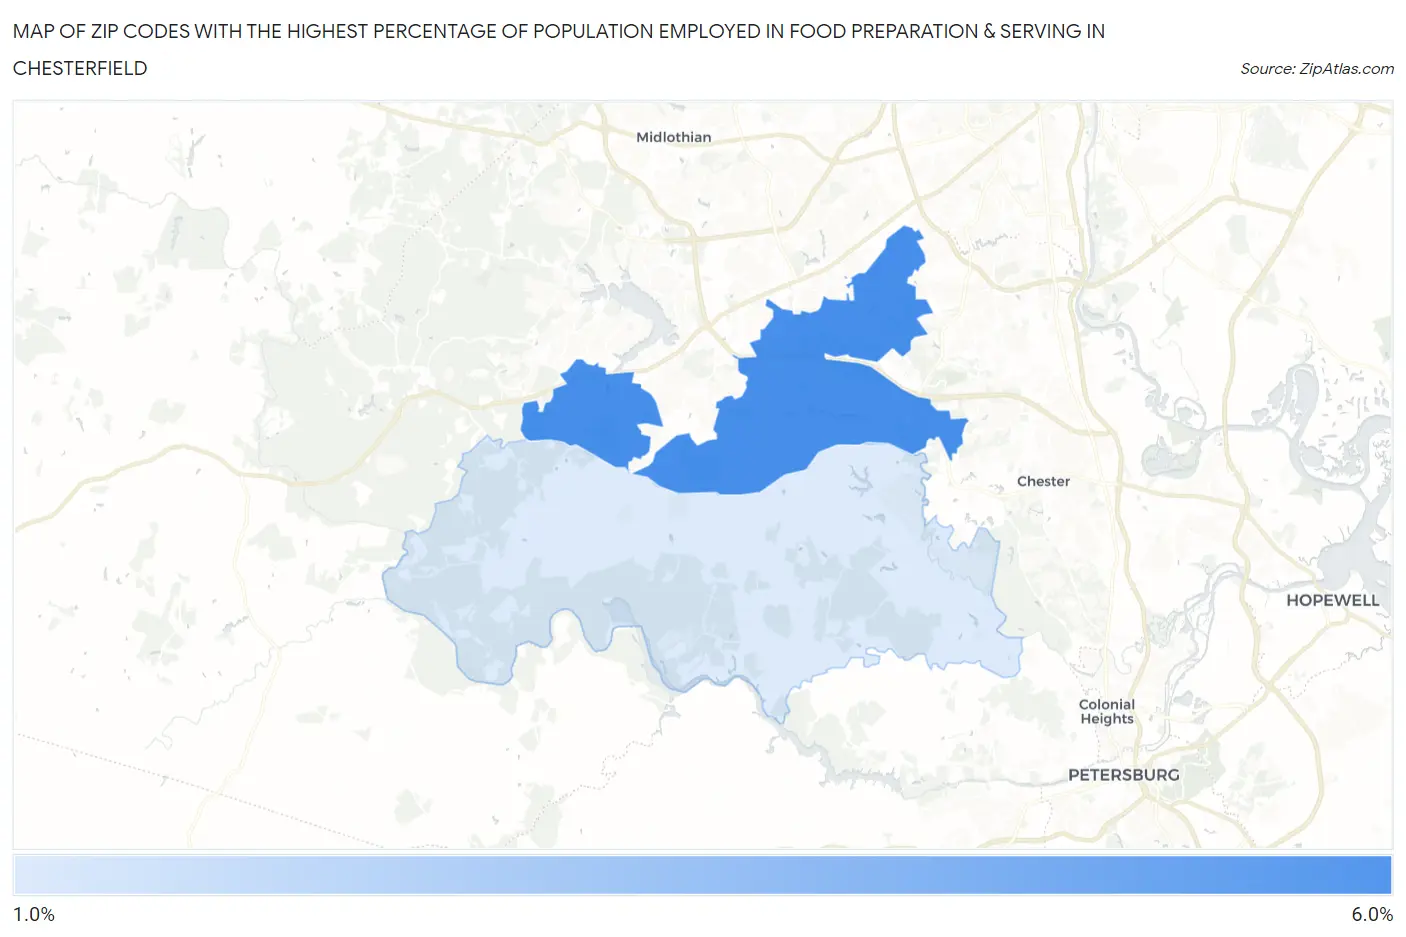
Map of Zip Codes with the Highest Percentage of Population Employed in Food Preparation & Serving in Chesterfield
0.0%
6.0%
Zip Codes with the Highest Percentage of Population Employed in Food Preparation & Serving in Chesterfield, VA
| Zip Code | % Employed | vs State | vs National | |
| 1. | 23832 | 5.0% | 4.8%(+0.255)#288 | 5.3%(-0.245)#12,779 |
| 2. | 23838 | 1.8% | 4.8%(-2.95)#623 | 5.3%(-3.45)#25,175 |
1
Common Questions
What are the Top Zip Codes with the Highest Percentage of Population Employed in Food Preparation & Serving in Chesterfield, VA?
Top Zip Codes with the Highest Percentage of Population Employed in Food Preparation & Serving in Chesterfield, VA are:
What zip code has the Highest Percentage of Population Employed in Food Preparation & Serving in Chesterfield, VA?
23832 has the Highest Percentage of Population Employed in Food Preparation & Serving in Chesterfield, VA with 5.0%.
What is the Percentage of Population Employed in Food Preparation & Serving in Virginia?
Percentage of Population Employed in Food Preparation & Serving in Virginia is 4.8%.
What is the Percentage of Population Employed in Food Preparation & Serving in the United States?
Percentage of Population Employed in Food Preparation & Serving in the United States is 5.3%.