Zip Codes with the Highest Percentage of Population Employed in Administrative & Support Services in Warrenton, VA
RELATED REPORTS & OPTIONS
Administrative & Support Services
Warrenton
Compare Zip Codes
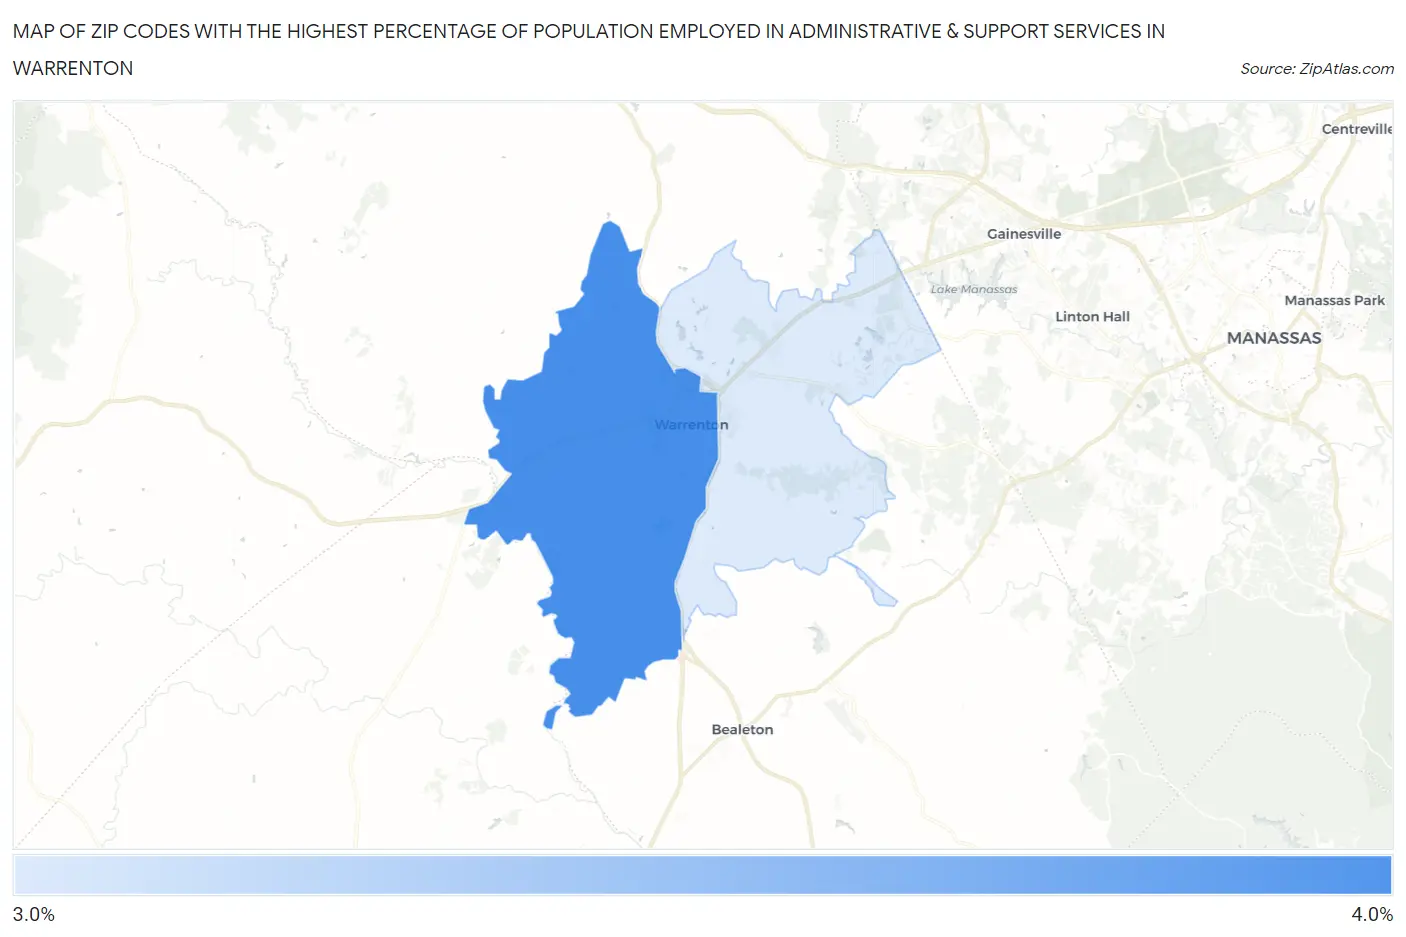
Map of Zip Codes with the Highest Percentage of Population Employed in Administrative & Support Services in Warrenton
0.0%
4.0%
Zip Codes with the Highest Percentage of Population Employed in Administrative & Support Services in Warrenton, VA
| Zip Code | % Employed | vs State | vs National | |
| 1. | 20186 | 4.0% | 4.1%(-0.152)#320 | 4.1%(-0.165)#10,770 |
| 2. | 20187 | 3.3% | 4.1%(-0.815)#403 | 4.1%(-0.828)#13,836 |
1
Common Questions
What are the Top Zip Codes with the Highest Percentage of Population Employed in Administrative & Support Services in Warrenton, VA?
Top Zip Codes with the Highest Percentage of Population Employed in Administrative & Support Services in Warrenton, VA are:
What zip code has the Highest Percentage of Population Employed in Administrative & Support Services in Warrenton, VA?
20186 has the Highest Percentage of Population Employed in Administrative & Support Services in Warrenton, VA with 4.0%.
What is the Percentage of Population Employed in Administrative & Support Services in Warrenton, VA?
Percentage of Population Employed in Administrative & Support Services in Warrenton is 3.4%.
What is the Percentage of Population Employed in Administrative & Support Services in Virginia?
Percentage of Population Employed in Administrative & Support Services in Virginia is 4.1%.
What is the Percentage of Population Employed in Administrative & Support Services in the United States?
Percentage of Population Employed in Administrative & Support Services in the United States is 4.1%.