Zip Codes with the Highest Percentage of Population Employed in Education, Arts & Media in Warrenton, VA
RELATED REPORTS & OPTIONS
Education, Arts & Media
Warrenton
Compare Zip Codes
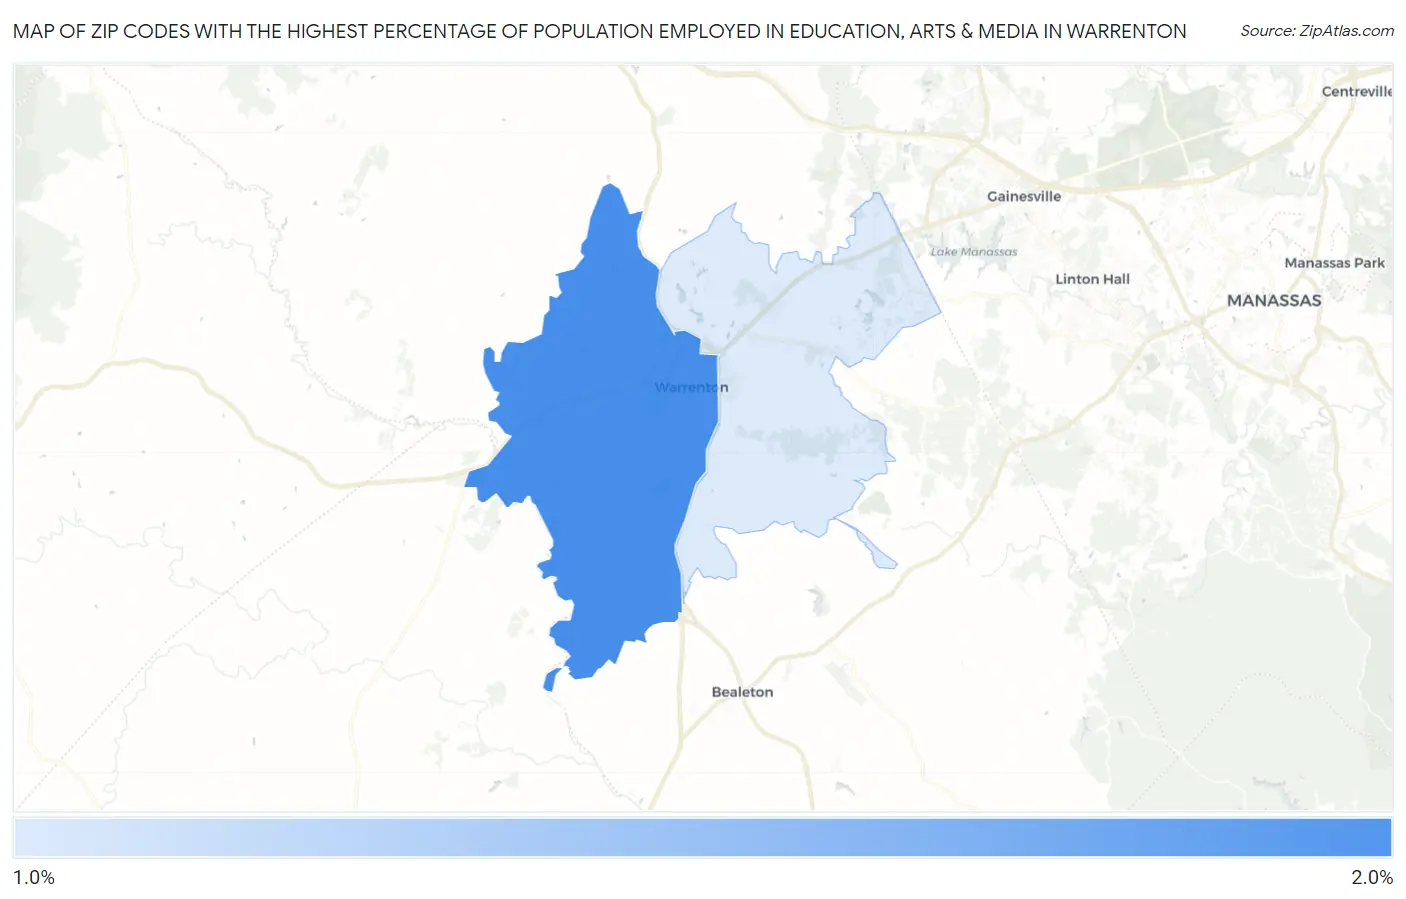
Map of Zip Codes with the Highest Percentage of Population Employed in Education, Arts & Media in Warrenton
0.0%
2.0%
Zip Codes with the Highest Percentage of Population Employed in Education, Arts & Media in Warrenton, VA
| Zip Code | % Employed | vs State | vs National | |
| 1. | 20186 | 1.9% | 1.9%(-0.020)#320 | 1.8%(+0.087)#10,564 |
| 2. | 20187 | 1.2% | 1.9%(-0.646)#434 | 1.8%(-0.539)#16,216 |
1
Common Questions
What are the Top Zip Codes with the Highest Percentage of Population Employed in Education, Arts & Media in Warrenton, VA?
Top Zip Codes with the Highest Percentage of Population Employed in Education, Arts & Media in Warrenton, VA are:
What zip code has the Highest Percentage of Population Employed in Education, Arts & Media in Warrenton, VA?
20186 has the Highest Percentage of Population Employed in Education, Arts & Media in Warrenton, VA with 1.9%.
What is the Percentage of Population Employed in Education, Arts & Media in Warrenton, VA?
Percentage of Population Employed in Education, Arts & Media in Warrenton is 2.4%.
What is the Percentage of Population Employed in Education, Arts & Media in Virginia?
Percentage of Population Employed in Education, Arts & Media in Virginia is 1.9%.
What is the Percentage of Population Employed in Education, Arts & Media in the United States?
Percentage of Population Employed in Education, Arts & Media in the United States is 1.8%.