Zip Codes with the Highest Percentage of Population Employed in Community & Social Service in Warrenton, VA
RELATED REPORTS & OPTIONS
Community & Social Service
Warrenton
Compare Zip Codes
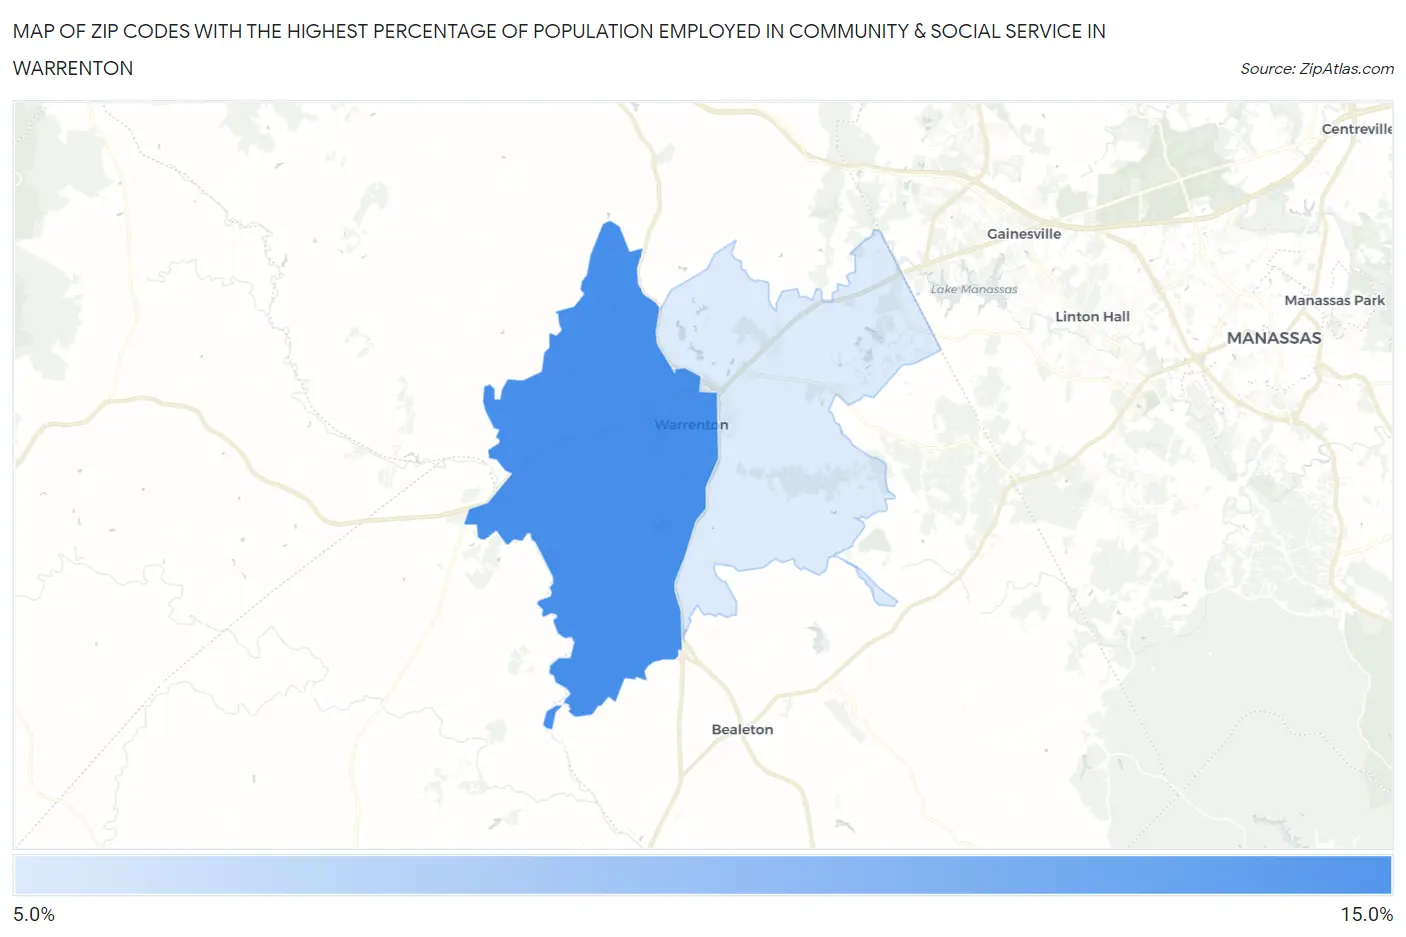
Map of Zip Codes with the Highest Percentage of Population Employed in Community & Social Service in Warrenton
0.0%
15.0%
Zip Codes with the Highest Percentage of Population Employed in Community & Social Service in Warrenton, VA
| Zip Code | % Employed | vs State | vs National | |
| 1. | 20186 | 11.2% | 12.1%(-0.911)#338 | 11.2%(+0.010)#11,072 |
| 2. | 20187 | 10.0% | 12.1%(-2.11)#410 | 11.2%(-1.19)#14,062 |
1
Common Questions
What are the Top Zip Codes with the Highest Percentage of Population Employed in Community & Social Service in Warrenton, VA?
Top Zip Codes with the Highest Percentage of Population Employed in Community & Social Service in Warrenton, VA are:
What zip code has the Highest Percentage of Population Employed in Community & Social Service in Warrenton, VA?
20186 has the Highest Percentage of Population Employed in Community & Social Service in Warrenton, VA with 11.2%.
What is the Percentage of Population Employed in Community & Social Service in Warrenton, VA?
Percentage of Population Employed in Community & Social Service in Warrenton is 11.0%.
What is the Percentage of Population Employed in Community & Social Service in Virginia?
Percentage of Population Employed in Community & Social Service in Virginia is 12.1%.
What is the Percentage of Population Employed in Community & Social Service in the United States?
Percentage of Population Employed in Community & Social Service in the United States is 11.2%.