Zip Codes with the Highest Percentage of Population Employed in Food Preparation & Serving in Harrisonburg, VA
RELATED REPORTS & OPTIONS
Food Preparation & Serving
Harrisonburg
Compare Zip Codes
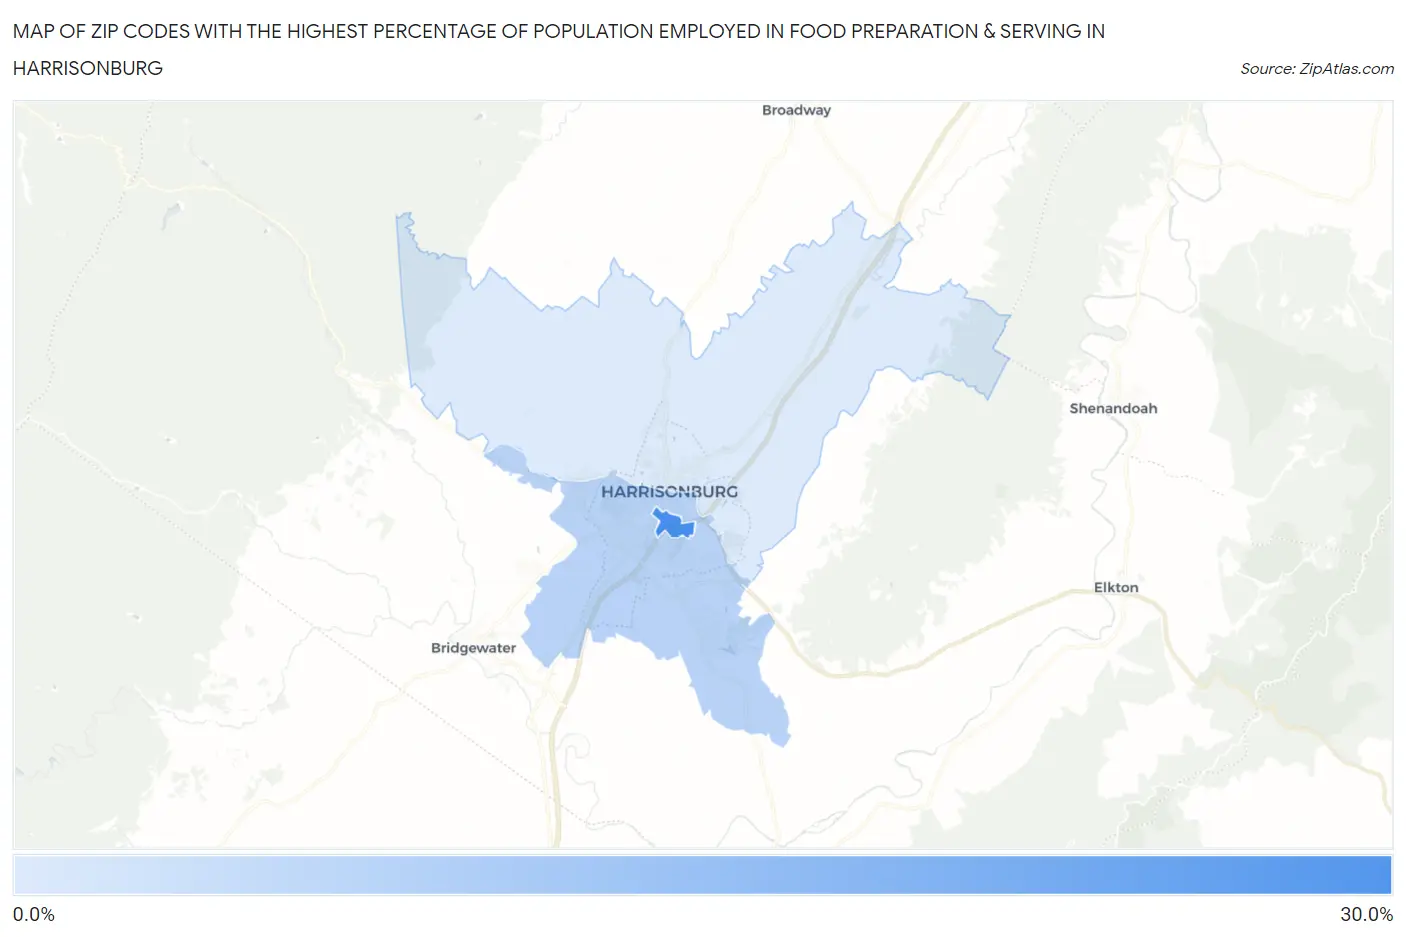
Map of Zip Codes with the Highest Percentage of Population Employed in Food Preparation & Serving in Harrisonburg
0.0%
30.0%
Zip Codes with the Highest Percentage of Population Employed in Food Preparation & Serving in Harrisonburg, VA
| Zip Code | % Employed | vs State | vs National | |
| 1. | 22807 | 29.9% | 4.8%(+25.1)#9 | 5.3%(+24.6)#214 |
| 2. | 22801 | 9.9% | 4.8%(+5.15)#77 | 5.3%(+4.65)#2,679 |
| 3. | 22802 | 4.0% | 4.8%(-0.829)#405 | 5.3%(-1.33)#17,297 |
1
Common Questions
What are the Top Zip Codes with the Highest Percentage of Population Employed in Food Preparation & Serving in Harrisonburg, VA?
Top Zip Codes with the Highest Percentage of Population Employed in Food Preparation & Serving in Harrisonburg, VA are:
What zip code has the Highest Percentage of Population Employed in Food Preparation & Serving in Harrisonburg, VA?
22807 has the Highest Percentage of Population Employed in Food Preparation & Serving in Harrisonburg, VA with 29.9%.
What is the Percentage of Population Employed in Food Preparation & Serving in Harrisonburg, VA?
Percentage of Population Employed in Food Preparation & Serving in Harrisonburg is 9.0%.
What is the Percentage of Population Employed in Food Preparation & Serving in Virginia?
Percentage of Population Employed in Food Preparation & Serving in Virginia is 4.8%.
What is the Percentage of Population Employed in Food Preparation & Serving in the United States?
Percentage of Population Employed in Food Preparation & Serving in the United States is 5.3%.