Zip Codes with the Highest Percentage of Population Employed in Computer & Mathematics in Warrenton, VA
RELATED REPORTS & OPTIONS
Computer & Mathematics
Warrenton
Compare Zip Codes
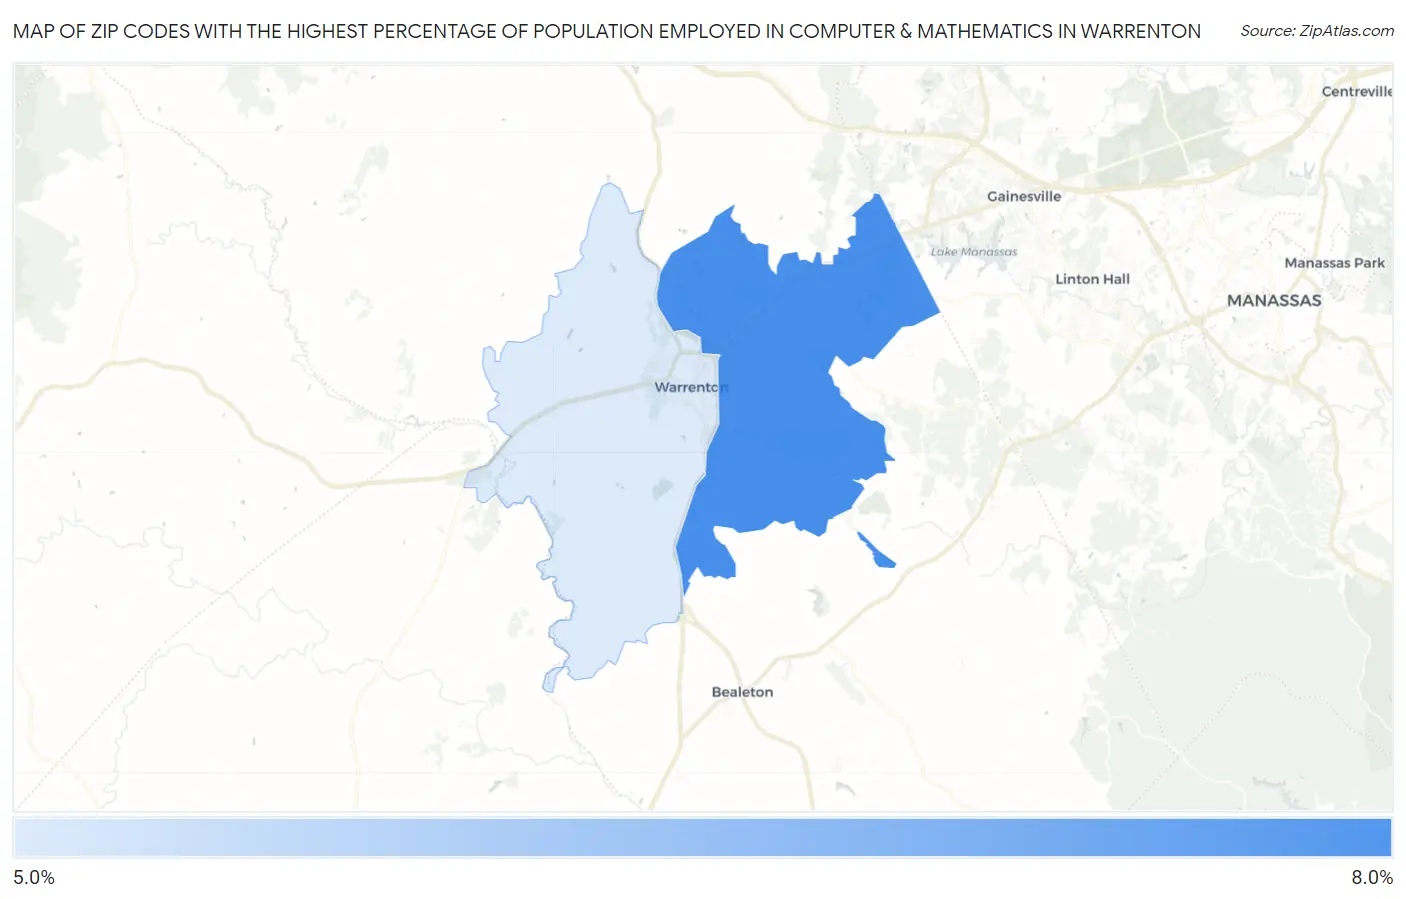
Map of Zip Codes with the Highest Percentage of Population Employed in Computer & Mathematics in Warrenton
0.0%
8.0%
Zip Codes with the Highest Percentage of Population Employed in Computer & Mathematics in Warrenton, VA
| Zip Code | % Employed | vs State | vs National | |
| 1. | 20187 | 7.5% | 6.2%(+1.28)#109 | 3.5%(+3.99)#1,384 |
| 2. | 20186 | 5.9% | 6.2%(-0.367)#154 | 3.5%(+2.35)#2,435 |
1
Common Questions
What are the Top Zip Codes with the Highest Percentage of Population Employed in Computer & Mathematics in Warrenton, VA?
Top Zip Codes with the Highest Percentage of Population Employed in Computer & Mathematics in Warrenton, VA are:
What zip code has the Highest Percentage of Population Employed in Computer & Mathematics in Warrenton, VA?
20187 has the Highest Percentage of Population Employed in Computer & Mathematics in Warrenton, VA with 7.5%.
What is the Percentage of Population Employed in Computer & Mathematics in Warrenton, VA?
Percentage of Population Employed in Computer & Mathematics in Warrenton is 5.5%.
What is the Percentage of Population Employed in Computer & Mathematics in Virginia?
Percentage of Population Employed in Computer & Mathematics in Virginia is 6.2%.
What is the Percentage of Population Employed in Computer & Mathematics in the United States?
Percentage of Population Employed in Computer & Mathematics in the United States is 3.5%.