Zip Codes with the Highest Poverty Level Among Children Under the Age of 16 in San Antonio, TX

RELATED REPORTS & OPTIONS

Highest Poverty | Child 0-16
Population
Families and Households
Female Fertility
Female Fertility (Unmarried)
Race (Community Size)
Race (Percentage)
Ancestry (Community Size)
AfghanAfricanAlbanianAleutAlsatianAmericanApacheArabArgentineanArmenianAustralianAustrianBahamianBangladeshiBarbadianBasqueBelgianBelizeanBhutaneseBlackfeetBolivianBrazilianBritishBritish West IndianBulgarianBurmeseCajunCambodianCanadianCape VerdeanCelticCentral AmericanCentral American IndianCherokeeCheyenneChickasawChileanChineseChippewaChoctawColombianComancheCosta RicanCreekCroatianCubanCzechCzechoslovakianDanishDelawareDominicanDutchDutch West IndianEastern EuropeanEcuadorianEgyptianEnglishEstonianEthiopianEuropeanFilipinoFinnishFrenchFrench American IndianFrench CanadianGermanGerman RussianGhanaianGreekGuamanian / ChamorroGuatemalanGuyaneseHaitianHonduranHopiHungarianIcelanderIndian (Asian)IndonesianInupiatIranianIraqiIrishIroquoisIsraeliItalianJamaicanJapaneseJordanianKenyanKoreanLaotianLatvianLebaneseLiberianLithuanianLumbeeLuxembourgerMacedonianMalaysianMexicanMexican American IndianMongolianMoroccanNative HawaiianNavajoNew ZealanderNicaraguanNigerianNorthern EuropeanNorwegianOkinawanOsageOttawaPakistaniPalestinianPanamanianParaguayanPennsylvania GermanPeruvianPimaPolishPortuguesePotawatomiPuebloPuerto RicanRomanianRussianSalvadoranSamoanScandinavianScotch-IrishScottishSeminoleSerbianShoshoneSierra LeoneanSiouxSlavicSlovakSloveneSomaliSouth AfricanSouth AmericanSouth American IndianSoviet UnionSpaniardSpanishSpanish AmericanSpanish American IndianSri LankanSubsaharan AfricanSudaneseSwedishSwissSyrianThaiTrinidadian and TobagonianTurkishU.S. Virgin IslanderUgandanUkrainianUruguayanUteVenezuelanVietnameseWelshWest IndianYaquiYugoslavian
Ancestry (Percentage)
AfghanAfricanAlbanianAleutAlsatianAmericanApacheArabArgentineanArmenianAustralianAustrianBahamianBangladeshiBarbadianBasqueBelgianBelizeanBhutaneseBlackfeetBolivianBrazilianBritishBritish West IndianBulgarianBurmeseCajunCambodianCanadianCape VerdeanCelticCentral AmericanCentral American IndianCherokeeCheyenneChickasawChileanChineseChippewaChoctawColombianComancheCosta RicanCreekCroatianCubanCzechCzechoslovakianDanishDelawareDominicanDutchDutch West IndianEastern EuropeanEcuadorianEgyptianEnglishEstonianEthiopianEuropeanFilipinoFinnishFrenchFrench American IndianFrench CanadianGermanGerman RussianGhanaianGreekGuamanian / ChamorroGuatemalanGuyaneseHaitianHonduranHopiHungarianIcelanderIndian (Asian)IndonesianInupiatIranianIraqiIrishIroquoisIsraeliItalianJamaicanJapaneseJordanianKenyanKoreanLaotianLatvianLebaneseLiberianLithuanianLumbeeLuxembourgerMacedonianMalaysianMexicanMexican American IndianMongolianMoroccanNative HawaiianNavajoNew ZealanderNicaraguanNigerianNorthern EuropeanNorwegianOkinawanOsageOttawaPakistaniPalestinianPanamanianParaguayanPennsylvania GermanPeruvianPimaPolishPortuguesePotawatomiPuebloPuerto RicanRomanianRussianSalvadoranSamoanScandinavianScotch-IrishScottishSeminoleSerbianShoshoneSierra LeoneanSiouxSlavicSlovakSloveneSomaliSouth AfricanSouth AmericanSouth American IndianSoviet UnionSpaniardSpanishSpanish AmericanSpanish American IndianSri LankanSubsaharan AfricanSudaneseSwedishSwissSyrianThaiTrinidadian and TobagonianTurkishU.S. Virgin IslanderUgandanUkrainianUruguayanUteVenezuelanVietnameseWelshWest IndianYaquiYugoslavian
Immigrant Origin (Total)
AfghanistanAfricaArgentinaAsiaAustraliaAustriaBangladeshBarbadosBelizeBoliviaBrazilBulgariaBurma / MyanmarCambodiaCameroonCanadaCaribbeanCentral AmericaChileChinaColombiaCongoCosta RicaCubaCzechoslovakiaDenmarkDominican RepublicEastern AfricaEastern AsiaEastern EuropeEcuadorEgyptEl SalvadorEnglandEritreaEthiopiaEuropeFijiFranceGermanyGhanaGreeceGuatemalaGuyanaHaitiHondurasHong KongHungaryIndiaIndonesiaIranIraqIrelandIsraelItalyJamaicaJapanJordanKazakhstanKenyaKoreaKuwaitLaosLatin AmericaLatviaLebanonLiberiaLithuaniaMalaysiaMexicoMiddle AfricaMoldovaMoroccoNepalNetherlandsNicaraguaNigeriaNorthern AfricaNorthern EuropeNorwayOceaniaPakistanPanamaPeruPhilippinesPolandPortugalRomaniaRussiaSaudi ArabiaScotlandSerbiaSierra LeoneSingaporeSomaliaSouth AfricaSouth AmericaSouth Central AsiaSouth Eastern AsiaSouthern EuropeSpainSri LankaSudanSwedenSwitzerlandSyriaTaiwanThailandTrinidad and TobagoTurkeyUgandaUkraineUruguayUzbekistanVenezuelaVietnamWestern AfricaWestern AsiaWestern EuropeZaireZimbabwe
Immigrant Origin (Percentage)
AfghanistanAfricaArgentinaAsiaAustraliaAustriaBangladeshBarbadosBelizeBoliviaBrazilBulgariaBurma / MyanmarCambodiaCameroonCanadaCaribbeanCentral AmericaChileChinaColombiaCongoCosta RicaCubaCzechoslovakiaDenmarkDominican RepublicEastern AfricaEastern AsiaEastern EuropeEcuadorEgyptEl SalvadorEnglandEritreaEthiopiaEuropeFijiFranceGermanyGhanaGreeceGuatemalaGuyanaHaitiHondurasHong KongHungaryIndiaIndonesiaIranIraqIrelandIsraelItalyJamaicaJapanJordanKazakhstanKenyaKoreaKuwaitLaosLatin AmericaLatviaLebanonLiberiaLithuaniaMalaysiaMexicoMiddle AfricaMoldovaMoroccoNepalNetherlandsNicaraguaNigeriaNorthern AfricaNorthern EuropeNorwayOceaniaPakistanPanamaPeruPhilippinesPolandPortugalRomaniaRussiaSaudi ArabiaScotlandSerbiaSierra LeoneSingaporeSomaliaSouth AfricaSouth AmericaSouth Central AsiaSouth Eastern AsiaSouthern EuropeSpainSri LankaSudanSwedenSwitzerlandSyriaTaiwanThailandTrinidad and TobagoTurkeyUgandaUkraineUruguayUzbekistanVenezuelaVietnamWestern AfricaWestern AsiaWestern EuropeZaireZimbabwe
Income
Income (Families)
Income (Households)
Poverty
Poverty (Families)
Unemployment
Employment Occupations
Employment Industries
Employer Class
Commute Time
Commute Means
School Enrollment
Education by Degree Field
Occupancy
Finances
Physical Characteristics
San Antonio
Compare Zip Codes
Comparison Subject

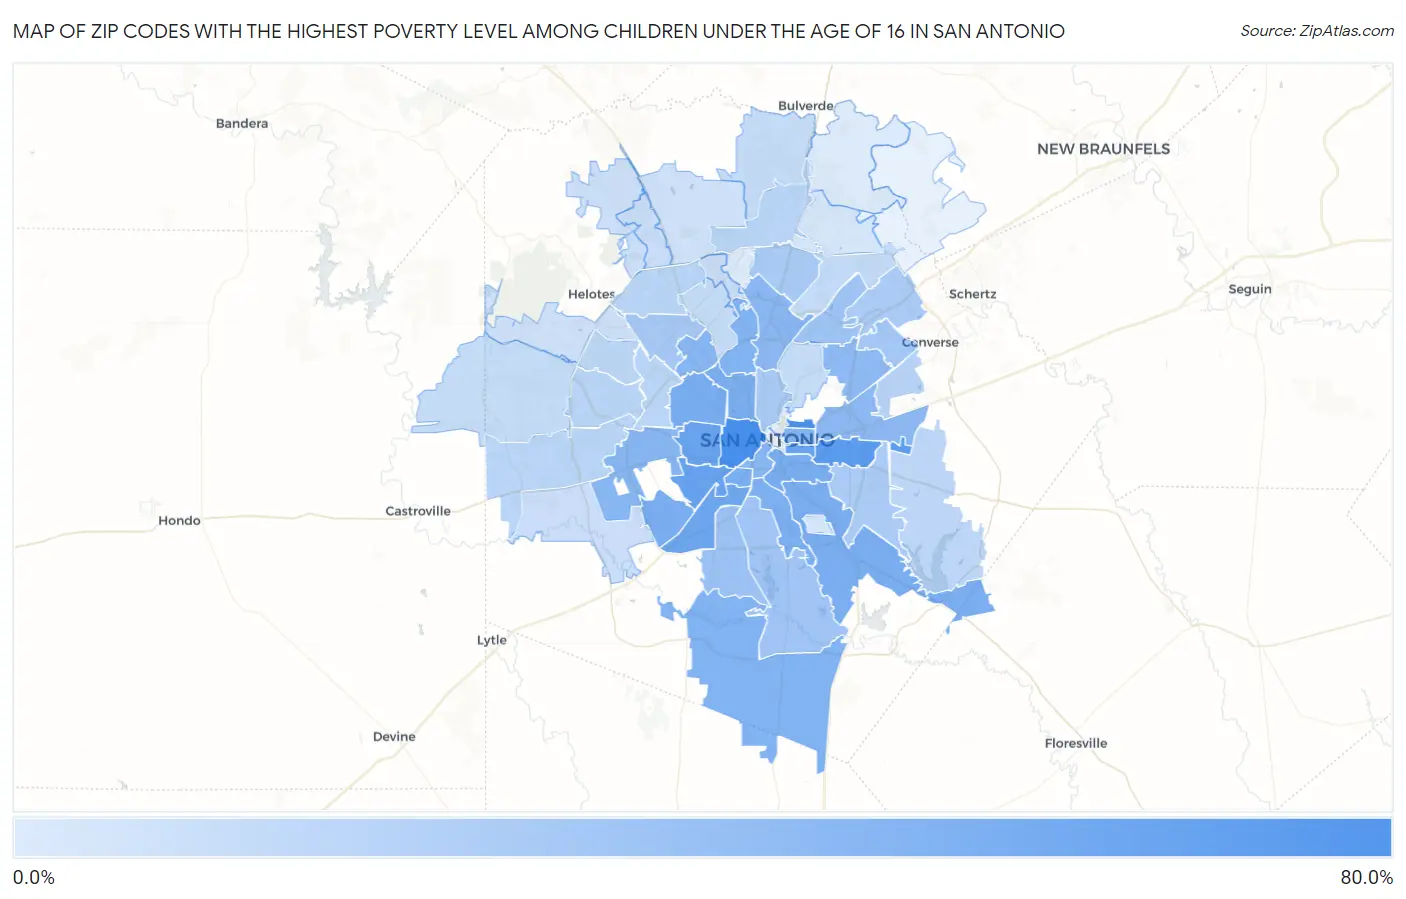
Map of Zip Codes with the Highest Poverty Level Among Children Under the Age of 16 in San Antonio

0.0%
80.0%
Zip Codes with the Highest Poverty Level Among Children Under the Age of 16 in San Antonio Map

Zip Codes with the Highest Poverty Level Among Children Under the Age of 16 in San Antonio, TX

Zip Code Child Poverty vs State vs National
1.7820763.5%19.7%(+43.8)#4116.9%(+46.6)#944
2.7820860.5%19.7%(+40.8)#4916.9%(+43.5)#1,066
3.7822052.9%19.7%(+33.2)#8516.9%(+35.9)#1,573
4.7822647.7%19.7%(+28.0)#10716.9%(+30.8)#2,077
5.7823747.1%19.7%(+27.4)#11116.9%(+30.2)#2,139
6.7820345.7%19.7%(+26.0)#12616.9%(+28.8)#2,308
7.7821144.1%19.7%(+24.5)#14116.9%(+27.2)#2,524
8.7822839.9%19.7%(+20.2)#19516.9%(+22.9)#3,194
9.7821039.2%19.7%(+19.5)#20716.9%(+22.3)#3,314
10.7822339.0%19.7%(+19.3)#21016.9%(+22.0)#3,360
11.7824238.9%19.7%(+19.2)#21216.9%(+21.9)#3,377
12.7822538.2%19.7%(+18.5)#22216.9%(+21.2)#3,504
13.7820137.6%19.7%(+17.9)#23116.9%(+20.7)#3,618
14.7821437.2%19.7%(+17.5)#23616.9%(+20.3)#3,700
15.7826435.7%19.7%(+16.0)#26216.9%(+18.8)#4,021
16.7821335.6%19.7%(+15.9)#26616.9%(+18.7)#4,057
17.7820235.1%19.7%(+15.4)#27216.9%(+18.1)#4,184
18.7822732.9%19.7%(+13.2)#31516.9%(+15.9)#4,767
19.7820432.2%19.7%(+12.5)#33316.9%(+15.2)#4,953
20.7822932.1%19.7%(+12.4)#33616.9%(+15.2)#4,965
21.7821631.7%19.7%(+12.0)#35116.9%(+14.8)#5,089
22.7821930.7%19.7%(+11.0)#37916.9%(+13.7)#5,390
23.7821829.3%19.7%(+9.58)#42516.9%(+12.3)#5,832
24.7822424.4%19.7%(+4.72)#55916.9%(+7.46)#7,861
25.7821723.1%19.7%(+3.42)#59616.9%(+6.17)#8,425
26.7822122.2%19.7%(+2.47)#63716.9%(+5.21)#8,936
27.7823921.4%19.7%(+1.75)#65616.9%(+4.50)#9,282
28.7824020.2%19.7%(+0.485)#71716.9%(+3.23)#10,026
29.7823219.8%19.7%(+0.132)#72516.9%(+2.88)#10,224
30.7821219.2%19.7%(-0.446)#75216.9%(+2.30)#10,548
31.7823318.7%19.7%(-0.980)#77416.9%(+1.77)#10,864
32.7822218.1%19.7%(-1.55)#79816.9%(+1.20)#11,196
33.7824413.7%19.7%(-6.03)#98216.9%(-3.29)#14,322
34.7824912.7%19.7%(-7.00)#1,02116.9%(-4.25)#15,041
35.7824512.6%19.7%(-7.10)#1,02816.9%(-4.35)#15,138
36.7825112.5%19.7%(-7.21)#1,03216.9%(-4.46)#15,247
37.7825812.2%19.7%(-7.50)#1,04016.9%(-4.75)#15,459
38.7823812.1%19.7%(-7.61)#1,04516.9%(-4.87)#15,550
39.7826311.6%19.7%(-8.09)#1,07116.9%(-5.35)#15,964
40.7825011.6%19.7%(-8.11)#1,07216.9%(-5.36)#15,972
41.782479.0%19.7%(-10.7)#1,17416.9%(-7.97)#18,260
42.782538.6%19.7%(-11.0)#1,19316.9%(-8.29)#18,536
43.782608.6%19.7%(-11.1)#1,19816.9%(-8.36)#18,586
44.782308.4%19.7%(-11.3)#1,20916.9%(-8.51)#18,726
45.782098.4%19.7%(-11.3)#1,21316.9%(-8.54)#18,768
46.782566.9%19.7%(-12.8)#1,27816.9%(-10.0)#20,124
47.782526.5%19.7%(-13.2)#1,30116.9%(-10.5)#20,566
48.782316.4%19.7%(-13.3)#1,30616.9%(-10.6)#20,678
49.782555.6%19.7%(-14.1)#1,34916.9%(-11.3)#21,388
50.782575.3%19.7%(-14.4)#1,36616.9%(-11.6)#21,739
51.782544.8%19.7%(-14.9)#1,38916.9%(-12.1)#22,205
52.782352.8%19.7%(-16.9)#1,48916.9%(-14.2)#24,153
53.782592.5%19.7%(-17.2)#1,50116.9%(-14.5)#24,415
54.782480.58%19.7%(-19.1)#1,54716.9%(-16.4)#25,885
55.782610.50%19.7%(-19.2)#1,54916.9%(-16.4)#25,930

Common Questions

What are the Top 10 Zip Codes with the Highest Poverty Level Among Children Under the Age of 16 in San Antonio, TX?
Top 10 Zip Codes with the Highest Poverty Level Among Children Under the Age of 16 in San Antonio, TX are:
#1
63.5%
#2
60.5%
#3
52.9%
#4
47.7%
#5
47.1%
#6
45.7%
#7
44.1%
#8
39.9%
#9
39.2%
#10
39.0%
What zip code has the Highest Poverty Level Among Children Under the Age of 16 in San Antonio, TX?
78207 has the Highest Poverty Level Among Children Under the Age of 16 in San Antonio, TX with 63.5%.
What is the Poverty Level Among Children Under the Age of 16 in San Antonio, TX?
Poverty Level Among Children Under the Age of 16 in San Antonio is 26.5%.
What is the Poverty Level Among Children Under the Age of 16 in Texas?
Poverty Level Among Children Under the Age of 16 in Texas is 19.7%.
What is the Poverty Level Among Children Under the Age of 16 in the United States?
Poverty Level Among Children Under the Age of 16 in the United States is 16.9%.