Zip Codes with the Highest Percentage of Hawaiian / Pacific Population in San Antonio, TX
RELATED REPORTS & OPTIONS
Hawaiian / Pacific
San Antonio
Compare Zip Codes
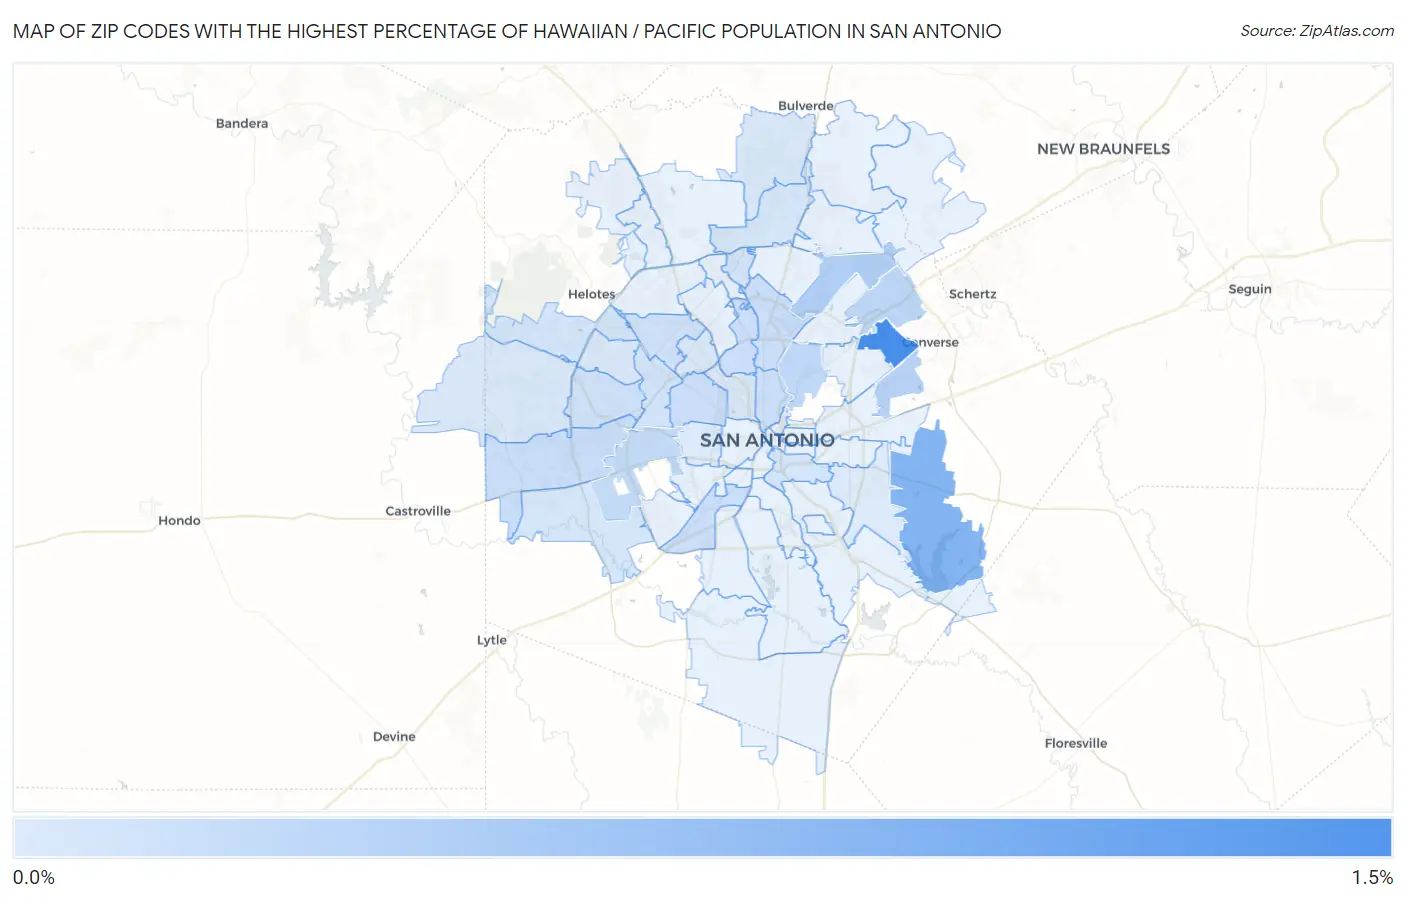
Map of Zip Codes with the Highest Percentage of Hawaiian / Pacific Population in San Antonio
0.0%
1.5%
Zip Codes with the Highest Percentage of Hawaiian / Pacific Population in San Antonio, TX
| Zip Code | Hawaiian / Pacific | vs State | vs National | |
| 1. | 78239 | 1.2% | 0.094%(+1.10)#28 | 0.19%(+1.00)#613 |
| 2. | 78263 | 0.73% | 0.094%(+0.633)#47 | 0.19%(+0.538)#1,020 |
| 3. | 78247 | 0.36% | 0.094%(+0.267)#98 | 0.19%(+0.172)#1,855 |
| 4. | 78244 | 0.31% | 0.094%(+0.213)#117 | 0.19%(+0.118)#2,086 |
| 5. | 78233 | 0.26% | 0.094%(+0.171)#134 | 0.19%(+0.076)#2,336 |
| 6. | 78209 | 0.26% | 0.094%(+0.166)#135 | 0.19%(+0.071)#2,375 |
| 7. | 78227 | 0.22% | 0.094%(+0.128)#154 | 0.19%(+0.033)#2,631 |
| 8. | 78245 | 0.18% | 0.094%(+0.085)#179 | 0.19%(-0.010)#3,007 |
| 9. | 78212 | 0.17% | 0.094%(+0.077)#187 | 0.19%(-0.018)#3,098 |
| 10. | 78213 | 0.16% | 0.094%(+0.070)#196 | 0.19%(-0.026)#3,183 |
| 11. | 78228 | 0.16% | 0.094%(+0.069)#197 | 0.19%(-0.026)#3,187 |
| 12. | 78211 | 0.16% | 0.094%(+0.069)#199 | 0.19%(-0.026)#3,194 |
| 13. | 78216 | 0.16% | 0.094%(+0.067)#201 | 0.19%(-0.028)#3,217 |
| 14. | 78240 | 0.13% | 0.094%(+0.033)#231 | 0.19%(-0.062)#3,635 |
| 15. | 78251 | 0.12% | 0.094%(+0.027)#239 | 0.19%(-0.068)#3,721 |
| 16. | 78248 | 0.11% | 0.094%(+0.019)#248 | 0.19%(-0.076)#3,839 |
| 17. | 78238 | 0.10% | 0.094%(+0.011)#256 | 0.19%(-0.084)#3,962 |
| 18. | 78254 | 0.096% | 0.094%(+0.003)#270 | 0.19%(-0.093)#4,116 |
| 19. | 78210 | 0.084% | 0.094%(-0.010)#285 | 0.19%(-0.105)#4,352 |
| 20. | 78258 | 0.079% | 0.094%(-0.015)#293 | 0.19%(-0.110)#4,445 |
| 21. | 78252 | 0.070% | 0.094%(-0.023)#315 | 0.19%(-0.118)#4,619 |
| 22. | 78260 | 0.064% | 0.094%(-0.030)#331 | 0.19%(-0.125)#4,781 |
| 23. | 78253 | 0.056% | 0.094%(-0.037)#342 | 0.19%(-0.132)#4,928 |
| 24. | 78229 | 0.053% | 0.094%(-0.041)#351 | 0.19%(-0.136)#5,017 |
| 25. | 78201 | 0.040% | 0.094%(-0.054)#378 | 0.19%(-0.149)#5,354 |
| 26. | 78250 | 0.030% | 0.094%(-0.063)#397 | 0.19%(-0.158)#5,643 |
| 27. | 78222 | 0.024% | 0.094%(-0.069)#416 | 0.19%(-0.165)#5,865 |
| 28. | 78237 | 0.021% | 0.094%(-0.073)#428 | 0.19%(-0.168)#5,969 |
1
Common Questions
What are the Top 10 Zip Codes with the Highest Percentage of Hawaiian / Pacific Population in San Antonio, TX?
Top 10 Zip Codes with the Highest Percentage of Hawaiian / Pacific Population in San Antonio, TX are:
What zip code has the Highest Percentage of Hawaiian / Pacific Population in San Antonio, TX?
78239 has the Highest Percentage of Hawaiian / Pacific Population in San Antonio, TX with 1.2%.
What is the Percentage of Hawaiian / Pacific Population in San Antonio, TX?
Percentage of Hawaiian / Pacific Population in San Antonio is 0.097%.
What is the Percentage of Hawaiian / Pacific Population in Texas?
Percentage of Hawaiian / Pacific Population in Texas is 0.094%.
What is the Percentage of Hawaiian / Pacific Population in the United States?
Percentage of Hawaiian / Pacific Population in the United States is 0.19%.