Zip Codes with the Most Immigrants from South America in San Antonio, TX
RELATED REPORTS & OPTIONS
South America
San Antonio
Compare Zip Codes
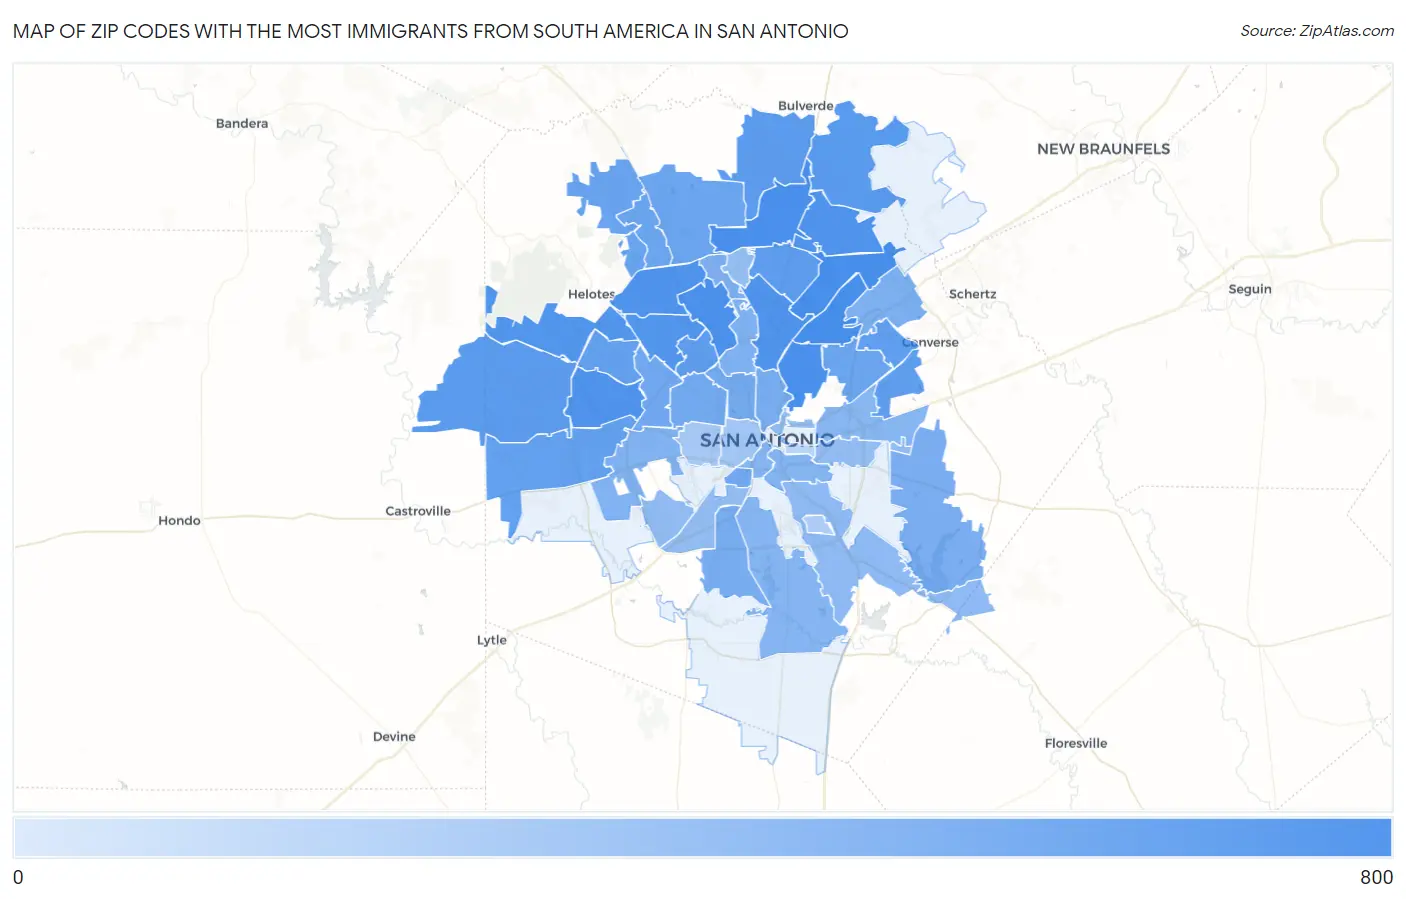
Map of Zip Codes with the Most Immigrants from South America in San Antonio
0
800
Zip Codes with the Most Immigrants from South America in San Antonio, TX
| Zip Code | South America | vs State | vs National | |
| 1. | 78217 | 631 | 225,242(0.28%)#78 | 3,636,375(0.02%)#1,192 |
| 2. | 78247 | 616 | 225,242(0.27%)#82 | 3,636,375(0.02%)#1,226 |
| 3. | 78258 | 576 | 225,242(0.26%)#90 | 3,636,375(0.02%)#1,308 |
| 4. | 78209 | 572 | 225,242(0.25%)#93 | 3,636,375(0.02%)#1,314 |
| 5. | 78230 | 504 | 225,242(0.22%)#109 | 3,636,375(0.01%)#1,493 |
| 6. | 78251 | 466 | 225,242(0.21%)#128 | 3,636,375(0.01%)#1,611 |
| 7. | 78249 | 463 | 225,242(0.21%)#129 | 3,636,375(0.01%)#1,619 |
| 8. | 78259 | 408 | 225,242(0.18%)#153 | 3,636,375(0.01%)#1,841 |
| 9. | 78216 | 405 | 225,242(0.18%)#155 | 3,636,375(0.01%)#1,854 |
| 10. | 78240 | 388 | 225,242(0.17%)#165 | 3,636,375(0.01%)#1,930 |
| 11. | 78254 | 381 | 225,242(0.17%)#167 | 3,636,375(0.01%)#1,957 |
| 12. | 78261 | 304 | 225,242(0.13%)#204 | 3,636,375(0.01%)#2,384 |
| 13. | 78260 | 268 | 225,242(0.12%)#228 | 3,636,375(0.01%)#2,660 |
| 14. | 78253 | 249 | 225,242(0.11%)#240 | 3,636,375(0.01%)#2,820 |
| 15. | 78229 | 244 | 225,242(0.11%)#245 | 3,636,375(0.01%)#2,864 |
| 16. | 78232 | 223 | 225,242(0.10%)#259 | 3,636,375(0.01%)#3,102 |
| 17. | 78244 | 218 | 225,242(0.10%)#261 | 3,636,375(0.01%)#3,150 |
| 18. | 78239 | 205 | 225,242(0.09%)#277 | 3,636,375(0.01%)#3,300 |
| 19. | 78250 | 197 | 225,242(0.09%)#285 | 3,636,375(0.01%)#3,388 |
| 20. | 78245 | 196 | 225,242(0.09%)#286 | 3,636,375(0.01%)#3,401 |
| 21. | 78255 | 137 | 225,242(0.06%)#352 | 3,636,375(0.00%)#4,230 |
| 22. | 78256 | 132 | 225,242(0.06%)#360 | 3,636,375(0.00%)#4,335 |
| 23. | 78257 | 130 | 225,242(0.06%)#364 | 3,636,375(0.00%)#4,374 |
| 24. | 78218 | 128 | 225,242(0.06%)#369 | 3,636,375(0.00%)#4,401 |
| 25. | 78238 | 103 | 225,242(0.05%)#397 | 3,636,375(0.00%)#4,946 |
| 26. | 78225 | 100 | 225,242(0.04%)#406 | 3,636,375(0.00%)#5,039 |
| 27. | 78228 | 96 | 225,242(0.04%)#408 | 3,636,375(0.00%)#5,116 |
| 28. | 78201 | 90 | 225,242(0.04%)#418 | 3,636,375(0.00%)#5,277 |
| 29. | 78212 | 79 | 225,242(0.04%)#452 | 3,636,375(0.00%)#5,588 |
| 30. | 78224 | 76 | 225,242(0.03%)#464 | 3,636,375(0.00%)#5,679 |
| 31. | 78263 | 69 | 225,242(0.03%)#482 | 3,636,375(0.00%)#5,976 |
| 32. | 78233 | 61 | 225,242(0.03%)#500 | 3,636,375(0.00%)#6,236 |
| 33. | 78213 | 58 | 225,242(0.03%)#505 | 3,636,375(0.00%)#6,354 |
| 34. | 78231 | 58 | 225,242(0.03%)#509 | 3,636,375(0.00%)#6,384 |
| 35. | 78227 | 52 | 225,242(0.02%)#520 | 3,636,375(0.00%)#6,636 |
| 36. | 78210 | 46 | 225,242(0.02%)#545 | 3,636,375(0.00%)#6,940 |
| 37. | 78221 | 44 | 225,242(0.02%)#554 | 3,636,375(0.00%)#7,034 |
| 38. | 78204 | 42 | 225,242(0.02%)#565 | 3,636,375(0.00%)#7,183 |
| 39. | 78219 | 37 | 225,242(0.02%)#582 | 3,636,375(0.00%)#7,480 |
| 40. | 78223 | 28 | 225,242(0.01%)#623 | 3,636,375(0.00%)#8,113 |
| 41. | 78242 | 25 | 225,242(0.01%)#644 | 3,636,375(0.00%)#8,378 |
| 42. | 78211 | 22 | 225,242(0.01%)#660 | 3,636,375(0.00%)#8,645 |
| 43. | 78220 | 22 | 225,242(0.01%)#661 | 3,636,375(0.00%)#8,677 |
| 44. | 78248 | 21 | 225,242(0.01%)#669 | 3,636,375(0.00%)#8,782 |
| 45. | 78215 | 21 | 225,242(0.01%)#673 | 3,636,375(0.00%)#8,827 |
| 46. | 78208 | 19 | 225,242(0.01%)#685 | 3,636,375(0.00%)#9,064 |
| 47. | 78207 | 11 | 225,242(0.00%)#747 | 3,636,375(0.00%)#10,067 |
| 48. | 78237 | 10 | 225,242(0.00%)#755 | 3,636,375(0.00%)#10,232 |
| 49. | 78235 | 6 | 225,242(0.00%)#807 | 3,636,375(0.00%)#11,161 |
| 50. | 78203 | 4 | 225,242(0.00%)#833 | 3,636,375(0.00%)#11,566 |
1
Common Questions
What are the Top 10 Zip Codes with the Most Immigrants from South America in San Antonio, TX?
Top 10 Zip Codes with the Most Immigrants from South America in San Antonio, TX are:
What zip code has the Most Immigrants from South America in San Antonio, TX?
78217 has the Most Immigrants from South America in San Antonio, TX with 631.
What is the Total Immigrants from South America in San Antonio, TX?
Total Immigrants from South America in San Antonio is 7,075.
What is the Total Immigrants from South America in Texas?
Total Immigrants from South America in Texas is 225,242.
What is the Total Immigrants from South America in the United States?
Total Immigrants from South America in the United States is 3,636,375.