Zip Codes with the Highest Percentage of Households with Income Above $200,000 in San Antonio, TX
RELATED REPORTS & OPTIONS
Household Income | $200k+
San Antonio
Compare Zip Codes
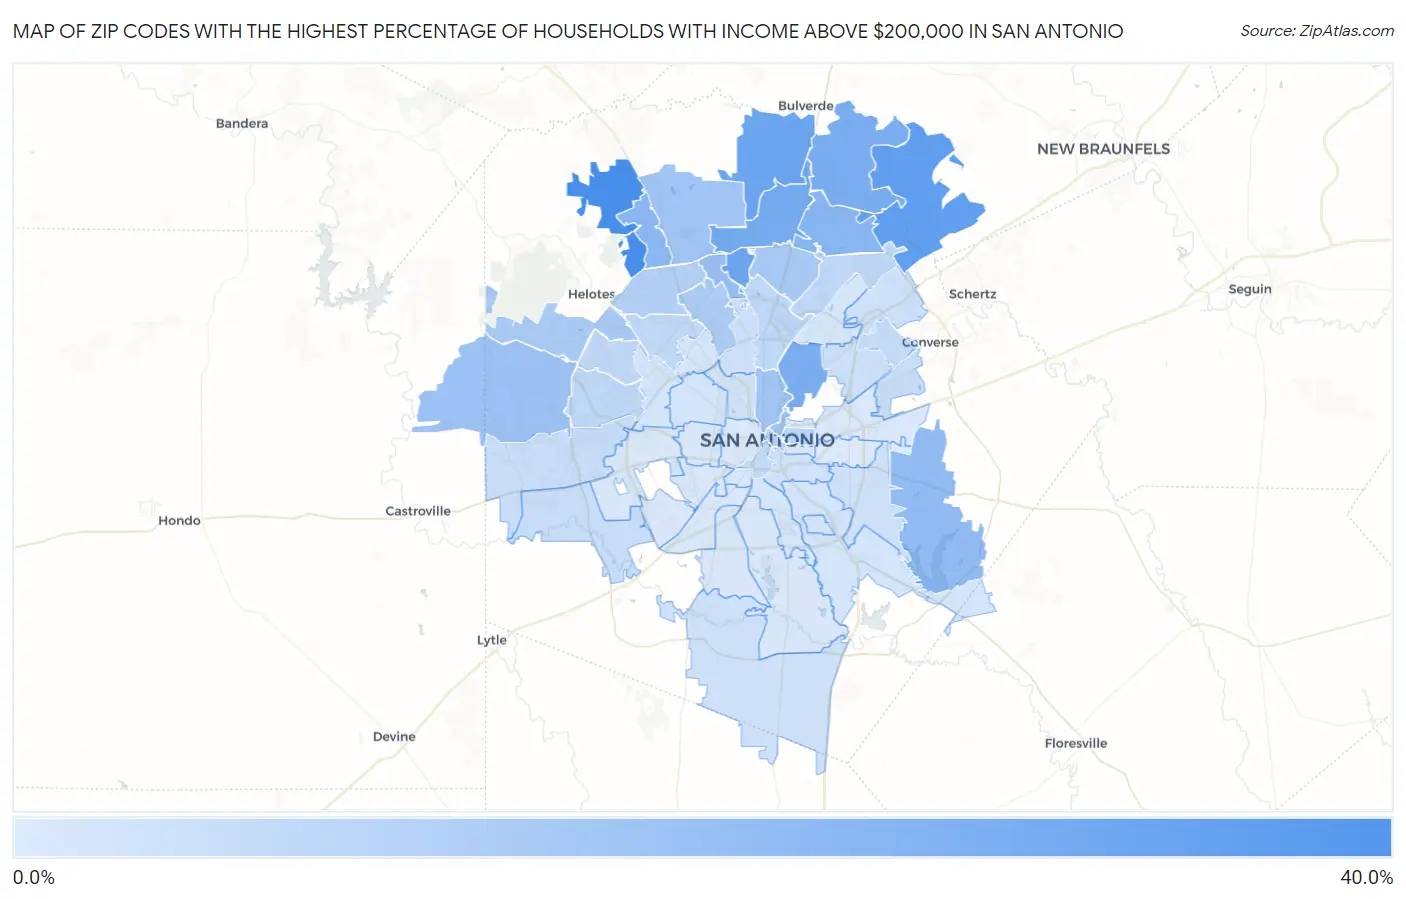
Map of Zip Codes with the Highest Percentage of Households with Income Above $200,000 in San Antonio
0.0%
40.0%
Zip Codes with the Highest Percentage of Households with Income Above $200,000 in San Antonio, TX
| Zip Code | Households with Income > $200k | vs State | vs National | |
| 1. | 78255 | 34.1% | 10.6%(+23.5)#47 | 11.4%(+22.7)#1,050 |
| 2. | 78266 | 27.7% | 10.6%(+17.1)#78 | 11.4%(+16.3)#1,780 |
| 3. | 78260 | 25.1% | 10.6%(+14.5)#97 | 11.4%(+13.7)#2,168 |
| 4. | 78248 | 24.4% | 10.6%(+13.8)#103 | 11.4%(+13.0)#2,297 |
| 5. | 78258 | 22.7% | 10.6%(+12.1)#117 | 11.4%(+11.3)#2,617 |
| 6. | 78209 | 21.6% | 10.6%(+11.0)#141 | 11.4%(+10.2)#2,864 |
| 7. | 78261 | 21.4% | 10.6%(+10.8)#145 | 11.4%(+10.00)#2,903 |
| 8. | 78259 | 18.2% | 10.6%(+7.60)#191 | 11.4%(+6.80)#3,778 |
| 9. | 78256 | 17.2% | 10.6%(+6.60)#204 | 11.4%(+5.80)#4,115 |
| 10. | 78263 | 16.1% | 10.6%(+5.50)#228 | 11.4%(+4.70)#4,531 |
| 11. | 78231 | 14.8% | 10.6%(+4.20)#256 | 11.4%(+3.40)#5,091 |
| 12. | 78253 | 13.6% | 10.6%(+3.00)#293 | 11.4%(+2.20)#5,668 |
| 13. | 78212 | 12.8% | 10.6%(+2.20)#329 | 11.4%(+1.40)#6,130 |
| 14. | 78257 | 12.8% | 10.6%(+2.20)#331 | 11.4%(+1.40)#6,143 |
| 15. | 78215 | 12.2% | 10.6%(+1.60)#354 | 11.4%(+0.800)#6,553 |
| 16. | 78232 | 11.2% | 10.6%(+0.600)#403 | 11.4%(-0.200)#7,223 |
| 17. | 78254 | 10.5% | 10.6%(-0.100)#442 | 11.4%(-0.900)#7,768 |
| 18. | 78230 | 10.3% | 10.6%(-0.300)#450 | 11.4%(-1.10)#7,947 |
| 19. | 78249 | 8.6% | 10.6%(-2.00)#554 | 11.4%(-2.80)#9,628 |
| 20. | 78205 | 8.3% | 10.6%(-2.30)#589 | 11.4%(-3.10)#10,065 |
| 21. | 78202 | 7.1% | 10.6%(-3.50)#695 | 11.4%(-4.30)#11,659 |
| 22. | 78247 | 6.5% | 10.6%(-4.10)#757 | 11.4%(-4.90)#12,554 |
| 23. | 78216 | 6.5% | 10.6%(-4.10)#758 | 11.4%(-4.90)#12,557 |
| 24. | 78251 | 6.1% | 10.6%(-4.50)#802 | 11.4%(-5.30)#13,235 |
| 25. | 78250 | 6.0% | 10.6%(-4.60)#813 | 11.4%(-5.40)#13,426 |
| 26. | 78240 | 5.9% | 10.6%(-4.70)#831 | 11.4%(-5.50)#13,616 |
| 27. | 78239 | 5.5% | 10.6%(-5.10)#893 | 11.4%(-5.90)#14,490 |
| 28. | 78204 | 5.3% | 10.6%(-5.30)#928 | 11.4%(-6.10)#14,926 |
| 29. | 78252 | 4.3% | 10.6%(-6.30)#1,053 | 11.4%(-7.10)#17,297 |
| 30. | 78245 | 4.2% | 10.6%(-6.40)#1,067 | 11.4%(-7.20)#17,524 |
| 31. | 78244 | 4.2% | 10.6%(-6.40)#1,070 | 11.4%(-7.20)#17,547 |
| 32. | 78213 | 3.3% | 10.6%(-7.30)#1,206 | 11.4%(-8.10)#20,001 |
| 33. | 78218 | 3.3% | 10.6%(-7.30)#1,208 | 11.4%(-8.10)#20,006 |
| 34. | 78222 | 3.0% | 10.6%(-7.60)#1,250 | 11.4%(-8.40)#20,903 |
| 35. | 78264 | 3.0% | 10.6%(-7.60)#1,253 | 11.4%(-8.40)#20,933 |
| 36. | 78233 | 2.9% | 10.6%(-7.70)#1,263 | 11.4%(-8.50)#21,144 |
| 37. | 78210 | 2.4% | 10.6%(-8.20)#1,356 | 11.4%(-9.00)#22,622 |
| 38. | 78223 | 2.2% | 10.6%(-8.40)#1,385 | 11.4%(-9.20)#23,158 |
| 39. | 78235 | 2.2% | 10.6%(-8.40)#1,395 | 11.4%(-9.20)#23,310 |
| 40. | 78201 | 2.1% | 10.6%(-8.50)#1,404 | 11.4%(-9.30)#23,446 |
| 41. | 78238 | 2.1% | 10.6%(-8.50)#1,409 | 11.4%(-9.30)#23,469 |
| 42. | 78228 | 1.9% | 10.6%(-8.70)#1,434 | 11.4%(-9.50)#24,029 |
| 43. | 78229 | 1.8% | 10.6%(-8.80)#1,451 | 11.4%(-9.60)#24,291 |
| 44. | 78214 | 1.8% | 10.6%(-8.80)#1,455 | 11.4%(-9.60)#24,307 |
| 45. | 78225 | 1.8% | 10.6%(-8.80)#1,457 | 11.4%(-9.60)#24,326 |
| 46. | 78217 | 1.7% | 10.6%(-8.90)#1,471 | 11.4%(-9.70)#24,546 |
| 47. | 78227 | 1.4% | 10.6%(-9.20)#1,505 | 11.4%(-10.00)#25,284 |
| 48. | 78203 | 1.3% | 10.6%(-9.30)#1,522 | 11.4%(-10.1)#25,577 |
| 49. | 78221 | 1.2% | 10.6%(-9.40)#1,533 | 11.4%(-10.2)#25,734 |
| 50. | 78237 | 1.2% | 10.6%(-9.40)#1,534 | 11.4%(-10.2)#25,737 |
| 51. | 78224 | 1.2% | 10.6%(-9.40)#1,536 | 11.4%(-10.2)#25,755 |
| 52. | 78219 | 0.90% | 10.6%(-9.70)#1,571 | 11.4%(-10.5)#26,381 |
| 53. | 78226 | 0.90% | 10.6%(-9.70)#1,573 | 11.4%(-10.5)#26,405 |
| 54. | 78207 | 0.70% | 10.6%(-9.90)#1,590 | 11.4%(-10.7)#26,723 |
| 55. | 78242 | 0.70% | 10.6%(-9.90)#1,591 | 11.4%(-10.7)#26,724 |
| 56. | 78211 | 0.70% | 10.6%(-9.90)#1,592 | 11.4%(-10.7)#26,726 |
| 57. | 78208 | 0.60% | 10.6%(-10.00)#1,605 | 11.4%(-10.8)#26,962 |
| 58. | 78220 | 0.30% | 10.6%(-10.3)#1,624 | 11.4%(-11.1)#27,366 |
1
Common Questions
What are the Top 10 Zip Codes with the Highest Percentage of Households with Income Above $200,000 in San Antonio, TX?
Top 10 Zip Codes with the Highest Percentage of Households with Income Above $200,000 in San Antonio, TX are:
What zip code has the Highest Percentage of Households with Income Above $200,000 in San Antonio, TX?
78255 has the Highest Percentage of Households with Income Above $200,000 in San Antonio, TX with 34.1%.
What is the Percentage of Households with Income Above $200,000 in San Antonio, TX?
Percentage of Households with Income Above $200,000 in San Antonio is 5.7%.
What is the Percentage of Households with Income Above $200,000 in Texas?
Percentage of Households with Income Above $200,000 in Texas is 10.6%.
What is the Percentage of Households with Income Above $200,000 in the United States?
Percentage of Households with Income Above $200,000 in the United States is 11.4%.