Zip Codes with the Lowest Percentage of Single Fathers in San Antonio, TX

RELATED REPORTS & OPTIONS

Fewest Single Fathers
Population
Families and Households
Female Fertility
Female Fertility (Unmarried)
Race (Community Size)
Race (Percentage)
Ancestry (Community Size)
AfghanAfricanAlbanianAleutAlsatianAmericanApacheArabArgentineanArmenianAustralianAustrianBahamianBangladeshiBarbadianBasqueBelgianBelizeanBhutaneseBlackfeetBolivianBrazilianBritishBritish West IndianBulgarianBurmeseCajunCambodianCanadianCape VerdeanCelticCentral AmericanCentral American IndianCherokeeCheyenneChickasawChileanChineseChippewaChoctawColombianComancheCosta RicanCreekCroatianCubanCzechCzechoslovakianDanishDelawareDominicanDutchDutch West IndianEastern EuropeanEcuadorianEgyptianEnglishEstonianEthiopianEuropeanFilipinoFinnishFrenchFrench American IndianFrench CanadianGermanGerman RussianGhanaianGreekGuamanian / ChamorroGuatemalanGuyaneseHaitianHonduranHopiHungarianIcelanderIndian (Asian)IndonesianInupiatIranianIraqiIrishIroquoisIsraeliItalianJamaicanJapaneseJordanianKenyanKoreanLaotianLatvianLebaneseLiberianLithuanianLumbeeLuxembourgerMacedonianMalaysianMexicanMexican American IndianMongolianMoroccanNative HawaiianNavajoNew ZealanderNicaraguanNigerianNorthern EuropeanNorwegianOkinawanOsageOttawaPakistaniPalestinianPanamanianParaguayanPennsylvania GermanPeruvianPimaPolishPortuguesePotawatomiPuebloPuerto RicanRomanianRussianSalvadoranSamoanScandinavianScotch-IrishScottishSeminoleSerbianShoshoneSierra LeoneanSiouxSlavicSlovakSloveneSomaliSouth AfricanSouth AmericanSouth American IndianSoviet UnionSpaniardSpanishSpanish AmericanSpanish American IndianSri LankanSubsaharan AfricanSudaneseSwedishSwissSyrianThaiTrinidadian and TobagonianTurkishU.S. Virgin IslanderUgandanUkrainianUruguayanUteVenezuelanVietnameseWelshWest IndianYaquiYugoslavian
Ancestry (Percentage)
AfghanAfricanAlbanianAleutAlsatianAmericanApacheArabArgentineanArmenianAustralianAustrianBahamianBangladeshiBarbadianBasqueBelgianBelizeanBhutaneseBlackfeetBolivianBrazilianBritishBritish West IndianBulgarianBurmeseCajunCambodianCanadianCape VerdeanCelticCentral AmericanCentral American IndianCherokeeCheyenneChickasawChileanChineseChippewaChoctawColombianComancheCosta RicanCreekCroatianCubanCzechCzechoslovakianDanishDelawareDominicanDutchDutch West IndianEastern EuropeanEcuadorianEgyptianEnglishEstonianEthiopianEuropeanFilipinoFinnishFrenchFrench American IndianFrench CanadianGermanGerman RussianGhanaianGreekGuamanian / ChamorroGuatemalanGuyaneseHaitianHonduranHopiHungarianIcelanderIndian (Asian)IndonesianInupiatIranianIraqiIrishIroquoisIsraeliItalianJamaicanJapaneseJordanianKenyanKoreanLaotianLatvianLebaneseLiberianLithuanianLumbeeLuxembourgerMacedonianMalaysianMexicanMexican American IndianMongolianMoroccanNative HawaiianNavajoNew ZealanderNicaraguanNigerianNorthern EuropeanNorwegianOkinawanOsageOttawaPakistaniPalestinianPanamanianParaguayanPennsylvania GermanPeruvianPimaPolishPortuguesePotawatomiPuebloPuerto RicanRomanianRussianSalvadoranSamoanScandinavianScotch-IrishScottishSeminoleSerbianShoshoneSierra LeoneanSiouxSlavicSlovakSloveneSomaliSouth AfricanSouth AmericanSouth American IndianSoviet UnionSpaniardSpanishSpanish AmericanSpanish American IndianSri LankanSubsaharan AfricanSudaneseSwedishSwissSyrianThaiTrinidadian and TobagonianTurkishU.S. Virgin IslanderUgandanUkrainianUruguayanUteVenezuelanVietnameseWelshWest IndianYaquiYugoslavian
Immigrant Origin (Total)
AfghanistanAfricaArgentinaAsiaAustraliaAustriaBangladeshBarbadosBelizeBoliviaBrazilBulgariaBurma / MyanmarCambodiaCameroonCanadaCaribbeanCentral AmericaChileChinaColombiaCongoCosta RicaCubaCzechoslovakiaDenmarkDominican RepublicEastern AfricaEastern AsiaEastern EuropeEcuadorEgyptEl SalvadorEnglandEritreaEthiopiaEuropeFijiFranceGermanyGhanaGreeceGuatemalaGuyanaHaitiHondurasHong KongHungaryIndiaIndonesiaIranIraqIrelandIsraelItalyJamaicaJapanJordanKazakhstanKenyaKoreaKuwaitLaosLatin AmericaLatviaLebanonLiberiaLithuaniaMalaysiaMexicoMiddle AfricaMoldovaMoroccoNepalNetherlandsNicaraguaNigeriaNorthern AfricaNorthern EuropeNorwayOceaniaPakistanPanamaPeruPhilippinesPolandPortugalRomaniaRussiaSaudi ArabiaScotlandSerbiaSierra LeoneSingaporeSomaliaSouth AfricaSouth AmericaSouth Central AsiaSouth Eastern AsiaSouthern EuropeSpainSri LankaSudanSwedenSwitzerlandSyriaTaiwanThailandTrinidad and TobagoTurkeyUgandaUkraineUruguayUzbekistanVenezuelaVietnamWestern AfricaWestern AsiaWestern EuropeZaireZimbabwe
Immigrant Origin (Percentage)
AfghanistanAfricaArgentinaAsiaAustraliaAustriaBangladeshBarbadosBelizeBoliviaBrazilBulgariaBurma / MyanmarCambodiaCameroonCanadaCaribbeanCentral AmericaChileChinaColombiaCongoCosta RicaCubaCzechoslovakiaDenmarkDominican RepublicEastern AfricaEastern AsiaEastern EuropeEcuadorEgyptEl SalvadorEnglandEritreaEthiopiaEuropeFijiFranceGermanyGhanaGreeceGuatemalaGuyanaHaitiHondurasHong KongHungaryIndiaIndonesiaIranIraqIrelandIsraelItalyJamaicaJapanJordanKazakhstanKenyaKoreaKuwaitLaosLatin AmericaLatviaLebanonLiberiaLithuaniaMalaysiaMexicoMiddle AfricaMoldovaMoroccoNepalNetherlandsNicaraguaNigeriaNorthern AfricaNorthern EuropeNorwayOceaniaPakistanPanamaPeruPhilippinesPolandPortugalRomaniaRussiaSaudi ArabiaScotlandSerbiaSierra LeoneSingaporeSomaliaSouth AfricaSouth AmericaSouth Central AsiaSouth Eastern AsiaSouthern EuropeSpainSri LankaSudanSwedenSwitzerlandSyriaTaiwanThailandTrinidad and TobagoTurkeyUgandaUkraineUruguayUzbekistanVenezuelaVietnamWestern AfricaWestern AsiaWestern EuropeZaireZimbabwe
Income
Income (Families)
Income (Households)
Poverty
Poverty (Families)
Unemployment
Employment Occupations
Employment Industries
Employer Class
Commute Time
Commute Means
School Enrollment
Education by Degree Field
Occupancy
Finances
Physical Characteristics
San Antonio
Compare Zip Codes
Comparison Subject

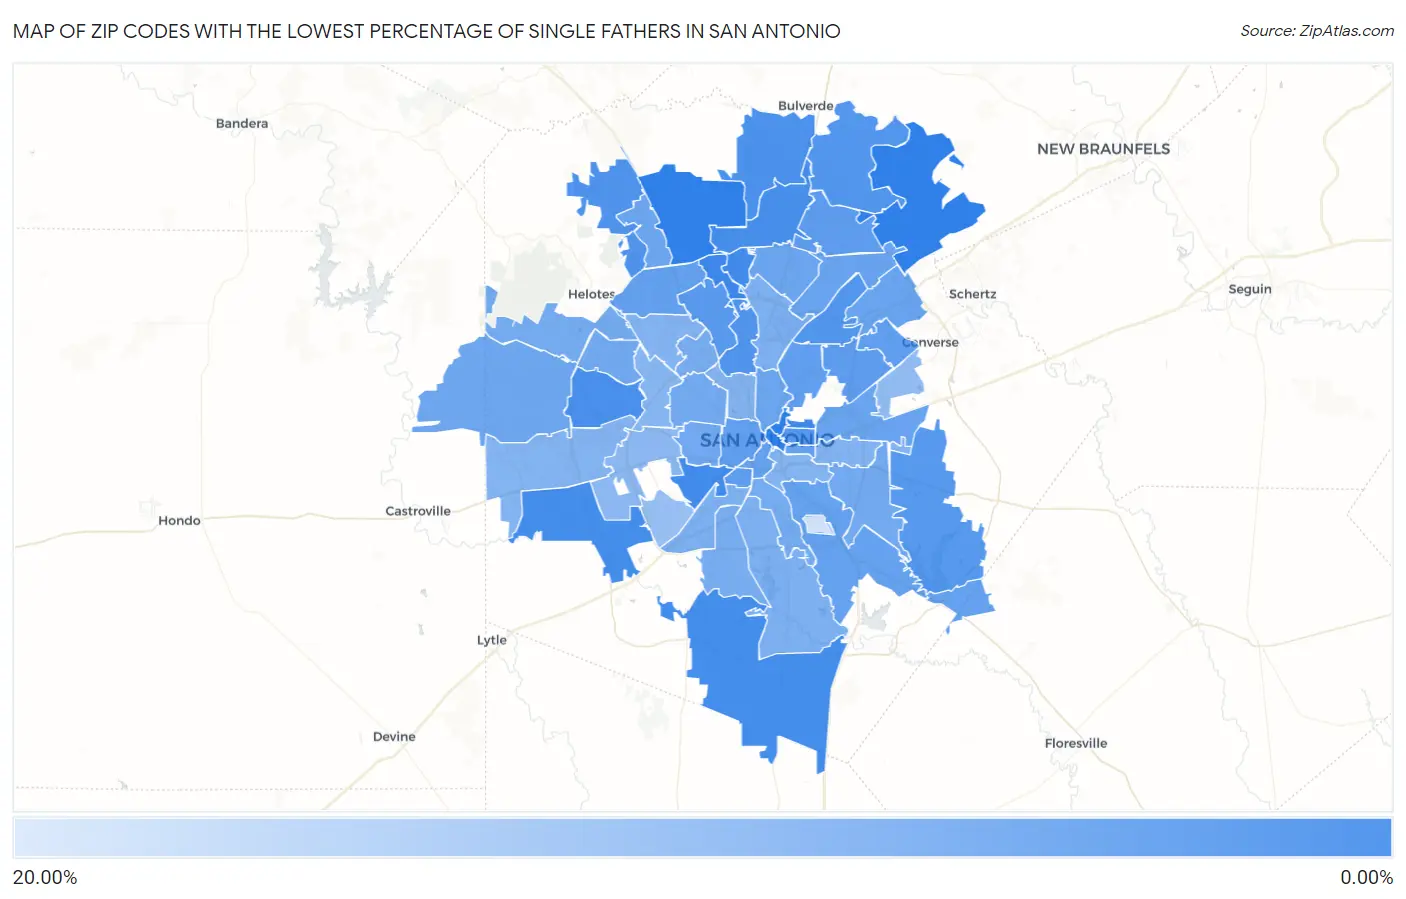
Map of Zip Codes with the Lowest Percentage of Single Fathers in San Antonio

20.00%
0.00%
Zip Codes with the Lowest Percentage of Single Fathers in San Antonio Map

Zip Codes with the Lowest Percentage of Single Fathers in San Antonio, TX

Zip Code % Single Fathers vs State vs National
1.782310.37%4.22%(-3.84)#134.16%(-3.79)#214
2.782080.88%4.22%(-3.34)#704.16%(-3.28)#1,236
3.782481.08%4.22%(-3.13)#1074.16%(-3.08)#1,771
4.782261.08%4.22%(-3.13)#1084.16%(-3.07)#1,772
5.782641.21%4.22%(-3.01)#1264.16%(-2.95)#2,138
6.782521.26%4.22%(-2.96)#1364.16%(-2.90)#2,308
7.782581.42%4.22%(-2.80)#1674.16%(-2.74)#2,796
8.782511.77%4.22%(-2.45)#2354.16%(-2.39)#3,932
9.782601.91%4.22%(-2.31)#2674.16%(-2.25)#4,407
10.782552.12%4.22%(-2.09)#3094.16%(-2.03)#5,237
11.782132.33%4.22%(-1.88)#3584.16%(-1.82)#6,015
12.782612.60%4.22%(-1.61)#4164.16%(-1.55)#7,078
13.782172.66%4.22%(-1.55)#4274.16%(-1.49)#7,318
14.782022.89%4.22%(-1.33)#4764.16%(-1.27)#8,243
15.782633.03%4.22%(-1.18)#5074.16%(-1.12)#8,854
16.782303.36%4.22%(-0.860)#5774.16%(-0.801)#10,159
17.782253.60%4.22%(-0.614)#6354.16%(-0.555)#11,127
18.782593.66%4.22%(-0.552)#6544.16%(-0.493)#11,360
19.782183.72%4.22%(-0.495)#6714.16%(-0.436)#11,575
20.782073.85%4.22%(-0.366)#7034.16%(-0.307)#12,018
21.782093.85%4.22%(-0.362)#7044.16%(-0.303)#12,033
22.782393.96%4.22%(-0.255)#7224.16%(-0.196)#12,435
23.782494.08%4.22%(-0.138)#7464.16%(-0.079)#12,865
24.782034.30%4.22%(+0.086)#7834.16%(+0.145)#13,648
25.782044.37%4.22%(+0.158)#7994.16%(+0.217)#13,865
26.782234.40%4.22%(+0.182)#8084.16%(+0.241)#13,957
27.782334.73%4.22%(+0.519)#8734.16%(+0.578)#15,055
28.782474.76%4.22%(+0.545)#8834.16%(+0.604)#15,130
29.782194.91%4.22%(+0.695)#9124.16%(+0.754)#15,566
30.782124.99%4.22%(+0.777)#9314.16%(+0.836)#15,813
31.782325.17%4.22%(+0.956)#9654.16%(+1.02)#16,320
32.782535.31%4.22%(+1.09)#9874.16%(+1.15)#16,659
33.782565.32%4.22%(+1.11)#9884.16%(+1.17)#16,697
34.782375.64%4.22%(+1.42)#1,0254.16%(+1.48)#17,493
35.782285.69%4.22%(+1.48)#1,0334.16%(+1.54)#17,622
36.782505.72%4.22%(+1.50)#1,0384.16%(+1.56)#17,686
37.782225.80%4.22%(+1.58)#1,0484.16%(+1.64)#17,865
38.782545.89%4.22%(+1.67)#1,0664.16%(+1.73)#18,105
39.782145.91%4.22%(+1.70)#1,0684.16%(+1.76)#18,158
40.782296.18%4.22%(+1.96)#1,1014.16%(+2.02)#18,736
41.782246.21%4.22%(+1.99)#1,1094.16%(+2.05)#18,807
42.782116.69%4.22%(+2.48)#1,1654.16%(+2.54)#19,703
43.782166.90%4.22%(+2.68)#1,1834.16%(+2.74)#20,019
44.782216.93%4.22%(+2.71)#1,1884.16%(+2.77)#20,066
45.782207.23%4.22%(+3.01)#1,2204.16%(+3.07)#20,520
46.782017.29%4.22%(+3.08)#1,2224.16%(+3.13)#20,616
47.782407.32%4.22%(+3.10)#1,2244.16%(+3.16)#20,647
48.782457.42%4.22%(+3.21)#1,2334.16%(+3.27)#20,781
49.782107.48%4.22%(+3.26)#1,2374.16%(+3.32)#20,854
50.782387.90%4.22%(+3.68)#1,2584.16%(+3.74)#21,345
51.782278.39%4.22%(+4.18)#1,2904.16%(+4.24)#21,861
52.782449.14%4.22%(+4.92)#1,3234.16%(+4.98)#22,456
53.782429.39%4.22%(+5.17)#1,3314.16%(+5.23)#22,619
54.7823515.62%4.22%(+11.4)#1,4184.16%(+11.5)#24,349

Common Questions

What are the Top 10 Zip Codes with the Lowest Percentage of Single Fathers in San Antonio, TX?
Top 10 Zip Codes with the Lowest Percentage of Single Fathers in San Antonio, TX are:
#1
0.00%
#2
0.00%
#3
0.00%
#4
0.00%
#5
0.37%
#6
0.88%
#7
1.08%
#8
1.08%
#9
1.21%
#10
1.26%
What zip code has the Lowest Percentage of Single Fathers in San Antonio, TX?
78231 has the Lowest Percentage of Single Fathers in San Antonio, TX with 0.37%.
What is the Percentage of Single Fathers in San Antonio, TX?
Percentage of Single Fathers in San Antonio is 4.97%.
What is the Percentage of Single Fathers in Texas?
Percentage of Single Fathers in Texas is 4.22%.
What is the Percentage of Single Fathers in the United States?
Percentage of Single Fathers in the United States is 4.16%.