Zip Codes with the Highest Percentage of Families with Income Above $100,000 in Iowa
RELATED REPORTS & OPTIONS
Family Income | $100k+
Iowa
Compare Zip Codes
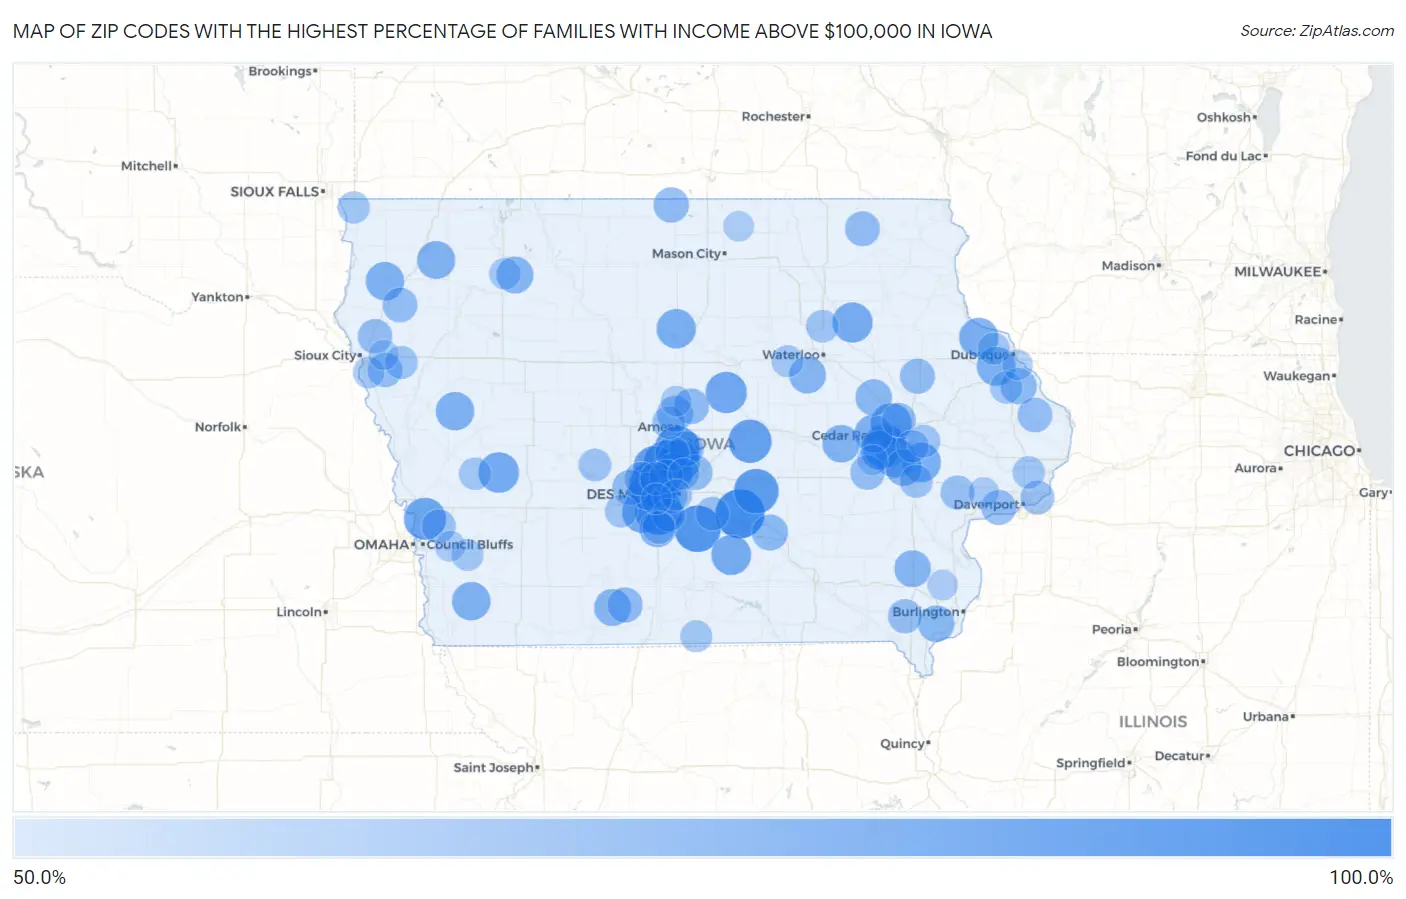
Map of Zip Codes with the Highest Percentage of Families with Income Above $100,000 in Iowa
0.0%
100.0%
Zip Codes with the Highest Percentage of Families with Income Above $100,000 in Iowa
| Zip Code | Families with Income > $100k | vs State | vs National | |
| 1. | 50323 | 84.0% | 44.3%(+39.7)#1 | 46.1%(+37.9)#668 |
| 2. | 50214 | 83.4% | 44.3%(+39.1)#2 | 46.1%(+37.3)#712 |
| 3. | 50061 | 80.6% | 44.3%(+36.3)#3 | 46.1%(+34.5)#969 |
| 4. | 50001 | 79.8% | 44.3%(+35.5)#4 | 46.1%(+33.7)#1,053 |
| 5. | 50124 | 78.0% | 44.3%(+33.7)#5 | 46.1%(+31.9)#1,260 |
| 6. | 50137 | 77.3% | 44.3%(+33.0)#6 | 46.1%(+31.2)#1,372 |
| 7. | 50226 | 76.9% | 44.3%(+32.6)#7 | 46.1%(+30.8)#1,415 |
| 8. | 52228 | 75.9% | 44.3%(+31.6)#8 | 46.1%(+29.8)#1,582 |
| 9. | 50109 | 75.5% | 44.3%(+31.2)#9 | 46.1%(+29.4)#1,631 |
| 10. | 50120 | 75.2% | 44.3%(+30.9)#10 | 46.1%(+29.1)#1,682 |
| 11. | 50007 | 74.6% | 44.3%(+30.3)#11 | 46.1%(+28.5)#1,771 |
| 12. | 51542 | 73.6% | 44.3%(+29.3)#12 | 46.1%(+27.5)#1,940 |
| 13. | 50206 | 72.7% | 44.3%(+28.4)#13 | 46.1%(+26.6)#2,109 |
| 14. | 52411 | 72.3% | 44.3%(+28.0)#14 | 46.1%(+26.2)#2,176 |
| 15. | 50261 | 71.7% | 44.3%(+27.4)#15 | 46.1%(+25.6)#2,286 |
| 16. | 51447 | 71.7% | 44.3%(+27.4)#16 | 46.1%(+25.6)#2,289 |
| 17. | 50664 | 71.1% | 44.3%(+26.8)#17 | 46.1%(+25.0)#2,397 |
| 18. | 52338 | 70.9% | 44.3%(+26.6)#18 | 46.1%(+24.8)#2,432 |
| 19. | 50057 | 70.7% | 44.3%(+26.4)#19 | 46.1%(+24.6)#2,474 |
| 20. | 50325 | 70.0% | 44.3%(+25.7)#20 | 46.1%(+23.9)#2,598 |
| 21. | 52333 | 70.0% | 44.3%(+25.7)#21 | 46.1%(+23.9)#2,602 |
| 22. | 50101 | 70.0% | 44.3%(+25.7)#22 | 46.1%(+23.9)#2,610 |
| 23. | 52053 | 69.9% | 44.3%(+25.6)#23 | 46.1%(+23.8)#2,630 |
| 24. | 52351 | 69.6% | 44.3%(+25.3)#24 | 46.1%(+23.5)#2,698 |
| 25. | 52068 | 69.4% | 44.3%(+25.1)#25 | 46.1%(+23.3)#2,743 |
| 26. | 50023 | 69.1% | 44.3%(+24.8)#26 | 46.1%(+23.0)#2,793 |
| 27. | 51645 | 68.9% | 44.3%(+24.6)#27 | 46.1%(+22.8)#2,850 |
| 28. | 51036 | 68.8% | 44.3%(+24.5)#28 | 46.1%(+22.7)#2,872 |
| 29. | 51460 | 68.8% | 44.3%(+24.5)#29 | 46.1%(+22.7)#2,876 |
| 30. | 52206 | 68.7% | 44.3%(+24.4)#30 | 46.1%(+22.6)#2,886 |
| 31. | 51231 | 68.1% | 44.3%(+23.8)#31 | 46.1%(+22.0)#3,004 |
| 32. | 50263 | 67.7% | 44.3%(+23.4)#32 | 46.1%(+21.6)#3,092 |
| 33. | 52257 | 67.6% | 44.3%(+23.3)#33 | 46.1%(+21.5)#3,131 |
| 34. | 50643 | 66.7% | 44.3%(+22.4)#34 | 46.1%(+20.6)#3,308 |
| 35. | 50863 | 66.7% | 44.3%(+22.4)#35 | 46.1%(+20.6)#3,317 |
| 36. | 52652 | 66.7% | 44.3%(+22.4)#36 | 46.1%(+20.6)#3,326 |
| 37. | 52317 | 66.6% | 44.3%(+22.3)#37 | 46.1%(+20.5)#3,343 |
| 38. | 51341 | 66.6% | 44.3%(+22.3)#38 | 46.1%(+20.5)#3,354 |
| 39. | 50033 | 66.6% | 44.3%(+22.3)#39 | 46.1%(+20.5)#3,355 |
| 40. | 52624 | 66.2% | 44.3%(+21.9)#40 | 46.1%(+20.1)#3,460 |
| 41. | 52345 | 66.1% | 44.3%(+21.8)#41 | 46.1%(+20.0)#3,478 |
| 42. | 52054 | 65.6% | 44.3%(+21.3)#42 | 46.1%(+19.5)#3,596 |
| 43. | 50143 | 65.5% | 44.3%(+21.2)#43 | 46.1%(+19.4)#3,619 |
| 44. | 50105 | 65.3% | 44.3%(+21.0)#44 | 46.1%(+19.2)#3,680 |
| 45. | 50236 | 64.9% | 44.3%(+20.6)#45 | 46.1%(+18.8)#3,780 |
| 46. | 50003 | 64.6% | 44.3%(+20.3)#46 | 46.1%(+18.5)#3,855 |
| 47. | 50473 | 64.6% | 44.3%(+20.3)#47 | 46.1%(+18.5)#3,862 |
| 48. | 50074 | 64.5% | 44.3%(+20.2)#48 | 46.1%(+18.4)#3,891 |
| 49. | 52330 | 64.3% | 44.3%(+20.0)#49 | 46.1%(+18.2)#3,934 |
| 50. | 50035 | 64.2% | 44.3%(+19.9)#50 | 46.1%(+18.1)#3,954 |
| 51. | 50046 | 64.2% | 44.3%(+19.9)#51 | 46.1%(+18.1)#3,961 |
| 52. | 50312 | 64.0% | 44.3%(+19.7)#52 | 46.1%(+17.9)#4,006 |
| 53. | 52726 | 64.0% | 44.3%(+19.7)#53 | 46.1%(+17.9)#4,008 |
| 54. | 52165 | 64.0% | 44.3%(+19.7)#54 | 46.1%(+17.9)#4,015 |
| 55. | 51045 | 63.9% | 44.3%(+19.6)#55 | 46.1%(+17.8)#4,055 |
| 56. | 52074 | 63.6% | 44.3%(+19.3)#56 | 46.1%(+17.5)#4,132 |
| 57. | 52334 | 63.5% | 44.3%(+19.2)#57 | 46.1%(+17.4)#4,154 |
| 58. | 51024 | 63.4% | 44.3%(+19.1)#58 | 46.1%(+17.3)#4,176 |
| 59. | 51007 | 63.4% | 44.3%(+19.1)#59 | 46.1%(+17.3)#4,181 |
| 60. | 50244 | 63.3% | 44.3%(+19.0)#60 | 46.1%(+17.2)#4,206 |
| 61. | 52328 | 63.1% | 44.3%(+18.8)#61 | 46.1%(+17.0)#4,264 |
| 62. | 52631 | 63.1% | 44.3%(+18.8)#62 | 46.1%(+17.0)#4,271 |
| 63. | 52720 | 62.8% | 44.3%(+18.5)#63 | 46.1%(+16.7)#4,342 |
| 64. | 51576 | 62.6% | 44.3%(+18.3)#64 | 46.1%(+16.5)#4,396 |
| 65. | 52722 | 62.5% | 44.3%(+18.2)#65 | 46.1%(+16.4)#4,408 |
| 66. | 50063 | 62.5% | 44.3%(+18.2)#66 | 46.1%(+16.4)#4,426 |
| 67. | 50252 | 62.4% | 44.3%(+18.1)#67 | 46.1%(+16.3)#4,458 |
| 68. | 50131 | 62.0% | 44.3%(+17.7)#68 | 46.1%(+15.9)#4,549 |
| 69. | 50111 | 61.8% | 44.3%(+17.5)#69 | 46.1%(+15.7)#4,606 |
| 70. | 50014 | 61.6% | 44.3%(+17.3)#70 | 46.1%(+15.5)#4,663 |
| 71. | 50211 | 61.6% | 44.3%(+17.3)#71 | 46.1%(+15.5)#4,673 |
| 72. | 51039 | 61.5% | 44.3%(+17.2)#72 | 46.1%(+15.4)#4,703 |
| 73. | 52245 | 61.4% | 44.3%(+17.1)#73 | 46.1%(+15.3)#4,719 |
| 74. | 52314 | 61.4% | 44.3%(+17.1)#74 | 46.1%(+15.3)#4,726 |
| 75. | 50229 | 61.1% | 44.3%(+16.8)#75 | 46.1%(+15.0)#4,836 |
| 76. | 50277 | 61.1% | 44.3%(+16.8)#76 | 46.1%(+15.0)#4,839 |
| 77. | 50622 | 61.0% | 44.3%(+16.7)#77 | 46.1%(+14.9)#4,864 |
| 78. | 50072 | 60.8% | 44.3%(+16.5)#78 | 46.1%(+14.7)#4,919 |
| 79. | 52227 | 60.8% | 44.3%(+16.5)#79 | 46.1%(+14.7)#4,920 |
| 80. | 52756 | 60.7% | 44.3%(+16.4)#80 | 46.1%(+14.6)#4,953 |
| 81. | 52079 | 60.5% | 44.3%(+16.2)#81 | 46.1%(+14.4)#5,012 |
| 82. | 51578 | 60.5% | 44.3%(+16.2)#82 | 46.1%(+14.4)#5,016 |
| 83. | 51241 | 60.3% | 44.3%(+16.0)#83 | 46.1%(+14.2)#5,056 |
| 84. | 52039 | 60.3% | 44.3%(+16.0)#84 | 46.1%(+14.2)#5,061 |
| 85. | 50624 | 60.0% | 44.3%(+15.7)#85 | 46.1%(+13.9)#5,131 |
| 86. | 50052 | 60.0% | 44.3%(+15.7)#86 | 46.1%(+13.9)#5,146 |
| 87. | 51549 | 59.9% | 44.3%(+15.6)#87 | 46.1%(+13.8)#5,181 |
| 88. | 51054 | 59.6% | 44.3%(+15.3)#88 | 46.1%(+13.5)#5,266 |
| 89. | 51343 | 59.6% | 44.3%(+15.3)#89 | 46.1%(+13.5)#5,281 |
| 90. | 50021 | 59.3% | 44.3%(+15.0)#90 | 46.1%(+13.2)#5,350 |
| 91. | 50309 | 59.1% | 44.3%(+14.8)#91 | 46.1%(+13.0)#5,420 |
| 92. | 50266 | 58.9% | 44.3%(+14.6)#92 | 46.1%(+12.8)#5,477 |
| 93. | 52003 | 58.4% | 44.3%(+14.1)#93 | 46.1%(+12.3)#5,648 |
| 94. | 51575 | 58.4% | 44.3%(+14.1)#94 | 46.1%(+12.3)#5,659 |
| 95. | 50248 | 58.3% | 44.3%(+14.0)#95 | 46.1%(+12.2)#5,676 |
| 96. | 52203 | 58.3% | 44.3%(+14.0)#96 | 46.1%(+12.2)#5,678 |
| 97. | 52747 | 58.3% | 44.3%(+14.0)#97 | 46.1%(+12.2)#5,679 |
| 98. | 50440 | 58.1% | 44.3%(+13.8)#98 | 46.1%(+12.0)#5,754 |
| 99. | 52660 | 58.0% | 44.3%(+13.7)#99 | 46.1%(+11.9)#5,786 |
| 100. | 51030 | 57.9% | 44.3%(+13.6)#100 | 46.1%(+11.8)#5,818 |
Common Questions
What are the Top 10 Zip Codes with the Highest Percentage of Families with Income Above $100,000 in Iowa?
Top 10 Zip Codes with the Highest Percentage of Families with Income Above $100,000 in Iowa are:
What zip code has the Highest Percentage of Families with Income Above $100,000 in Iowa?
50323 has the Highest Percentage of Families with Income Above $100,000 in Iowa with 84.0%.
What is the Percentage of Families with Income Above $100,000 in the State of Iowa?
Percentage of Families with Income Above $100,000 in Iowa is 44.3%.
What is the Percentage of Families with Income Above $100,000 in the United States?
Percentage of Families with Income Above $100,000 in the United States is 46.1%.