Zip Codes with the Highest Percentage of Families with Income Above $100,000 in Michigan
RELATED REPORTS & OPTIONS
Family Income | $100k+
Michigan
Compare Zip Codes
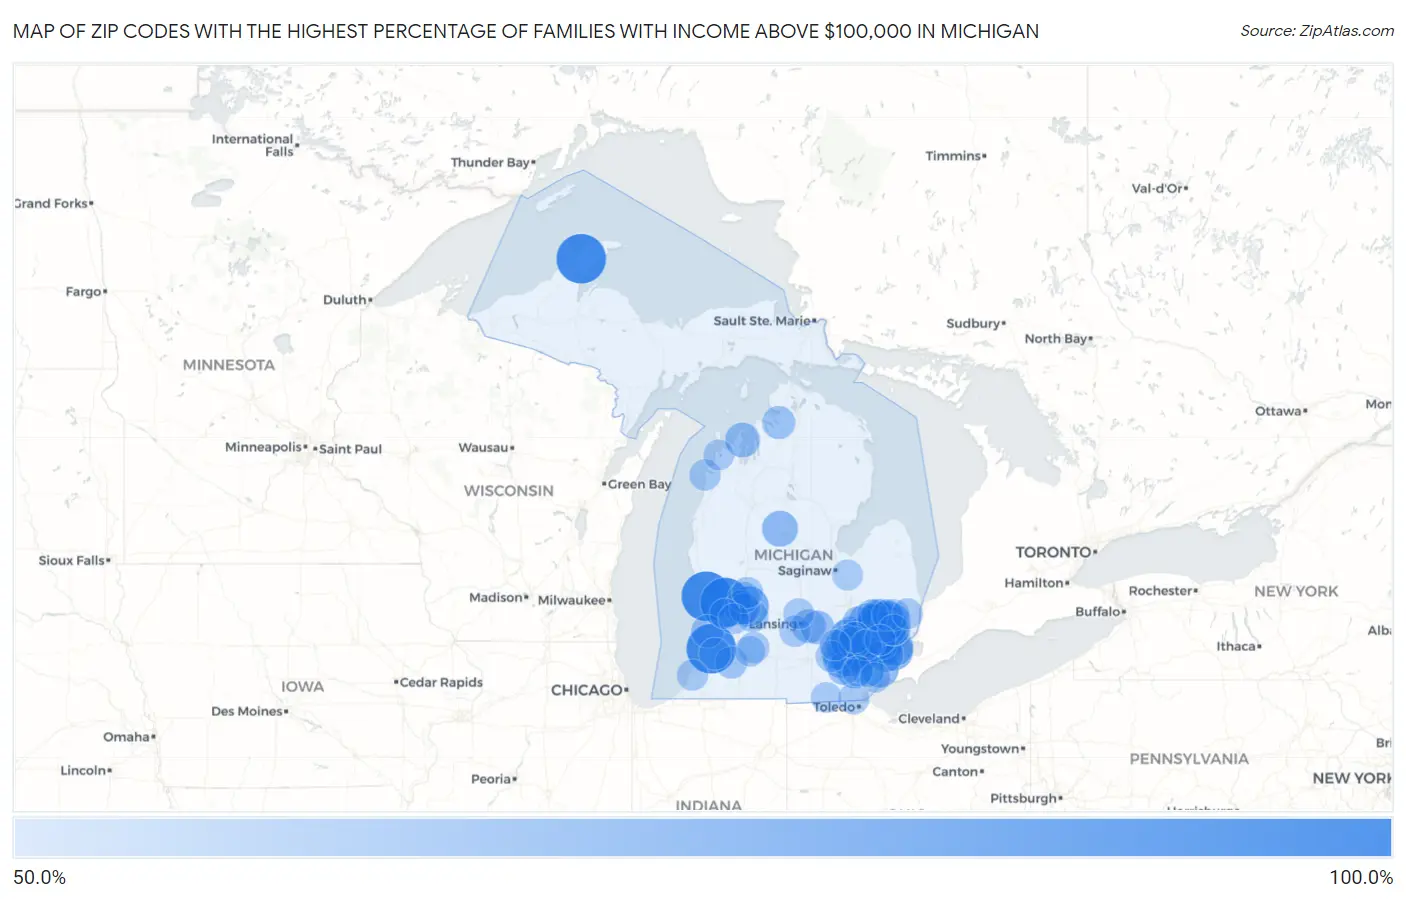
Map of Zip Codes with the Highest Percentage of Families with Income Above $100,000 in Michigan
0.0%
100.0%
Zip Codes with the Highest Percentage of Families with Income Above $100,000 in Michigan
| Zip Code | Families with Income > $100k | vs State | vs National | |
| 1. | 49063 | 100.0% | 42.6%(+57.4)#1 | 46.1%(+53.9)#115 |
| 2. | 49409 | 100.0% | 42.6%(+57.4)#2 | 46.1%(+53.9)#136 |
| 3. | 49942 | 100.0% | 42.6%(+57.4)#3 | 46.1%(+53.9)#166 |
| 4. | 49430 | 100.0% | 42.6%(+57.4)#4 | 46.1%(+53.9)#195 |
| 5. | 48070 | 84.8% | 42.6%(+42.2)#5 | 46.1%(+38.7)#605 |
| 6. | 48306 | 84.4% | 42.6%(+41.8)#6 | 46.1%(+38.3)#634 |
| 7. | 48069 | 84.0% | 42.6%(+41.4)#7 | 46.1%(+37.9)#671 |
| 8. | 48374 | 82.4% | 42.6%(+39.8)#8 | 46.1%(+36.3)#779 |
| 9. | 48025 | 81.3% | 42.6%(+38.7)#9 | 46.1%(+35.2)#882 |
| 10. | 48009 | 80.8% | 42.6%(+38.2)#10 | 46.1%(+34.7)#935 |
| 11. | 48168 | 79.8% | 42.6%(+37.2)#11 | 46.1%(+33.7)#1,047 |
| 12. | 48302 | 79.7% | 42.6%(+37.1)#12 | 46.1%(+33.6)#1,056 |
| 13. | 49301 | 79.5% | 42.6%(+36.9)#13 | 46.1%(+33.4)#1,078 |
| 14. | 48301 | 78.5% | 42.6%(+35.9)#14 | 46.1%(+32.4)#1,206 |
| 15. | 48304 | 78.1% | 42.6%(+35.5)#15 | 46.1%(+32.0)#1,246 |
| 16. | 48098 | 77.4% | 42.6%(+34.8)#16 | 46.1%(+31.3)#1,353 |
| 17. | 48363 | 77.2% | 42.6%(+34.6)#17 | 46.1%(+31.1)#1,381 |
| 18. | 48230 | 76.2% | 42.6%(+33.6)#18 | 46.1%(+30.1)#1,529 |
| 19. | 48323 | 74.4% | 42.6%(+31.8)#19 | 46.1%(+28.3)#1,799 |
| 20. | 48138 | 74.3% | 42.6%(+31.7)#20 | 46.1%(+28.2)#1,822 |
| 21. | 48309 | 73.9% | 42.6%(+31.3)#21 | 46.1%(+27.8)#1,892 |
| 22. | 48095 | 73.8% | 42.6%(+31.2)#22 | 46.1%(+27.7)#1,913 |
| 23. | 48360 | 73.5% | 42.6%(+30.9)#23 | 46.1%(+27.4)#1,950 |
| 24. | 48085 | 73.1% | 42.6%(+30.5)#24 | 46.1%(+27.0)#2,021 |
| 25. | 48324 | 73.0% | 42.6%(+30.4)#25 | 46.1%(+26.9)#2,039 |
| 26. | 48236 | 72.7% | 42.6%(+30.1)#26 | 46.1%(+26.6)#2,089 |
| 27. | 48380 | 72.7% | 42.6%(+30.1)#27 | 46.1%(+26.6)#2,098 |
| 28. | 48072 | 72.6% | 42.6%(+30.0)#28 | 46.1%(+26.5)#2,122 |
| 29. | 48190 | 72.5% | 42.6%(+29.9)#29 | 46.1%(+26.4)#2,145 |
| 30. | 48105 | 72.3% | 42.6%(+29.7)#30 | 46.1%(+26.2)#2,168 |
| 31. | 48178 | 71.5% | 42.6%(+28.9)#31 | 46.1%(+25.4)#2,304 |
| 32. | 48633 | 71.0% | 42.6%(+28.4)#32 | 46.1%(+24.9)#2,421 |
| 33. | 48103 | 70.9% | 42.6%(+28.3)#33 | 46.1%(+24.8)#2,422 |
| 34. | 48331 | 70.9% | 42.6%(+28.3)#34 | 46.1%(+24.8)#2,427 |
| 35. | 48084 | 70.6% | 42.6%(+28.0)#35 | 46.1%(+24.5)#2,482 |
| 36. | 48348 | 69.9% | 42.6%(+27.3)#36 | 46.1%(+23.8)#2,623 |
| 37. | 48130 | 69.6% | 42.6%(+27.0)#37 | 46.1%(+23.5)#2,692 |
| 38. | 48104 | 69.5% | 42.6%(+26.9)#38 | 46.1%(+23.4)#2,709 |
| 39. | 49674 | 68.5% | 42.6%(+25.9)#39 | 46.1%(+22.4)#2,932 |
| 40. | 48382 | 68.4% | 42.6%(+25.8)#40 | 46.1%(+22.3)#2,939 |
| 41. | 48167 | 68.4% | 42.6%(+25.8)#41 | 46.1%(+22.3)#2,940 |
| 42. | 48375 | 68.3% | 42.6%(+25.7)#42 | 46.1%(+22.2)#2,953 |
| 43. | 48067 | 68.2% | 42.6%(+25.6)#43 | 46.1%(+22.1)#2,967 |
| 44. | 48170 | 67.7% | 42.6%(+25.1)#44 | 46.1%(+21.6)#3,086 |
| 45. | 49506 | 67.6% | 42.6%(+25.0)#45 | 46.1%(+21.5)#3,112 |
| 46. | 48226 | 67.4% | 42.6%(+24.8)#46 | 46.1%(+21.3)#3,171 |
| 47. | 48187 | 67.1% | 42.6%(+24.5)#47 | 46.1%(+21.0)#3,215 |
| 48. | 48307 | 67.1% | 42.6%(+24.5)#48 | 46.1%(+21.0)#3,217 |
| 49. | 48096 | 67.1% | 42.6%(+24.5)#49 | 46.1%(+21.0)#3,231 |
| 50. | 48188 | 67.0% | 42.6%(+24.4)#50 | 46.1%(+20.9)#3,241 |
| 51. | 48042 | 66.9% | 42.6%(+24.3)#51 | 46.1%(+20.8)#3,263 |
| 52. | 48864 | 66.6% | 42.6%(+24.0)#52 | 46.1%(+20.5)#3,339 |
| 53. | 48895 | 66.4% | 42.6%(+23.8)#53 | 46.1%(+20.3)#3,388 |
| 54. | 48322 | 65.7% | 42.6%(+23.1)#54 | 46.1%(+19.6)#3,552 |
| 55. | 48164 | 65.6% | 42.6%(+23.0)#55 | 46.1%(+19.5)#3,585 |
| 56. | 48114 | 65.3% | 42.6%(+22.7)#56 | 46.1%(+19.2)#3,669 |
| 57. | 48359 | 65.0% | 42.6%(+22.4)#57 | 46.1%(+18.9)#3,746 |
| 58. | 49796 | 65.0% | 42.6%(+22.4)#58 | 46.1%(+18.9)#3,753 |
| 59. | 49406 | 64.7% | 42.6%(+22.1)#59 | 46.1%(+18.6)#3,836 |
| 60. | 48143 | 64.6% | 42.6%(+22.0)#60 | 46.1%(+18.5)#3,861 |
| 61. | 48315 | 64.4% | 42.6%(+21.8)#61 | 46.1%(+18.3)#3,899 |
| 62. | 48334 | 64.1% | 42.6%(+21.5)#62 | 46.1%(+18.0)#3,980 |
| 63. | 48176 | 63.8% | 42.6%(+21.2)#63 | 46.1%(+17.7)#4,066 |
| 64. | 48350 | 63.6% | 42.6%(+21.0)#64 | 46.1%(+17.5)#4,119 |
| 65. | 49071 | 63.2% | 42.6%(+20.6)#65 | 46.1%(+17.1)#4,227 |
| 66. | 48367 | 63.2% | 42.6%(+20.6)#66 | 46.1%(+17.1)#4,234 |
| 67. | 48116 | 63.1% | 42.6%(+20.5)#67 | 46.1%(+17.0)#4,253 |
| 68. | 48362 | 63.1% | 42.6%(+20.5)#68 | 46.1%(+17.0)#4,259 |
| 69. | 48316 | 62.8% | 42.6%(+20.2)#69 | 46.1%(+16.7)#4,328 |
| 70. | 49027 | 62.7% | 42.6%(+20.1)#70 | 46.1%(+16.6)#4,372 |
| 71. | 48165 | 62.6% | 42.6%(+20.0)#71 | 46.1%(+16.5)#4,389 |
| 72. | 48370 | 62.5% | 42.6%(+19.9)#72 | 46.1%(+16.4)#4,428 |
| 73. | 49302 | 62.2% | 42.6%(+19.6)#73 | 46.1%(+16.1)#4,498 |
| 74. | 48005 | 61.7% | 42.6%(+19.1)#74 | 46.1%(+15.6)#4,646 |
| 75. | 49628 | 61.6% | 42.6%(+19.0)#75 | 46.1%(+15.5)#4,690 |
| 76. | 48371 | 61.5% | 42.6%(+18.9)#76 | 46.1%(+15.4)#4,694 |
| 77. | 49085 | 61.3% | 42.6%(+18.7)#77 | 46.1%(+15.2)#4,747 |
| 78. | 48118 | 61.3% | 42.6%(+18.7)#78 | 46.1%(+15.2)#4,757 |
| 79. | 49060 | 61.3% | 42.6%(+18.7)#79 | 46.1%(+15.2)#4,768 |
| 80. | 49546 | 61.2% | 42.6%(+18.6)#80 | 46.1%(+15.1)#4,777 |
| 81. | 48381 | 61.2% | 42.6%(+18.6)#81 | 46.1%(+15.1)#4,790 |
| 82. | 48821 | 61.1% | 42.6%(+18.5)#82 | 46.1%(+15.0)#4,829 |
| 83. | 48065 | 61.0% | 42.6%(+18.4)#83 | 46.1%(+14.9)#4,858 |
| 84. | 49306 | 61.0% | 42.6%(+18.4)#84 | 46.1%(+14.9)#4,859 |
| 85. | 49341 | 60.9% | 42.6%(+18.3)#85 | 46.1%(+14.8)#4,874 |
| 86. | 48335 | 60.9% | 42.6%(+18.3)#86 | 46.1%(+14.8)#4,878 |
| 87. | 48044 | 60.8% | 42.6%(+18.2)#87 | 46.1%(+14.7)#4,903 |
| 88. | 48144 | 60.7% | 42.6%(+18.1)#88 | 46.1%(+14.6)#4,942 |
| 89. | 48169 | 60.5% | 42.6%(+17.9)#89 | 46.1%(+14.4)#5,000 |
| 90. | 48073 | 60.4% | 42.6%(+17.8)#90 | 46.1%(+14.3)#5,021 |
| 91. | 48734 | 60.4% | 42.6%(+17.8)#91 | 46.1%(+14.3)#5,032 |
| 92. | 48820 | 60.2% | 42.6%(+17.6)#92 | 46.1%(+14.1)#5,072 |
| 93. | 48063 | 60.2% | 42.6%(+17.6)#93 | 46.1%(+14.1)#5,079 |
| 94. | 49636 | 60.0% | 42.6%(+17.4)#94 | 46.1%(+13.9)#5,135 |
| 95. | 49289 | 60.0% | 42.6%(+17.4)#95 | 46.1%(+13.9)#5,147 |
| 96. | 49426 | 59.9% | 42.6%(+17.3)#96 | 46.1%(+13.8)#5,158 |
| 97. | 49315 | 59.9% | 42.6%(+17.3)#97 | 46.1%(+13.8)#5,161 |
| 98. | 49083 | 59.9% | 42.6%(+17.3)#98 | 46.1%(+13.8)#5,170 |
| 99. | 48191 | 59.5% | 42.6%(+16.9)#99 | 46.1%(+13.4)#5,305 |
| 100. | 48179 | 59.3% | 42.6%(+16.7)#100 | 46.1%(+13.2)#5,359 |
Common Questions
What are the Top 10 Zip Codes with the Highest Percentage of Families with Income Above $100,000 in Michigan?
Top 10 Zip Codes with the Highest Percentage of Families with Income Above $100,000 in Michigan are:
What zip code has the Highest Percentage of Families with Income Above $100,000 in Michigan?
49063 has the Highest Percentage of Families with Income Above $100,000 in Michigan with 100.0%.
What is the Percentage of Families with Income Above $100,000 in the State of Michigan?
Percentage of Families with Income Above $100,000 in Michigan is 42.6%.
What is the Percentage of Families with Income Above $100,000 in the United States?
Percentage of Families with Income Above $100,000 in the United States is 46.1%.