Zip Codes with the Highest Percentage of Families with Income Above $100,000 in Ohio
RELATED REPORTS & OPTIONS
Family Income | $100k+
Ohio
Compare Zip Codes
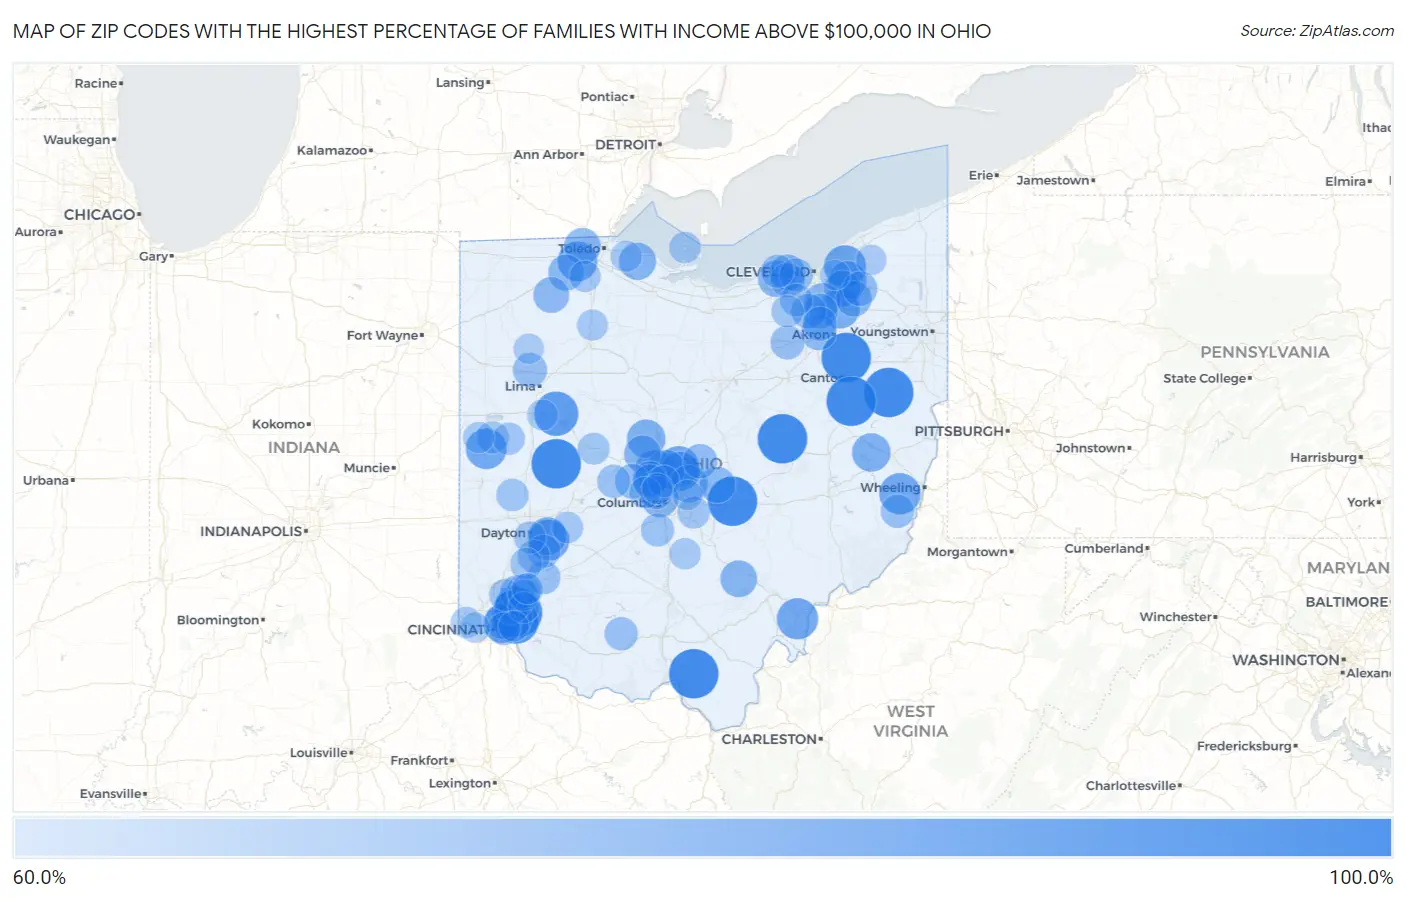
Map of Zip Codes with the Highest Percentage of Families with Income Above $100,000 in Ohio
0.0%
100.0%
Zip Codes with the Highest Percentage of Families with Income Above $100,000 in Ohio
| Zip Code | Families with Income > $100k | vs State | vs National | |
| 1. | 43030 | 100.0% | 42.3%(+57.7)#1 | 46.1%(+53.9)#61 |
| 2. | 44630 | 100.0% | 42.3%(+57.7)#2 | 46.1%(+53.9)#62 |
| 3. | 43805 | 100.0% | 42.3%(+57.7)#3 | 46.1%(+53.9)#75 |
| 4. | 44607 | 100.0% | 42.3%(+57.7)#4 | 46.1%(+53.9)#141 |
| 5. | 45147 | 100.0% | 42.3%(+57.7)#5 | 46.1%(+53.9)#161 |
| 6. | 43070 | 100.0% | 42.3%(+57.7)#6 | 46.1%(+53.9)#190 |
| 7. | 45677 | 100.0% | 42.3%(+57.7)#7 | 46.1%(+53.9)#192 |
| 8. | 44671 | 100.0% | 42.3%(+57.7)#8 | 46.1%(+53.9)#209 |
| 9. | 45174 | 90.8% | 42.3%(+48.5)#9 | 46.1%(+44.7)#347 |
| 10. | 45870 | 89.3% | 42.3%(+47.0)#10 | 46.1%(+43.2)#385 |
| 11. | 44040 | 84.8% | 42.3%(+42.5)#11 | 46.1%(+38.7)#607 |
| 12. | 45783 | 83.3% | 42.3%(+41.0)#12 | 46.1%(+37.2)#720 |
| 13. | 43967 | 83.3% | 42.3%(+41.0)#13 | 46.1%(+37.2)#721 |
| 14. | 45301 | 83.1% | 42.3%(+40.8)#14 | 46.1%(+37.0)#735 |
| 15. | 45350 | 82.3% | 42.3%(+40.0)#15 | 46.1%(+36.2)#794 |
| 16. | 43021 | 81.7% | 42.3%(+39.4)#16 | 46.1%(+35.6)#840 |
| 17. | 45243 | 81.1% | 42.3%(+38.8)#17 | 46.1%(+35.0)#906 |
| 18. | 43065 | 80.9% | 42.3%(+38.6)#18 | 46.1%(+34.8)#919 |
| 19. | 43542 | 80.2% | 42.3%(+37.9)#19 | 46.1%(+34.1)#1,010 |
| 20. | 44236 | 79.5% | 42.3%(+37.2)#20 | 46.1%(+33.4)#1,077 |
| 21. | 43082 | 79.4% | 42.3%(+37.1)#21 | 46.1%(+33.3)#1,088 |
| 22. | 45208 | 77.9% | 42.3%(+35.6)#22 | 46.1%(+31.8)#1,270 |
| 23. | 44693 | 77.8% | 42.3%(+35.5)#23 | 46.1%(+31.7)#1,297 |
| 24. | 43066 | 77.6% | 42.3%(+35.3)#24 | 46.1%(+31.5)#1,329 |
| 25. | 44022 | 76.7% | 42.3%(+34.4)#25 | 46.1%(+30.6)#1,454 |
| 26. | 45434 | 76.7% | 42.3%(+34.4)#26 | 46.1%(+30.6)#1,456 |
| 27. | 43035 | 76.4% | 42.3%(+34.1)#27 | 46.1%(+30.3)#1,486 |
| 28. | 43054 | 76.2% | 42.3%(+33.9)#28 | 46.1%(+30.1)#1,522 |
| 29. | 43432 | 75.2% | 42.3%(+32.9)#29 | 46.1%(+29.1)#1,681 |
| 30. | 43212 | 74.9% | 42.3%(+32.6)#30 | 46.1%(+28.8)#1,723 |
| 31. | 43061 | 74.4% | 42.3%(+32.1)#31 | 46.1%(+28.3)#1,807 |
| 32. | 43158 | 74.3% | 42.3%(+32.0)#32 | 46.1%(+28.2)#1,834 |
| 33. | 44011 | 74.1% | 42.3%(+31.8)#33 | 46.1%(+28.0)#1,857 |
| 34. | 44139 | 73.7% | 42.3%(+31.4)#34 | 46.1%(+27.6)#1,921 |
| 35. | 43617 | 73.7% | 42.3%(+31.4)#35 | 46.1%(+27.6)#1,925 |
| 36. | 44141 | 73.5% | 42.3%(+31.2)#36 | 46.1%(+27.4)#1,949 |
| 37. | 44140 | 73.0% | 42.3%(+30.7)#37 | 46.1%(+26.9)#2,041 |
| 38. | 43023 | 73.0% | 42.3%(+30.7)#38 | 46.1%(+26.9)#2,042 |
| 39. | 45249 | 72.9% | 42.3%(+30.6)#39 | 46.1%(+26.8)#2,058 |
| 40. | 43547 | 72.8% | 42.3%(+30.5)#40 | 46.1%(+26.7)#2,082 |
| 41. | 43523 | 72.4% | 42.3%(+30.1)#41 | 46.1%(+26.3)#2,166 |
| 42. | 44202 | 72.2% | 42.3%(+29.9)#42 | 46.1%(+26.1)#2,185 |
| 43. | 44321 | 71.7% | 42.3%(+29.4)#43 | 46.1%(+25.6)#2,278 |
| 44. | 45209 | 71.5% | 42.3%(+29.2)#44 | 46.1%(+25.4)#2,313 |
| 45. | 44286 | 71.1% | 42.3%(+28.8)#45 | 46.1%(+25.0)#2,387 |
| 46. | 44233 | 70.6% | 42.3%(+28.3)#46 | 46.1%(+24.5)#2,485 |
| 47. | 43017 | 70.5% | 42.3%(+28.2)#47 | 46.1%(+24.4)#2,501 |
| 48. | 43064 | 70.5% | 42.3%(+28.2)#48 | 46.1%(+24.4)#2,509 |
| 49. | 45040 | 70.2% | 42.3%(+27.9)#49 | 46.1%(+24.1)#2,555 |
| 50. | 44023 | 70.1% | 42.3%(+27.8)#50 | 46.1%(+24.0)#2,578 |
| 51. | 43013 | 69.8% | 42.3%(+27.5)#51 | 46.1%(+23.7)#2,656 |
| 52. | 44145 | 69.7% | 42.3%(+27.4)#52 | 46.1%(+23.6)#2,667 |
| 53. | 44333 | 69.2% | 42.3%(+26.9)#53 | 46.1%(+23.1)#2,775 |
| 54. | 45809 | 69.2% | 42.3%(+26.9)#54 | 46.1%(+23.1)#2,789 |
| 55. | 45034 | 68.9% | 42.3%(+26.6)#55 | 46.1%(+22.8)#2,848 |
| 56. | 45242 | 68.8% | 42.3%(+26.5)#56 | 46.1%(+22.7)#2,855 |
| 57. | 44251 | 68.8% | 42.3%(+26.5)#57 | 46.1%(+22.7)#2,869 |
| 58. | 43016 | 68.6% | 42.3%(+26.3)#58 | 46.1%(+22.5)#2,891 |
| 59. | 45054 | 67.8% | 42.3%(+25.5)#59 | 46.1%(+21.7)#3,075 |
| 60. | 43902 | 67.7% | 42.3%(+25.4)#60 | 46.1%(+21.6)#3,107 |
| 61. | 44116 | 67.6% | 42.3%(+25.3)#61 | 46.1%(+21.5)#3,118 |
| 62. | 45172 | 67.6% | 42.3%(+25.3)#62 | 46.1%(+21.5)#3,130 |
| 63. | 43221 | 67.5% | 42.3%(+25.2)#63 | 46.1%(+21.4)#3,135 |
| 64. | 45305 | 67.2% | 42.3%(+24.9)#64 | 46.1%(+21.1)#3,204 |
| 65. | 43116 | 67.1% | 42.3%(+24.8)#65 | 46.1%(+21.0)#3,232 |
| 66. | 43029 | 67.1% | 42.3%(+24.8)#66 | 46.1%(+21.0)#3,235 |
| 67. | 44012 | 67.0% | 42.3%(+24.7)#67 | 46.1%(+20.9)#3,243 |
| 68. | 45226 | 66.1% | 42.3%(+23.8)#68 | 46.1%(+20.0)#3,476 |
| 69. | 45458 | 66.0% | 42.3%(+23.7)#69 | 46.1%(+19.9)#3,493 |
| 70. | 44149 | 66.0% | 42.3%(+23.7)#70 | 46.1%(+19.9)#3,495 |
| 71. | 45339 | 65.6% | 42.3%(+23.3)#71 | 46.1%(+19.5)#3,595 |
| 72. | 45860 | 65.5% | 42.3%(+23.2)#72 | 46.1%(+19.4)#3,615 |
| 73. | 45865 | 65.4% | 42.3%(+23.1)#73 | 46.1%(+19.3)#3,640 |
| 74. | 43147 | 65.2% | 42.3%(+22.9)#74 | 46.1%(+19.1)#3,688 |
| 75. | 44280 | 65.2% | 42.3%(+22.9)#75 | 46.1%(+19.1)#3,703 |
| 76. | 45409 | 65.1% | 42.3%(+22.8)#76 | 46.1%(+19.0)#3,723 |
| 77. | 45066 | 65.0% | 42.3%(+22.7)#77 | 46.1%(+18.9)#3,743 |
| 78. | 43360 | 64.5% | 42.3%(+22.2)#78 | 46.1%(+18.4)#3,887 |
| 79. | 45069 | 64.4% | 42.3%(+22.1)#79 | 46.1%(+18.3)#3,895 |
| 80. | 43085 | 64.2% | 42.3%(+21.9)#80 | 46.1%(+18.1)#3,942 |
| 81. | 43026 | 64.0% | 42.3%(+21.7)#81 | 46.1%(+17.9)#3,995 |
| 82. | 43456 | 64.0% | 42.3%(+21.7)#82 | 46.1%(+17.9)#4,018 |
| 83. | 45039 | 63.9% | 42.3%(+21.6)#83 | 46.1%(+17.8)#4,028 |
| 84. | 45387 | 63.6% | 42.3%(+21.3)#84 | 46.1%(+17.5)#4,122 |
| 85. | 43525 | 63.6% | 42.3%(+21.3)#85 | 46.1%(+17.5)#4,128 |
| 86. | 45883 | 63.4% | 42.3%(+21.1)#86 | 46.1%(+17.3)#4,174 |
| 87. | 43154 | 63.3% | 42.3%(+21.0)#87 | 46.1%(+17.2)#4,203 |
| 88. | 45052 | 63.2% | 42.3%(+20.9)#88 | 46.1%(+17.1)#4,235 |
| 89. | 45140 | 63.0% | 42.3%(+20.7)#89 | 46.1%(+16.9)#4,272 |
| 90. | 45065 | 63.0% | 42.3%(+20.7)#90 | 46.1%(+16.9)#4,283 |
| 91. | 43468 | 63.0% | 42.3%(+20.7)#91 | 46.1%(+16.9)#4,290 |
| 92. | 45889 | 62.8% | 42.3%(+20.5)#92 | 46.1%(+16.7)#4,340 |
| 93. | 43220 | 62.6% | 42.3%(+20.3)#93 | 46.1%(+16.5)#4,379 |
| 94. | 45884 | 62.5% | 42.3%(+20.2)#94 | 46.1%(+16.4)#4,434 |
| 95. | 45244 | 61.9% | 42.3%(+19.6)#95 | 46.1%(+15.8)#4,575 |
| 96. | 44024 | 61.8% | 42.3%(+19.5)#96 | 46.1%(+15.7)#4,601 |
| 97. | 45233 | 61.7% | 42.3%(+19.4)#97 | 46.1%(+15.6)#4,637 |
| 98. | 45853 | 61.7% | 42.3%(+19.4)#98 | 46.1%(+15.6)#4,649 |
| 99. | 44122 | 61.6% | 42.3%(+19.3)#99 | 46.1%(+15.5)#4,661 |
| 100. | 43004 | 61.6% | 42.3%(+19.3)#100 | 46.1%(+15.5)#4,664 |
Common Questions
What are the Top 10 Zip Codes with the Highest Percentage of Families with Income Above $100,000 in Ohio?
Top 10 Zip Codes with the Highest Percentage of Families with Income Above $100,000 in Ohio are:
What zip code has the Highest Percentage of Families with Income Above $100,000 in Ohio?
43030 has the Highest Percentage of Families with Income Above $100,000 in Ohio with 100.0%.
What is the Percentage of Families with Income Above $100,000 in the State of Ohio?
Percentage of Families with Income Above $100,000 in Ohio is 42.3%.
What is the Percentage of Families with Income Above $100,000 in the United States?
Percentage of Families with Income Above $100,000 in the United States is 46.1%.