Long Hollow, SD
Long Hollow Map
Long Hollow Overview
364
TOTAL POPULATION
64
MALE POPULATION
300
FEMALE POPULATION
21.33
MALES / 100 FEMALES
468.75
FEMALES / 100 MALES
7.2
MEDIAN AGE
4.2
AVG FAMILY SIZE
3.7
AVG HOUSEHOLD SIZE
$5,196
PER CAPITA INCOME
$8,169
AVG FAMILY INCOME
$8,721
AVG HOUSEHOLD INCOME
$22,670
FAMILY INCOME DEFICIT
0.61
INEQUALITY / GINI INDEX
93
LABOR FORCE [ PEOPLE ]
66.0%
PERCENT IN LABOR FORCE
9.7%
UNEMPLOYMENT RATE
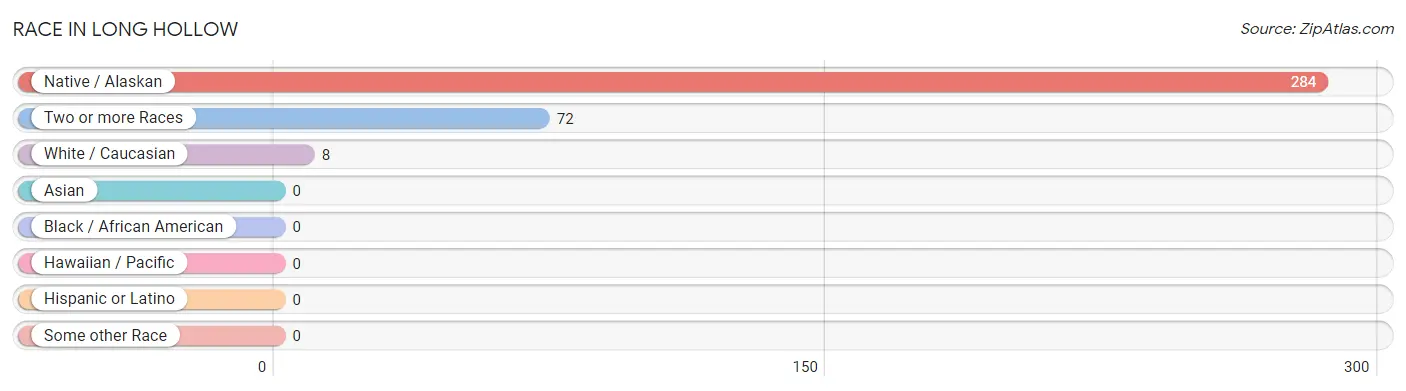
Race in Long Hollow
The most populous races in Long Hollow are Native / Alaskan (284 | 78.0%), Two or more Races (72 | 19.8%), and White / Caucasian (8 | 2.2%).
| Race | # Population | % Population |
| Asian | 0 | 0.0% |
| Black / African American | 0 | 0.0% |
| Hawaiian / Pacific | 0 | 0.0% |
| Hispanic or Latino | 0 | 0.0% |
| Native / Alaskan | 284 | 78.0% |
| White / Caucasian | 8 | 2.2% |
| Two or more Races | 72 | 19.8% |
| Some other Race | 0 | 0.0% |
| Total | 364 | 100.0% |
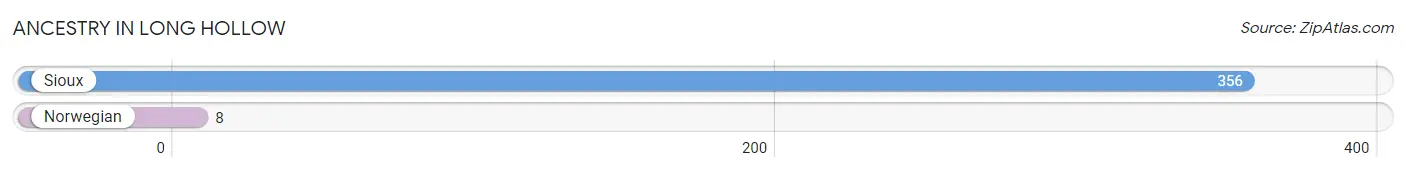
Ancestry in Long Hollow
The most populous ancestries reported in Long Hollow are Sioux (356 | 97.8%), and Norwegian (8 | 2.2%), together accounting for 100.0% of all Long Hollow residents.
| Ancestry | # Population | % Population |
| Norwegian | 8 | 2.2% |
| Sioux | 356 | 97.8% | View All 2 Rows |
Immigrants in Long Hollow

| Immigration Origin | # Population | % Population | View All 0 Rows |
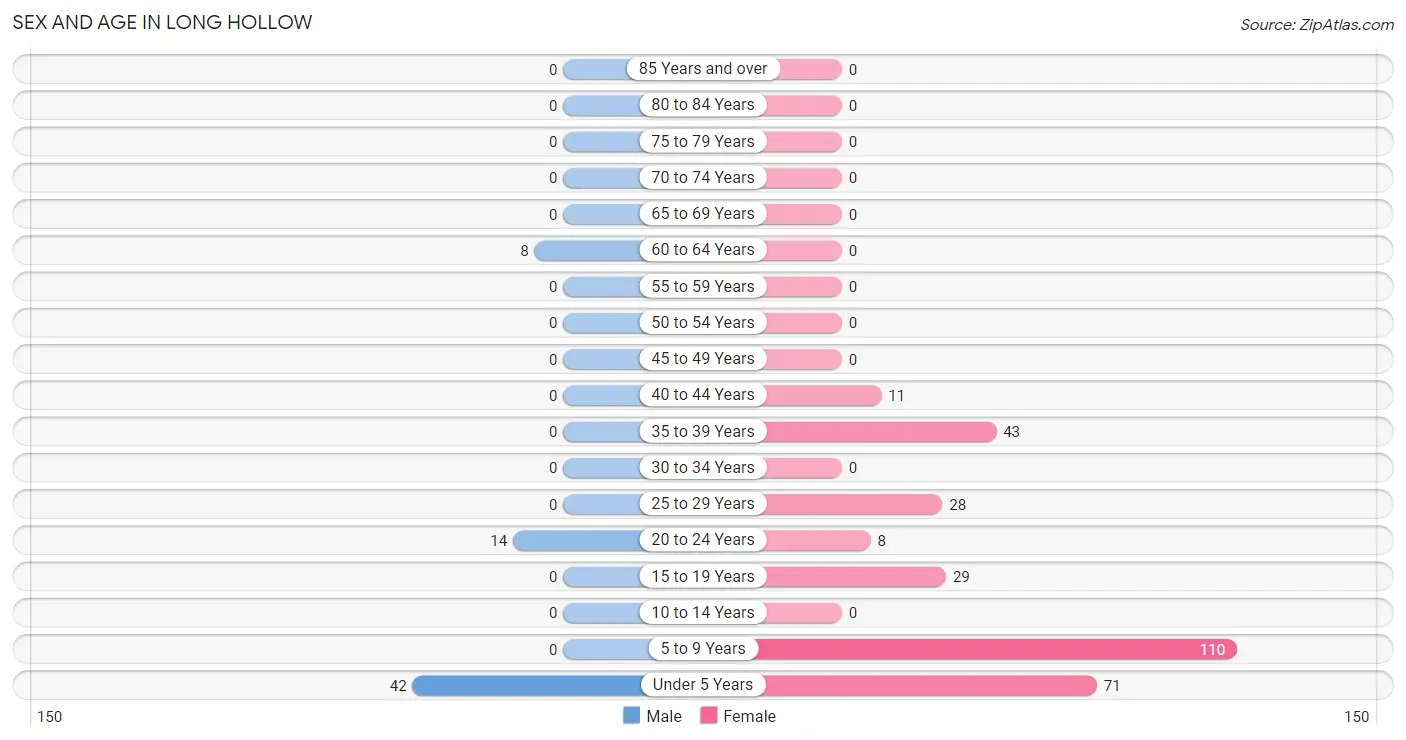
Sex and Age in Long Hollow
Sex and Age in Long Hollow
The most populous age groups in Long Hollow are Under 5 Years (42 | 65.6%) for men and 5 to 9 Years (110 | 36.7%) for women.
| Age Bracket | Male | Female |
| Under 5 Years | 42 (65.6%) | 71 (23.7%) |
| 5 to 9 Years | 0 (0.0%) | 110 (36.7%) |
| 10 to 14 Years | 0 (0.0%) | 0 (0.0%) |
| 15 to 19 Years | 0 (0.0%) | 29 (9.7%) |
| 20 to 24 Years | 14 (21.9%) | 8 (2.7%) |
| 25 to 29 Years | 0 (0.0%) | 28 (9.3%) |
| 30 to 34 Years | 0 (0.0%) | 0 (0.0%) |
| 35 to 39 Years | 0 (0.0%) | 43 (14.3%) |
| 40 to 44 Years | 0 (0.0%) | 11 (3.7%) |
| 45 to 49 Years | 0 (0.0%) | 0 (0.0%) |
| 50 to 54 Years | 0 (0.0%) | 0 (0.0%) |
| 55 to 59 Years | 0 (0.0%) | 0 (0.0%) |
| 60 to 64 Years | 8 (12.5%) | 0 (0.0%) |
| 65 to 69 Years | 0 (0.0%) | 0 (0.0%) |
| 70 to 74 Years | 0 (0.0%) | 0 (0.0%) |
| 75 to 79 Years | 0 (0.0%) | 0 (0.0%) |
| 80 to 84 Years | 0 (0.0%) | 0 (0.0%) |
| 85 Years and over | 0 (0.0%) | 0 (0.0%) |
| Total | 64 (100.0%) | 300 (100.0%) |
Families and Households in Long Hollow
Median Family Size in Long Hollow
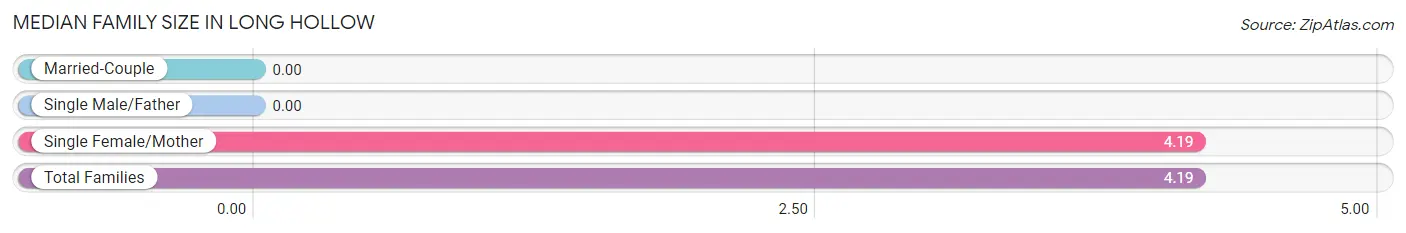
| Family Type | # Families | Family Size |
| Married-Couple | 0 (0.0%) | - |
| Single Male/Father | 0 (0.0%) | - |
| Single Female/Mother | 79 (100.0%) | 4.19 |
| Total Families | 79 (100.0%) | 4.19 |
Median Household Size in Long Hollow
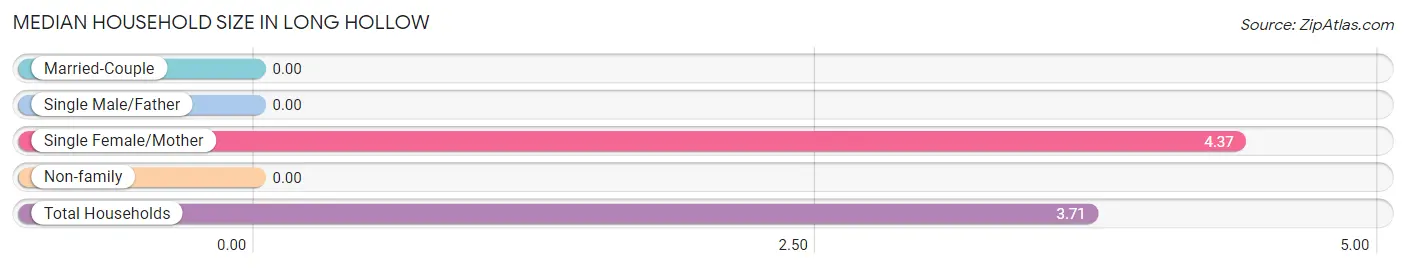
| Household Type | # Households | Household Size |
| Married-Couple | 0 (0.0%) | - |
| Single Male/Father | 0 (0.0%) | - |
| Single Female/Mother | 79 (80.6%) | 4.37 |
| Non-family | 19 (19.4%) | - |
| Total Households | 98 (100.0%) | 3.71 |
Household Size by Marriage Status in Long Hollow
Out of a total of 98 households in Long Hollow, 79 (80.6%) are family households, while 19 (19.4%) are nonfamily households. The most numerous type of family households are 5-person households, comprising 51, and the most common type of nonfamily households are 1-person households, comprising 19.
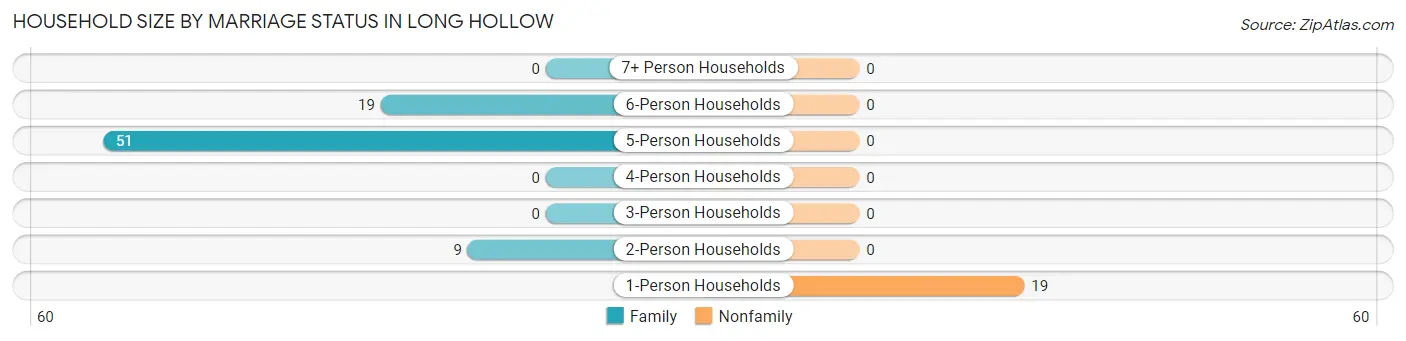
| Household Size | Family Households | Nonfamily Households |
| 1-Person Households | - | 19 (19.4%) |
| 2-Person Households | 9 (9.2%) | 0 (0.0%) |
| 3-Person Households | 0 (0.0%) | 0 (0.0%) |
| 4-Person Households | 0 (0.0%) | 0 (0.0%) |
| 5-Person Households | 51 (52.0%) | 0 (0.0%) |
| 6-Person Households | 19 (19.4%) | 0 (0.0%) |
| 7+ Person Households | 0 (0.0%) | 0 (0.0%) |
| Total | 79 (80.6%) | 19 (19.4%) |
Female Fertility in Long Hollow
Fertility by Age in Long Hollow
Average fertility rate in Long Hollow is 160.0 births per 1,000 women. Women in the age bracket of 20 to 34 years have the highest fertility rate with 528.0 births per 1,000 women. Women in the age bracket of 20 to 34 years acount for 100.0% of all women with births.
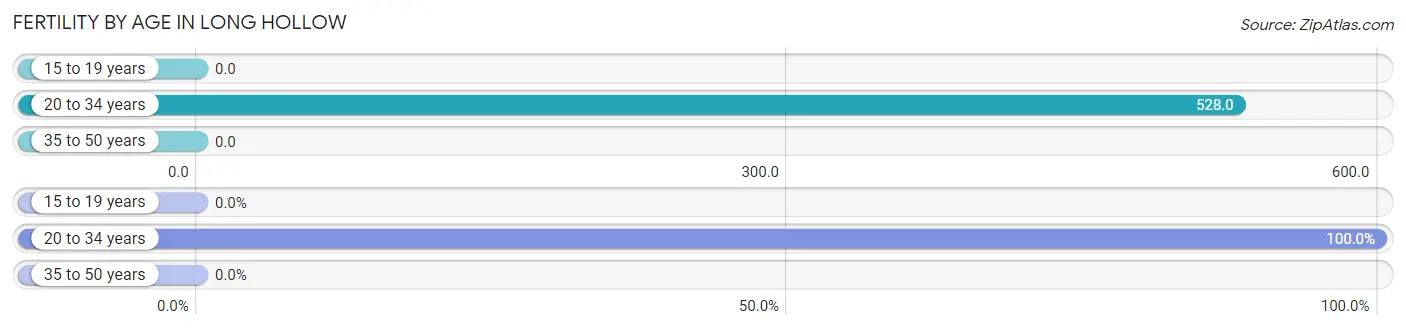
| Age Bracket | Women with Births | Births / 1,000 Women |
| 15 to 19 years | 0 (0.0%) | 0.0 |
| 20 to 34 years | 19 (100.0%) | 528.0 |
| 35 to 50 years | 0 (0.0%) | 0.0 |
| Total | 19 (100.0%) | 160.0 |
Fertility by Age by Marriage Status in Long Hollow
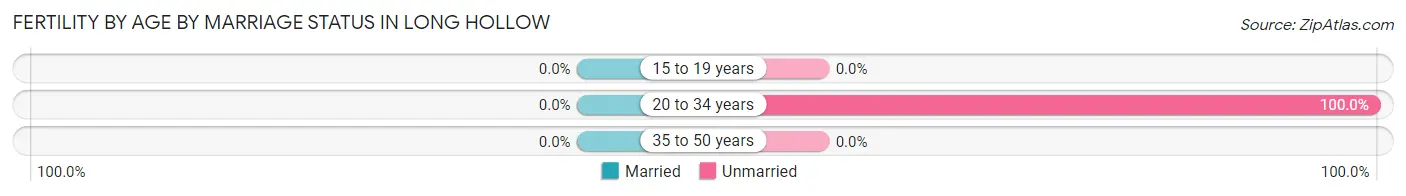
| Age Bracket | Married | Unmarried |
| 15 to 19 years | 0 (0.0%) | 0 (0.0%) |
| 20 to 34 years | 0 (0.0%) | 19 (100.0%) |
| 35 to 50 years | 0 (0.0%) | 0 (0.0%) |
| Total | 0 (0.0%) | 19 (100.0%) |
Fertility by Education in Long Hollow
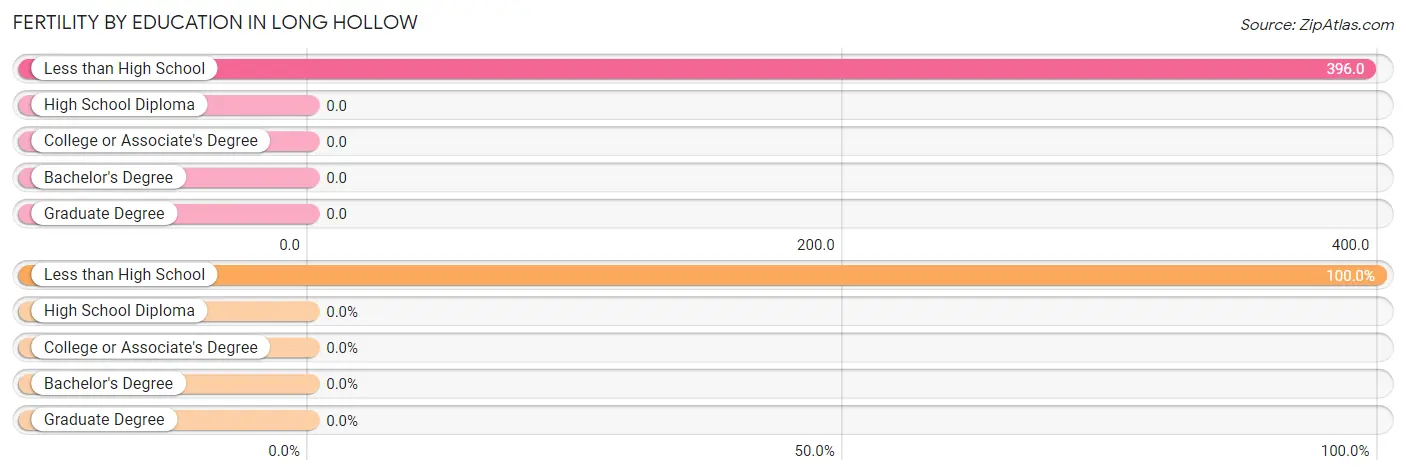
| Educational Attainment | Women with Births | Births / 1,000 Women |
| Less than High School | 19 (100.0%) | 396.0 |
| High School Diploma | 0 (0.0%) | 0.0 |
| College or Associate's Degree | 0 (0.0%) | 0.0 |
| Bachelor's Degree | 0 (0.0%) | 0.0 |
| Graduate Degree | 0 (0.0%) | 0.0 |
| Total | 19 (100.0%) | 160.0 |
Fertility by Education by Marriage Status in Long Hollow
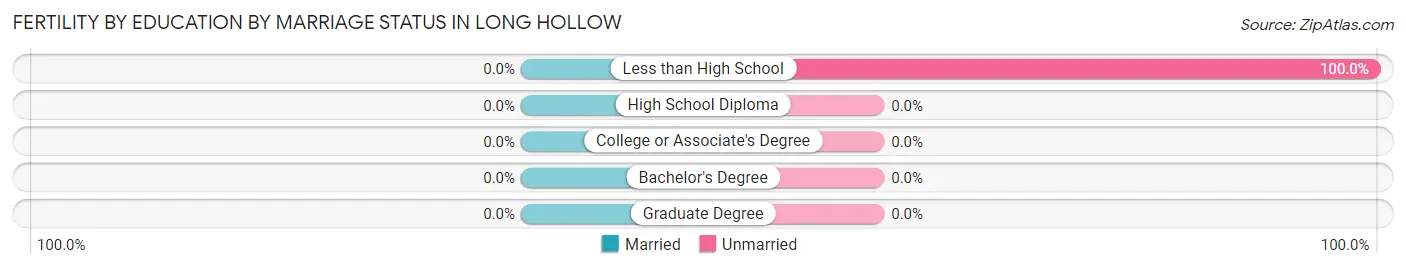
| Educational Attainment | Married | Unmarried |
| Less than High School | 0 (0.0%) | 19 (100.0%) |
| High School Diploma | 0 (0.0%) | 0 (0.0%) |
| College or Associate's Degree | 0 (0.0%) | 0 (0.0%) |
| Bachelor's Degree | 0 (0.0%) | 0 (0.0%) |
| Graduate Degree | 0 (0.0%) | 0 (0.0%) |
| Total | 0 (0.0%) | 19 (100.0%) |
Income in Long Hollow
Income Overview in Long Hollow
Per Capita Income in Long Hollow is $5,196, while median incomes of families and households are $8,169 and $8,721 respectively.
| Characteristic | Number | Measure |
| Per Capita Income | 364 | $5,196 |
| Median Family Income | 79 | $8,169 |
| Mean Family Income | 79 | $7,172 |
| Median Household Income | 98 | $8,721 |
| Mean Household Income | 98 | $17,999 |
| Income Deficit | 79 | $22,670 |
| Wage / Income Gap (%) | 364 | 0.00% |
| Wage / Income Gap ($) | 364 | 100.00¢ per $1 |
| Gini / Inequality Index | 364 | 0.61 |
Earnings by Sex in Long Hollow
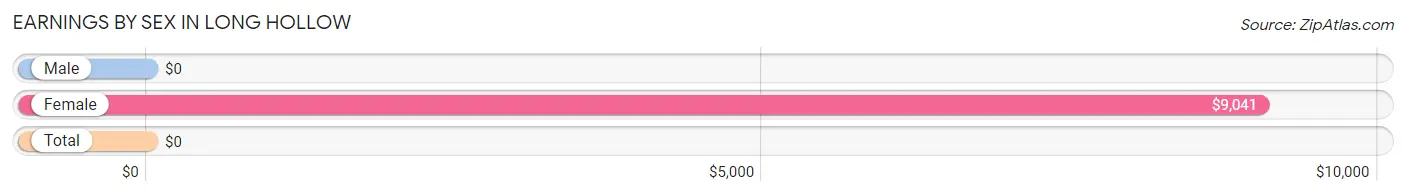
| Sex | Number | Average Earnings |
| Male | 22 (23.7%) | $0 |
| Female | 71 (76.3%) | $9,041 |
| Total | 93 (100.0%) | $0 |
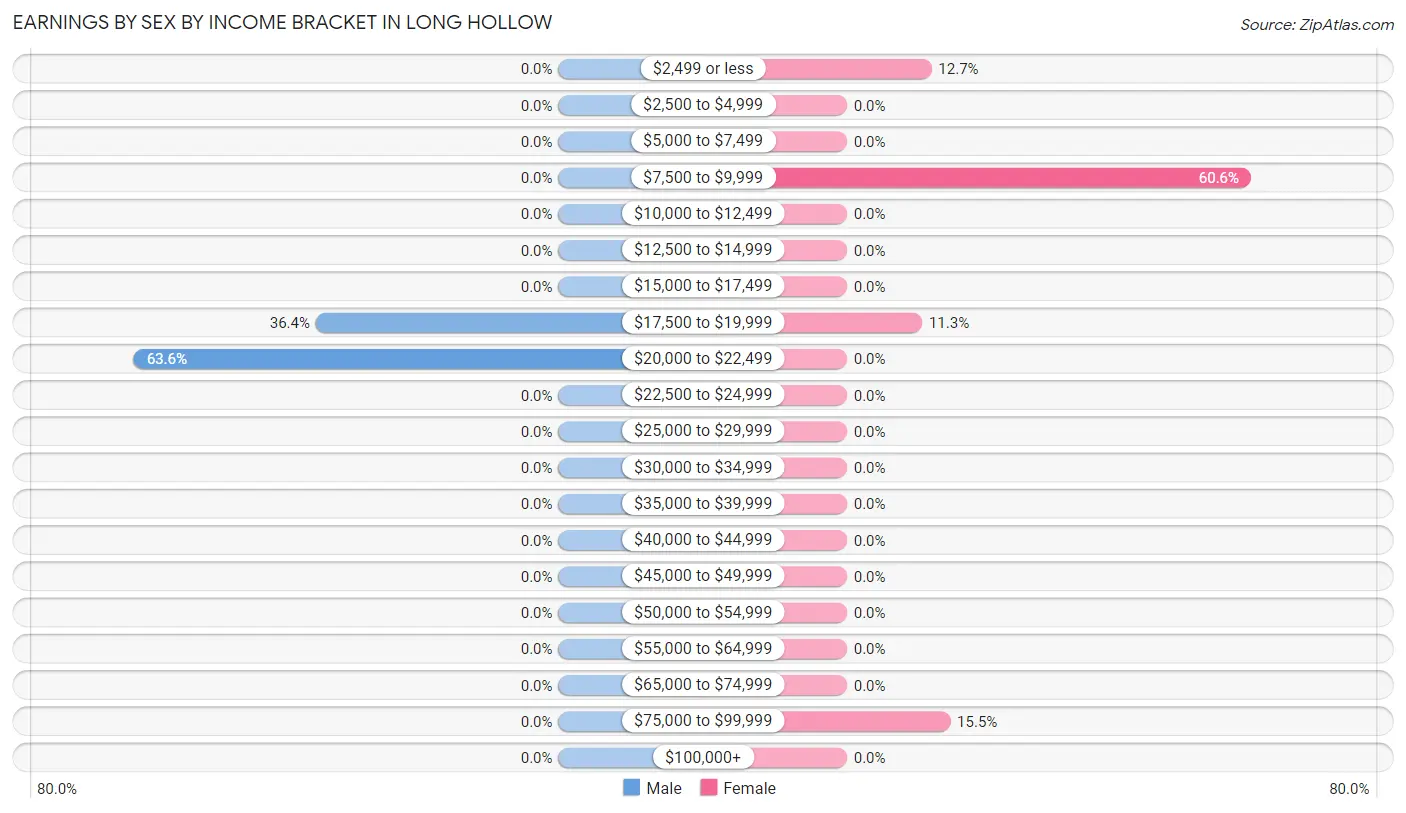
Earnings by Sex by Income Bracket in Long Hollow
The most common earnings brackets in Long Hollow are $20,000 to $22,499 for men (14 | 63.6%) and $7,500 to $9,999 for women (43 | 60.6%).
| Income | Male | Female |
| $2,499 or less | 0 (0.0%) | 9 (12.7%) |
| $2,500 to $4,999 | 0 (0.0%) | 0 (0.0%) |
| $5,000 to $7,499 | 0 (0.0%) | 0 (0.0%) |
| $7,500 to $9,999 | 0 (0.0%) | 43 (60.6%) |
| $10,000 to $12,499 | 0 (0.0%) | 0 (0.0%) |
| $12,500 to $14,999 | 0 (0.0%) | 0 (0.0%) |
| $15,000 to $17,499 | 0 (0.0%) | 0 (0.0%) |
| $17,500 to $19,999 | 8 (36.4%) | 8 (11.3%) |
| $20,000 to $22,499 | 14 (63.6%) | 0 (0.0%) |
| $22,500 to $24,999 | 0 (0.0%) | 0 (0.0%) |
| $25,000 to $29,999 | 0 (0.0%) | 0 (0.0%) |
| $30,000 to $34,999 | 0 (0.0%) | 0 (0.0%) |
| $35,000 to $39,999 | 0 (0.0%) | 0 (0.0%) |
| $40,000 to $44,999 | 0 (0.0%) | 0 (0.0%) |
| $45,000 to $49,999 | 0 (0.0%) | 0 (0.0%) |
| $50,000 to $54,999 | 0 (0.0%) | 0 (0.0%) |
| $55,000 to $64,999 | 0 (0.0%) | 0 (0.0%) |
| $65,000 to $74,999 | 0 (0.0%) | 0 (0.0%) |
| $75,000 to $99,999 | 0 (0.0%) | 11 (15.5%) |
| $100,000+ | 0 (0.0%) | 0 (0.0%) |
| Total | 22 (100.0%) | 71 (100.0%) |
Earnings by Sex by Educational Attainment in Long Hollow
| Educational Attainment | Male Income | Female Income |
| Less than High School | - | - |
| High School Diploma | - | - |
| College or Associate's Degree | - | - |
| Bachelor's Degree | - | - |
| Graduate Degree | - | - |
| Total | - | - |
Family Income in Long Hollow
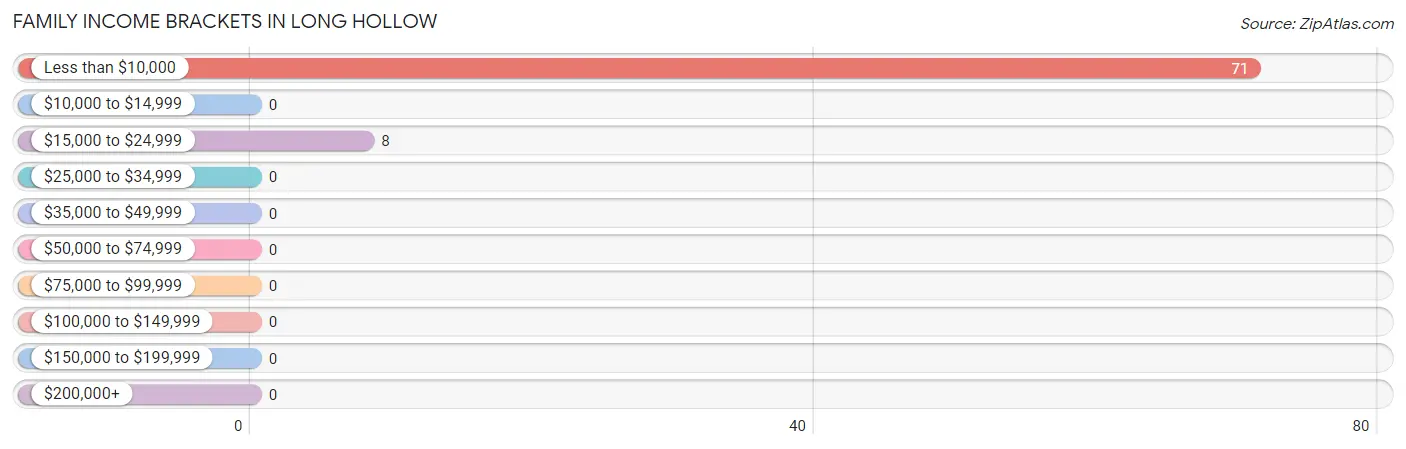
Family Income Brackets in Long Hollow
According to the Long Hollow family income data, there are 71 families falling into the less than $10,000 income range, which is the most common income bracket and makes up 89.9% of all families.
| Income Bracket | # Families | % Families |
| Less than $10,000 | 71 | 89.9% |
| $10,000 to $14,999 | 0 | 0.0% |
| $15,000 to $24,999 | 8 | 10.1% |
| $25,000 to $34,999 | 0 | 0.0% |
| $35,000 to $49,999 | 0 | 0.0% |
| $50,000 to $74,999 | 0 | 0.0% |
| $75,000 to $99,999 | 0 | 0.0% |
| $100,000 to $149,999 | 0 | 0.0% |
| $150,000 to $199,999 | 0 | 0.0% |
| $200,000+ | 0 | 0.0% |
Family Income by Famaliy Size in Long Hollow
| Income Bracket | # Families | Median Income |
| 2-Person Families | 9 (11.4%) | $0 |
| 3-Person Families | 0 (0.0%) | $0 |
| 4-Person Families | 8 (10.1%) | $0 |
| 5-Person Families | 43 (54.4%) | $0 |
| 6-Person Families | 19 (24.0%) | $0 |
| 7+ Person Families | 0 (0.0%) | $0 |
| Total | 79 (100.0%) | $8,169 |
Family Income by Number of Earners in Long Hollow
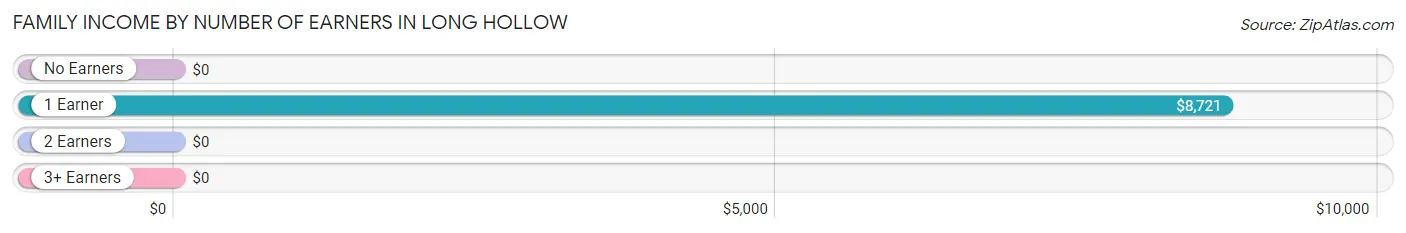
| Number of Earners | # Families | Median Income |
| No Earners | 19 (24.0%) | $0 |
| 1 Earner | 60 (75.9%) | $8,721 |
| 2 Earners | 0 (0.0%) | $0 |
| 3+ Earners | 0 (0.0%) | $0 |
| Total | 79 (100.0%) | $8,169 |
Household Income in Long Hollow
Household Income Brackets in Long Hollow
With 71 households falling in the category, the less than $10,000 income range is the most frequent in Long Hollow, accounting for 72.5% of all households.
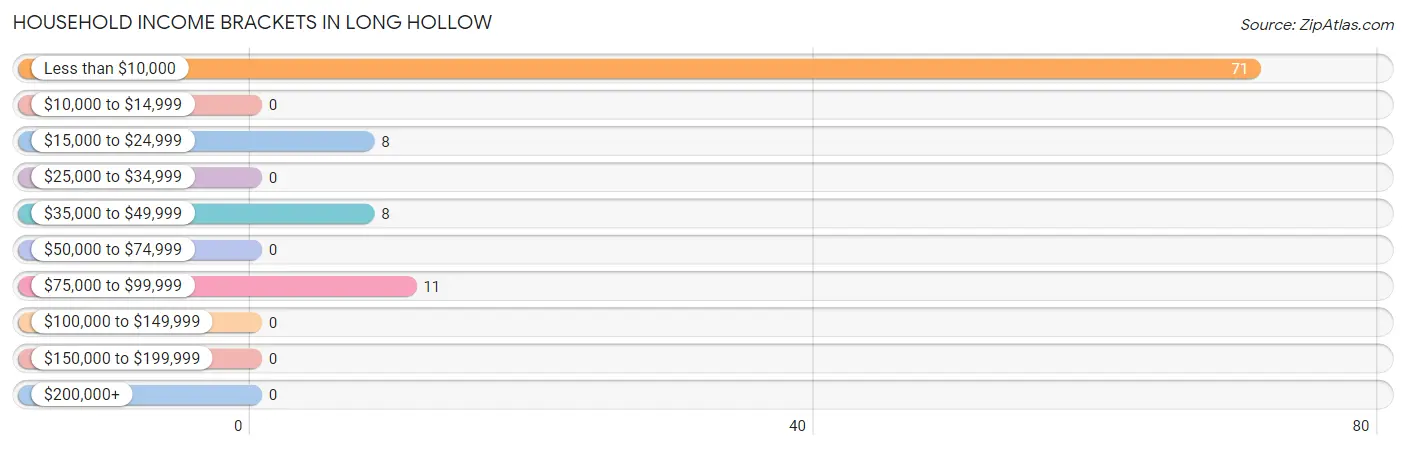
| Income Bracket | # Households | % Households |
| Less than $10,000 | 71 | 72.4% |
| $10,000 to $14,999 | 0 | 0.0% |
| $15,000 to $24,999 | 8 | 8.2% |
| $25,000 to $34,999 | 0 | 0.0% |
| $35,000 to $49,999 | 8 | 8.2% |
| $50,000 to $74,999 | 0 | 0.0% |
| $75,000 to $99,999 | 11 | 11.2% |
| $100,000 to $149,999 | 0 | 0.0% |
| $150,000 to $199,999 | 0 | 0.0% |
| $200,000+ | 0 | 0.0% |
Household Income by Householder Age in Long Hollow
The median household income in Long Hollow is $8,721, with the highest median household income of $8,256 found in the 25 to 44 years age bracket for the primary householder. A total of 82 households (83.7%) fall into this category. Meanwhile, the 15 to 24 years age bracket for the primary householder has the lowest median household income of $0, with 8 households (8.2%) in this group.
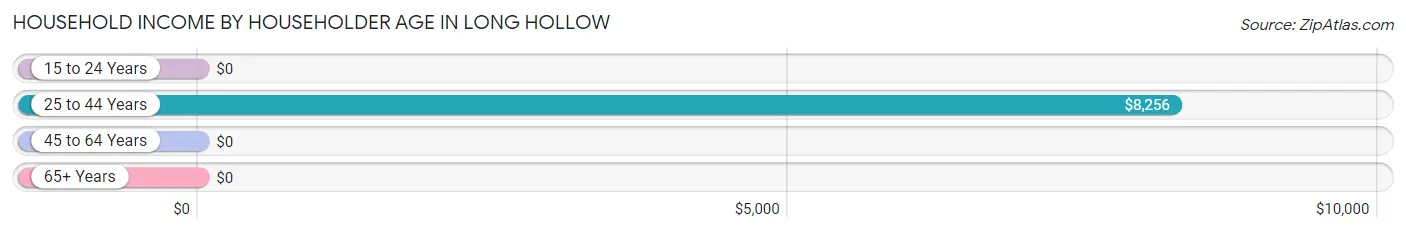
| Income Bracket | # Households | Median Income |
| 15 to 24 Years | 8 (8.2%) | $0 |
| 25 to 44 Years | 82 (83.7%) | $8,256 |
| 45 to 64 Years | 8 (8.2%) | $0 |
| 65+ Years | 0 (0.0%) | $0 |
| Total | 98 (100.0%) | $8,721 |
Poverty in Long Hollow
Income Below Poverty by Sex and Age in Long Hollow
With 65.6% poverty level for males and 96.3% for females among the residents of Long Hollow, under 5 year old males and under 5 year old females are the most vulnerable to poverty, with 42 males (100.0%) and 71 females (100.0%) in their respective age groups living below the poverty level.
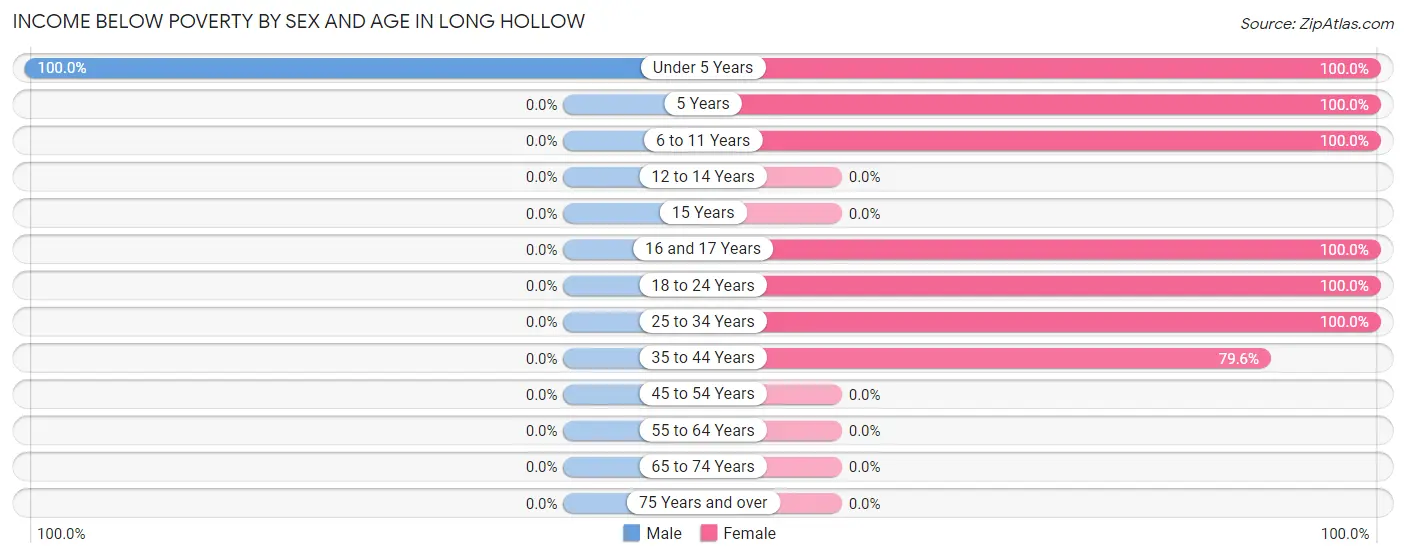
| Age Bracket | Male | Female |
| Under 5 Years | 42 (100.0%) | 71 (100.0%) |
| 5 Years | 0 (0.0%) | 17 (100.0%) |
| 6 to 11 Years | 0 (0.0%) | 93 (100.0%) |
| 12 to 14 Years | 0 (0.0%) | 0 (0.0%) |
| 15 Years | 0 (0.0%) | 0 (0.0%) |
| 16 and 17 Years | 0 (0.0%) | 29 (100.0%) |
| 18 to 24 Years | 0 (0.0%) | 8 (100.0%) |
| 25 to 34 Years | 0 (0.0%) | 28 (100.0%) |
| 35 to 44 Years | 0 (0.0%) | 43 (79.6%) |
| 45 to 54 Years | 0 (0.0%) | 0 (0.0%) |
| 55 to 64 Years | 0 (0.0%) | 0 (0.0%) |
| 65 to 74 Years | 0 (0.0%) | 0 (0.0%) |
| 75 Years and over | 0 (0.0%) | 0 (0.0%) |
| Total | 42 (65.6%) | 289 (96.3%) |
Income Above Poverty by Sex and Age in Long Hollow
According to the poverty statistics in Long Hollow, males aged 18 to 24 years and females aged 35 to 44 years are the age groups that are most secure financially, with 100.0% of males and 20.4% of females in these age groups living above the poverty line.
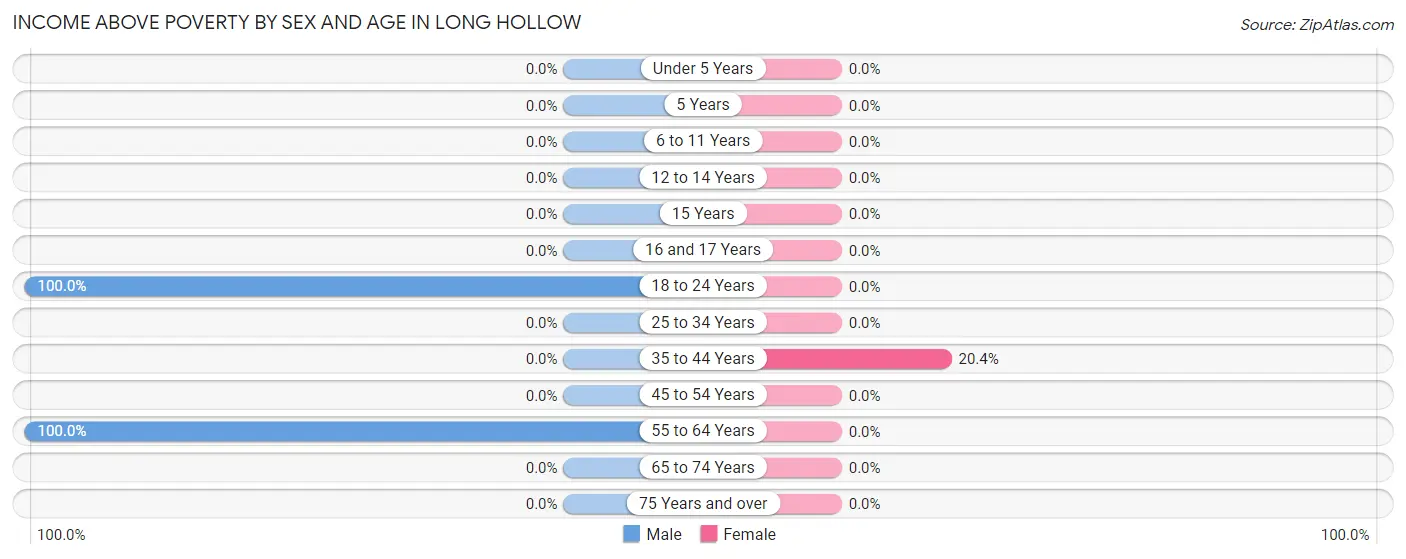
| Age Bracket | Male | Female |
| Under 5 Years | 0 (0.0%) | 0 (0.0%) |
| 5 Years | 0 (0.0%) | 0 (0.0%) |
| 6 to 11 Years | 0 (0.0%) | 0 (0.0%) |
| 12 to 14 Years | 0 (0.0%) | 0 (0.0%) |
| 15 Years | 0 (0.0%) | 0 (0.0%) |
| 16 and 17 Years | 0 (0.0%) | 0 (0.0%) |
| 18 to 24 Years | 14 (100.0%) | 0 (0.0%) |
| 25 to 34 Years | 0 (0.0%) | 0 (0.0%) |
| 35 to 44 Years | 0 (0.0%) | 11 (20.4%) |
| 45 to 54 Years | 0 (0.0%) | 0 (0.0%) |
| 55 to 64 Years | 8 (100.0%) | 0 (0.0%) |
| 65 to 74 Years | 0 (0.0%) | 0 (0.0%) |
| 75 Years and over | 0 (0.0%) | 0 (0.0%) |
| Total | 22 (34.4%) | 11 (3.7%) |
Income Below Poverty Among Married-Couple Families in Long Hollow
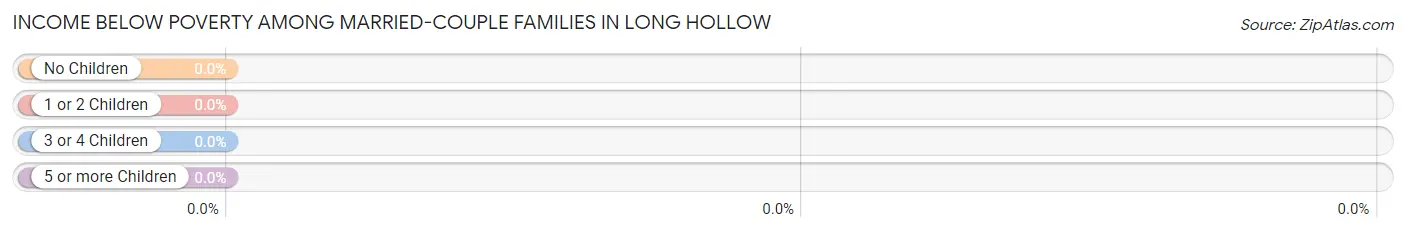
| Children | Above Poverty | Below Poverty |
| No Children | 0 (0.0%) | 0 (0.0%) |
| 1 or 2 Children | 0 (0.0%) | 0 (0.0%) |
| 3 or 4 Children | 0 (0.0%) | 0 (0.0%) |
| 5 or more Children | 0 (0.0%) | 0 (0.0%) |
| Total | 0 (0.0%) | 0 (0.0%) |
Income Below Poverty Among Single-Parent Households in Long Hollow
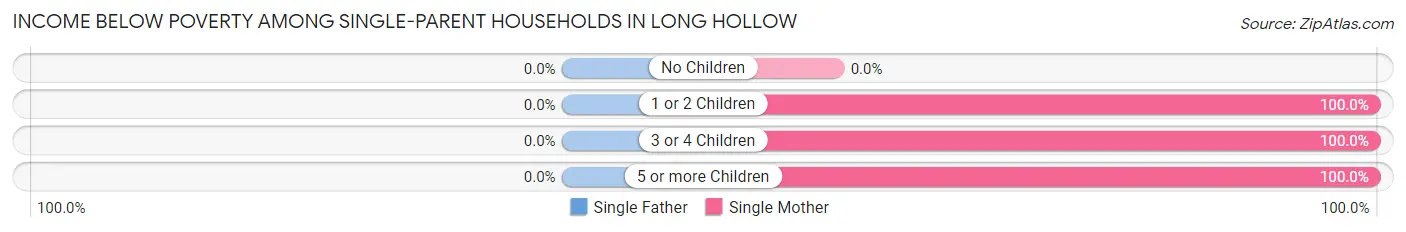
| Children | Single Father | Single Mother |
| No Children | 0 (0.0%) | 0 (0.0%) |
| 1 or 2 Children | 0 (0.0%) | 9 (100.0%) |
| 3 or 4 Children | 0 (0.0%) | 51 (100.0%) |
| 5 or more Children | 0 (0.0%) | 19 (100.0%) |
| Total | 0 (0.0%) | 79 (100.0%) |
Income Below Poverty Among Married-Couple vs Single-Parent Households in Long Hollow
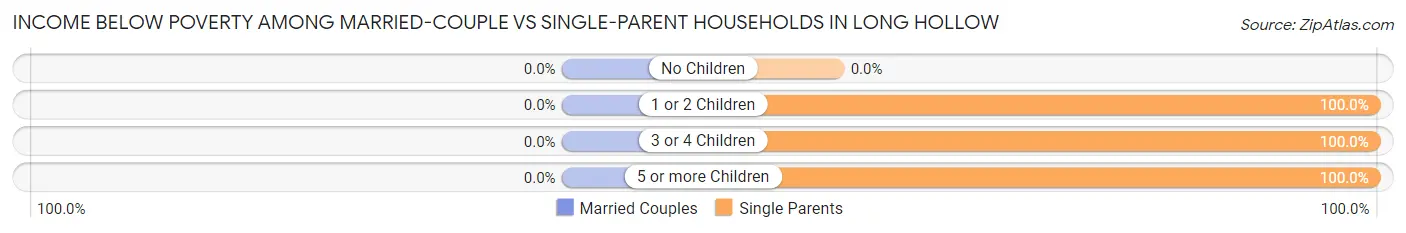
| Children | Married-Couple Families | Single-Parent Households |
| No Children | 0 (0.0%) | 0 (0.0%) |
| 1 or 2 Children | 0 (0.0%) | 9 (100.0%) |
| 3 or 4 Children | 0 (0.0%) | 51 (100.0%) |
| 5 or more Children | 0 (0.0%) | 19 (100.0%) |
| Total | 0 (0.0%) | 79 (100.0%) |
Employment Characteristics in Long Hollow
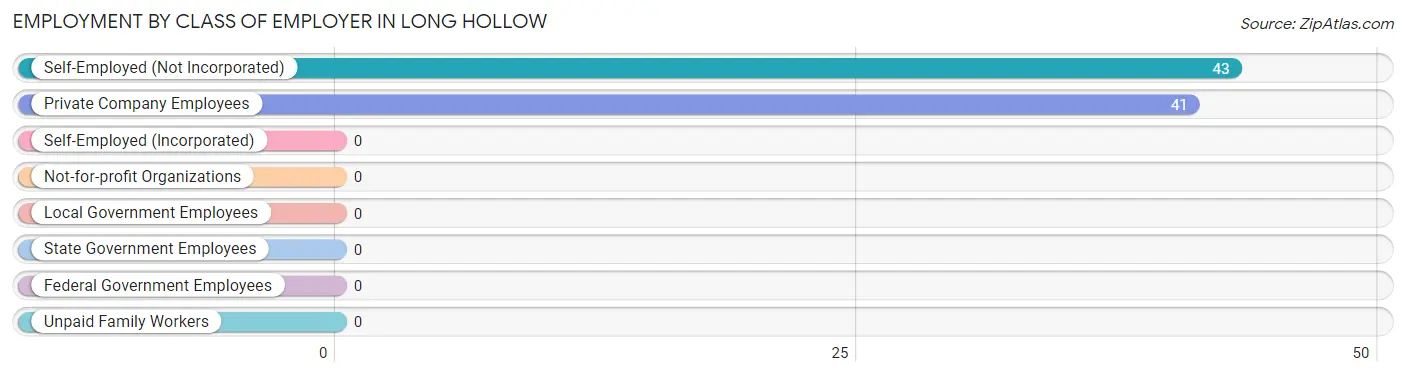
Employment by Class of Employer in Long Hollow
Among the 84 employed individuals in Long Hollow, self-employed (not incorporated) (43 | 51.2%), and private company employees (41 | 48.8%) make up the most common classes of employment.
| Employer Class | # Employees | % Employees |
| Private Company Employees | 41 | 48.8% |
| Self-Employed (Incorporated) | 0 | 0.0% |
| Self-Employed (Not Incorporated) | 43 | 51.2% |
| Not-for-profit Organizations | 0 | 0.0% |
| Local Government Employees | 0 | 0.0% |
| State Government Employees | 0 | 0.0% |
| Federal Government Employees | 0 | 0.0% |
| Unpaid Family Workers | 0 | 0.0% |
| Total | 84 | 100.0% |
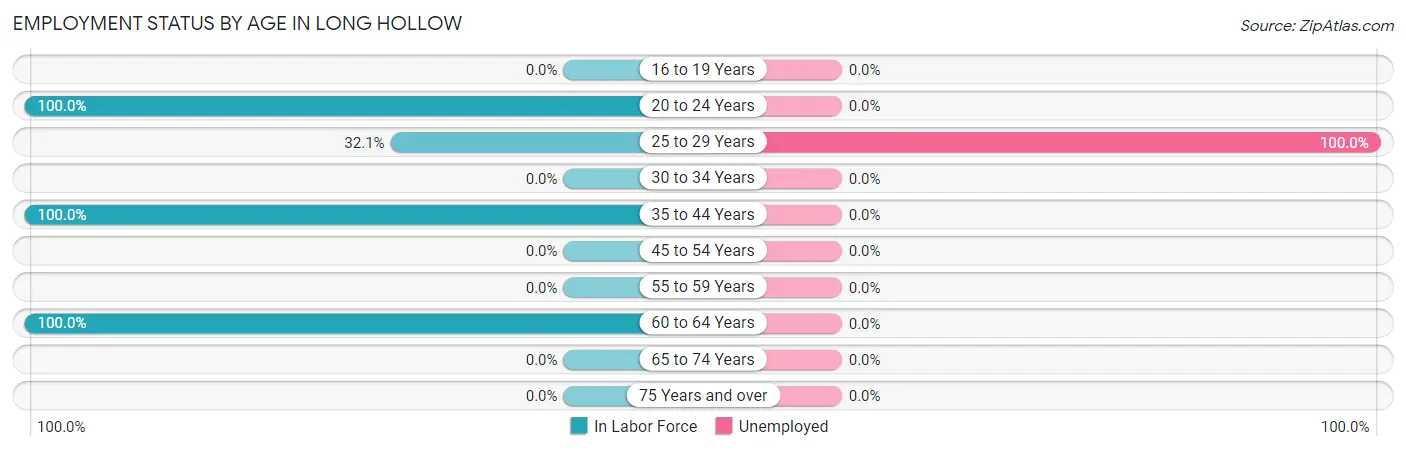
Employment Status by Age in Long Hollow
According to the labor force statistics for Long Hollow, out of the total population over 16 years of age (141), 66.0% or 93 individuals are in the labor force, with 9.7% or 9 of them unemployed. The age group with the highest labor force participation rate is 20 to 24 years, with 100.0% or 22 individuals in the labor force. Within the labor force, the 25 to 29 years age range has the highest percentage of unemployed individuals, with 100.0% or 9 of them being unemployed.
| Age Bracket | In Labor Force | Unemployed |
| 16 to 19 Years | 0 (0.0%) | 0 (0.0%) |
| 20 to 24 Years | 22 (100.0%) | 0 (0.0%) |
| 25 to 29 Years | 9 (32.1%) | 9 (100.0%) |
| 30 to 34 Years | 0 (0.0%) | 0 (0.0%) |
| 35 to 44 Years | 54 (100.0%) | 0 (0.0%) |
| 45 to 54 Years | 0 (0.0%) | 0 (0.0%) |
| 55 to 59 Years | 0 (0.0%) | 0 (0.0%) |
| 60 to 64 Years | 8 (100.0%) | 0 (0.0%) |
| 65 to 74 Years | 0 (0.0%) | 0 (0.0%) |
| 75 Years and over | 0 (0.0%) | 0 (0.0%) |
| Total | 93 (66.0%) | 9 (9.7%) |
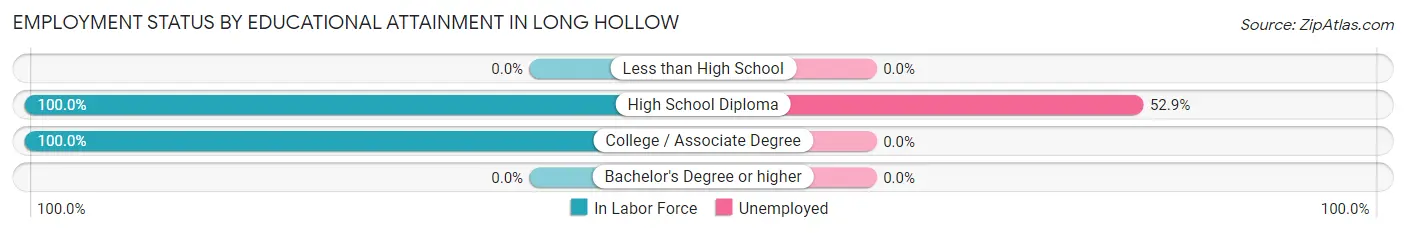
Employment Status by Educational Attainment in Long Hollow
According to labor force statistics for Long Hollow, 78.9% of individuals (71) out of the total population between 25 and 64 years of age (90) are in the labor force, with 12.7% or 9 of them being unemployed. The group with the highest labor force participation rate are those with the educational attainment of high school diploma, with 100.0% or 17 individuals in the labor force. Within the labor force, individuals with high school diploma education have the highest percentage of unemployment, with 52.9% or 9 of them being unemployed.
| Educational Attainment | In Labor Force | Unemployed |
| Less than High School | 0 (0.0%) | 0 (0.0%) |
| High School Diploma | 17 (100.0%) | 9 (52.9%) |
| College / Associate Degree | 54 (100.0%) | 0 (0.0%) |
| Bachelor's Degree or higher | 0 (0.0%) | 0 (0.0%) |
| Total | 71 (78.9%) | 11 (12.7%) |
Employment Occupations by Sex in Long Hollow
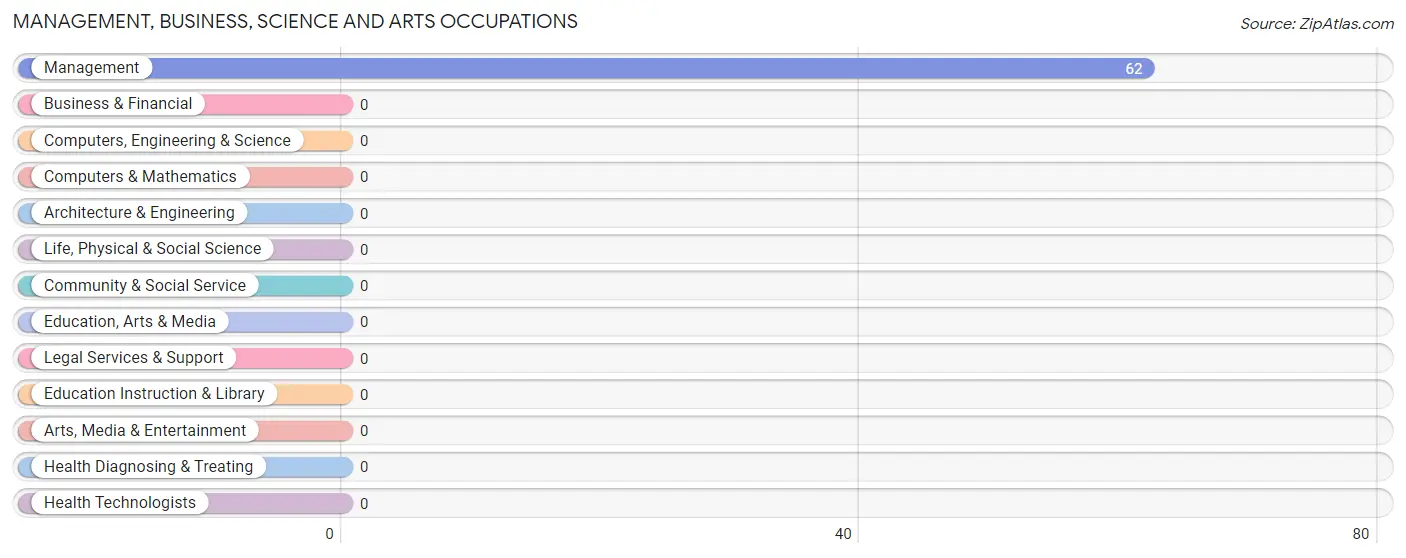
Management, Business, Science and Arts Occupations
The most common Management, Business, Science and Arts occupations in Long Hollow are , and Management (62 | 73.8%).
Management, Business, Science and Arts Occupations by Sex
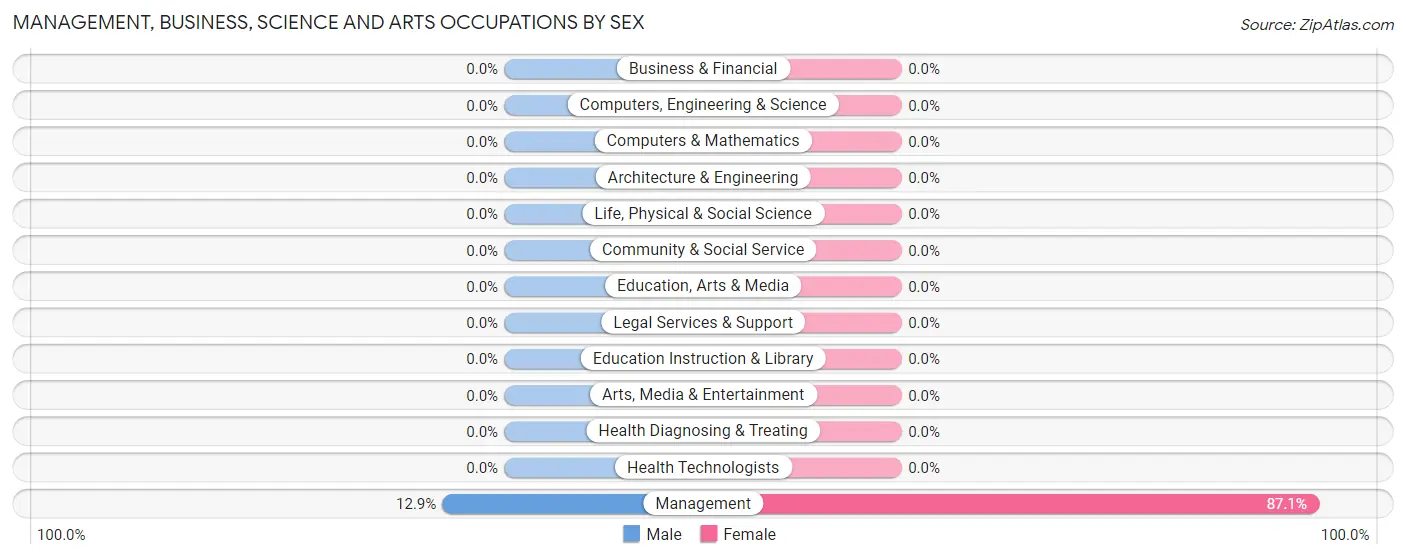
| Occupation | Male | Female |
| Management | 8 (12.9%) | 54 (87.1%) |
| Business & Financial | 0 (0.0%) | 0 (0.0%) |
| Computers, Engineering & Science | 0 (0.0%) | 0 (0.0%) |
| Computers & Mathematics | 0 (0.0%) | 0 (0.0%) |
| Architecture & Engineering | 0 (0.0%) | 0 (0.0%) |
| Life, Physical & Social Science | 0 (0.0%) | 0 (0.0%) |
| Community & Social Service | 0 (0.0%) | 0 (0.0%) |
| Education, Arts & Media | 0 (0.0%) | 0 (0.0%) |
| Legal Services & Support | 0 (0.0%) | 0 (0.0%) |
| Education Instruction & Library | 0 (0.0%) | 0 (0.0%) |
| Arts, Media & Entertainment | 0 (0.0%) | 0 (0.0%) |
| Health Diagnosing & Treating | 0 (0.0%) | 0 (0.0%) |
| Health Technologists | 0 (0.0%) | 0 (0.0%) |
| Total (Category) | 8 (12.9%) | 54 (87.1%) |
| Total (Overall) | 22 (26.2%) | 62 (73.8%) |
Services Occupations
The most common Services occupations in Long Hollow are Security & Protection (14 | 16.7%), and Firefighting & Prevention (14 | 16.7%).
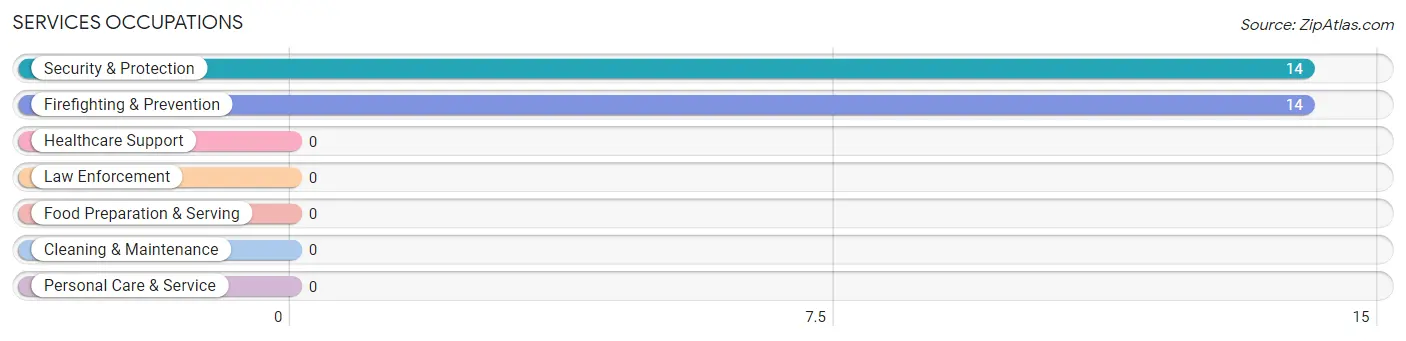
Services Occupations by Sex
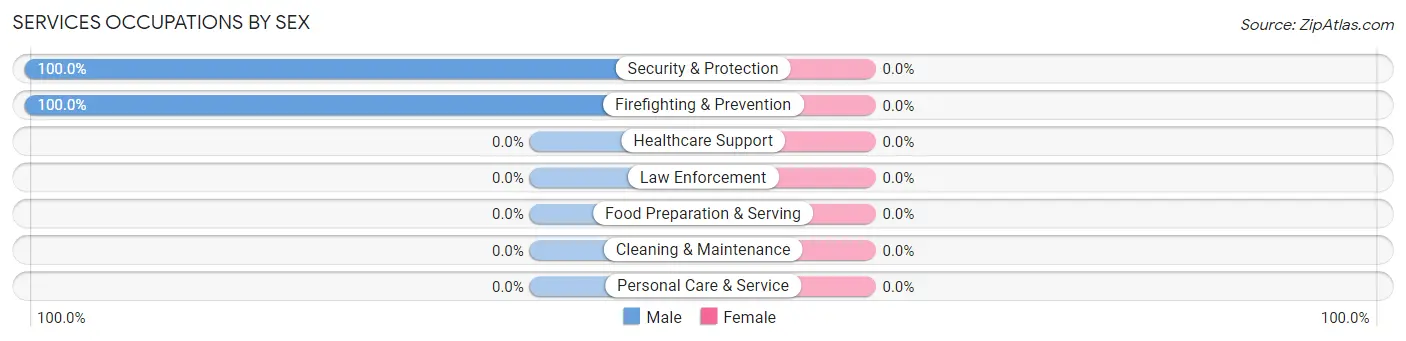
| Occupation | Male | Female |
| Healthcare Support | 0 (0.0%) | 0 (0.0%) |
| Security & Protection | 14 (100.0%) | 0 (0.0%) |
| Firefighting & Prevention | 14 (100.0%) | 0 (0.0%) |
| Law Enforcement | 0 (0.0%) | 0 (0.0%) |
| Food Preparation & Serving | 0 (0.0%) | 0 (0.0%) |
| Cleaning & Maintenance | 0 (0.0%) | 0 (0.0%) |
| Personal Care & Service | 0 (0.0%) | 0 (0.0%) |
| Total (Category) | 14 (100.0%) | 0 (0.0%) |
| Total (Overall) | 22 (26.2%) | 62 (73.8%) |
Sales and Office Occupations
The most common Sales and Office occupations in Long Hollow are , and Sales & Related (8 | 9.5%).
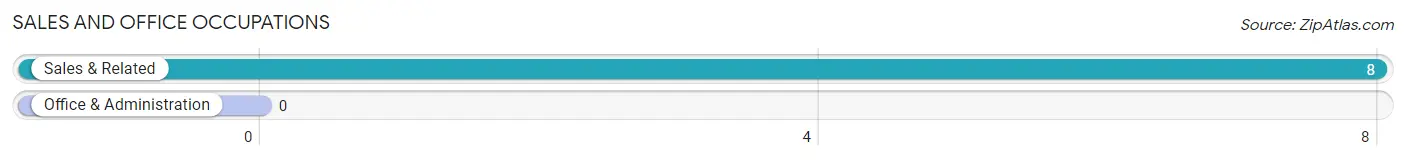
Sales and Office Occupations by Sex
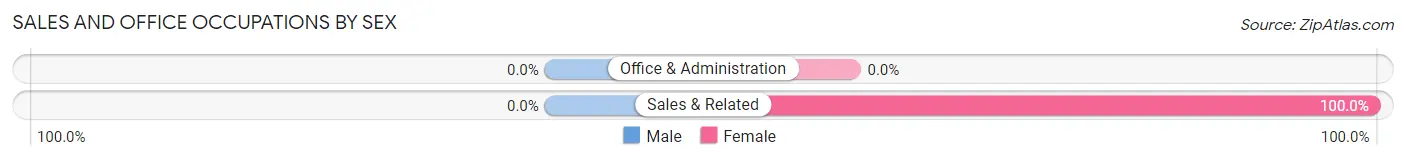
| Occupation | Male | Female |
| Sales & Related | 0 (0.0%) | 8 (100.0%) |
| Office & Administration | 0 (0.0%) | 0 (0.0%) |
| Total (Category) | 0 (0.0%) | 8 (100.0%) |
| Total (Overall) | 22 (26.2%) | 62 (73.8%) |
Natural Resources, Construction and Maintenance Occupations
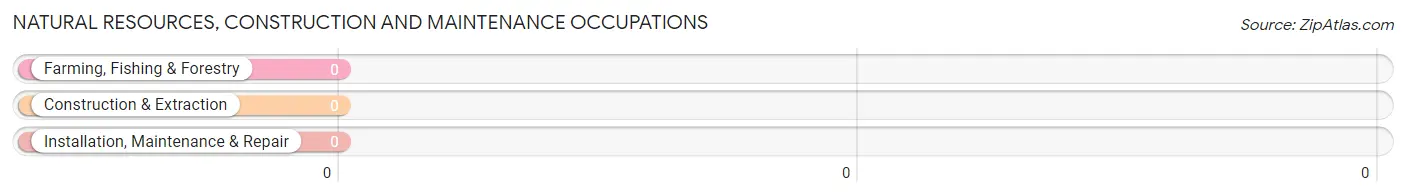
Natural Resources, Construction and Maintenance Occupations by Sex
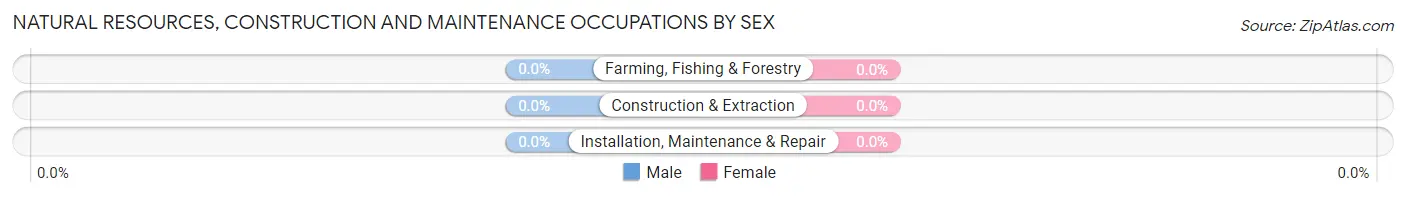
| Occupation | Male | Female |
| Farming, Fishing & Forestry | 0 (0.0%) | 0 (0.0%) |
| Construction & Extraction | 0 (0.0%) | 0 (0.0%) |
| Installation, Maintenance & Repair | 0 (0.0%) | 0 (0.0%) |
| Total (Category) | 0 (0.0%) | 0 (0.0%) |
| Total (Overall) | 22 (26.2%) | 62 (73.8%) |
Production, Transportation and Moving Occupations
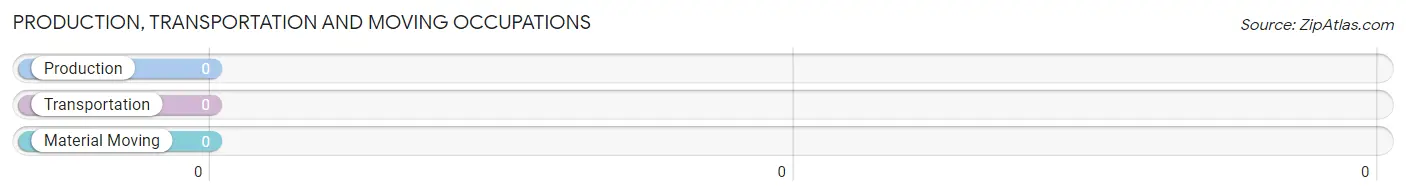
Production, Transportation and Moving Occupations by Sex
| Occupation | Male | Female |
| Production | 0 (0.0%) | 0 (0.0%) |
| Transportation | 0 (0.0%) | 0 (0.0%) |
| Material Moving | 0 (0.0%) | 0 (0.0%) |
| Total (Category) | 0 (0.0%) | 0 (0.0%) |
| Total (Overall) | 22 (26.2%) | 62 (73.8%) |
Employment Industries by Sex in Long Hollow
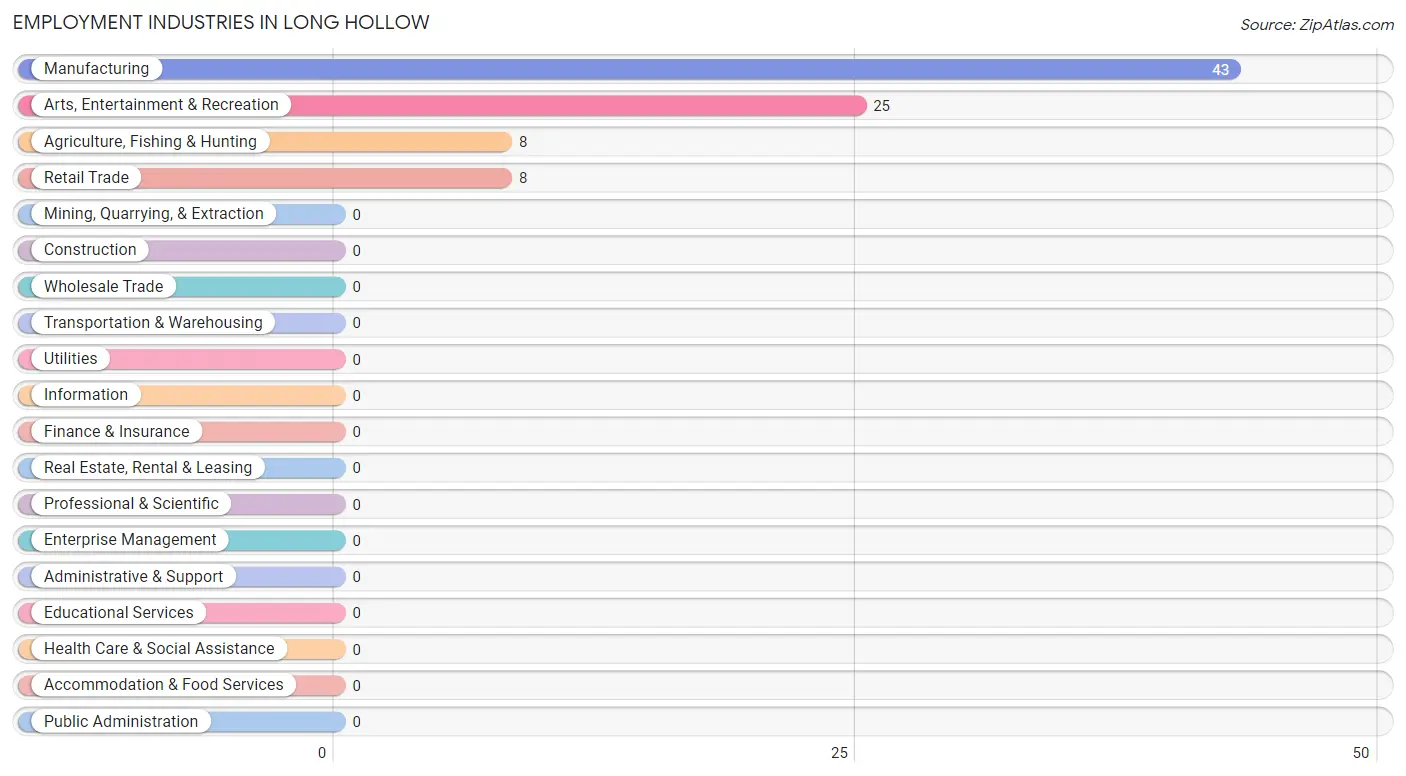
Employment Industries in Long Hollow
The major employment industries in Long Hollow include Manufacturing (43 | 51.2%), Arts, Entertainment & Recreation (25 | 29.8%), Agriculture, Fishing & Hunting (8 | 9.5%), and Retail Trade (8 | 9.5%).
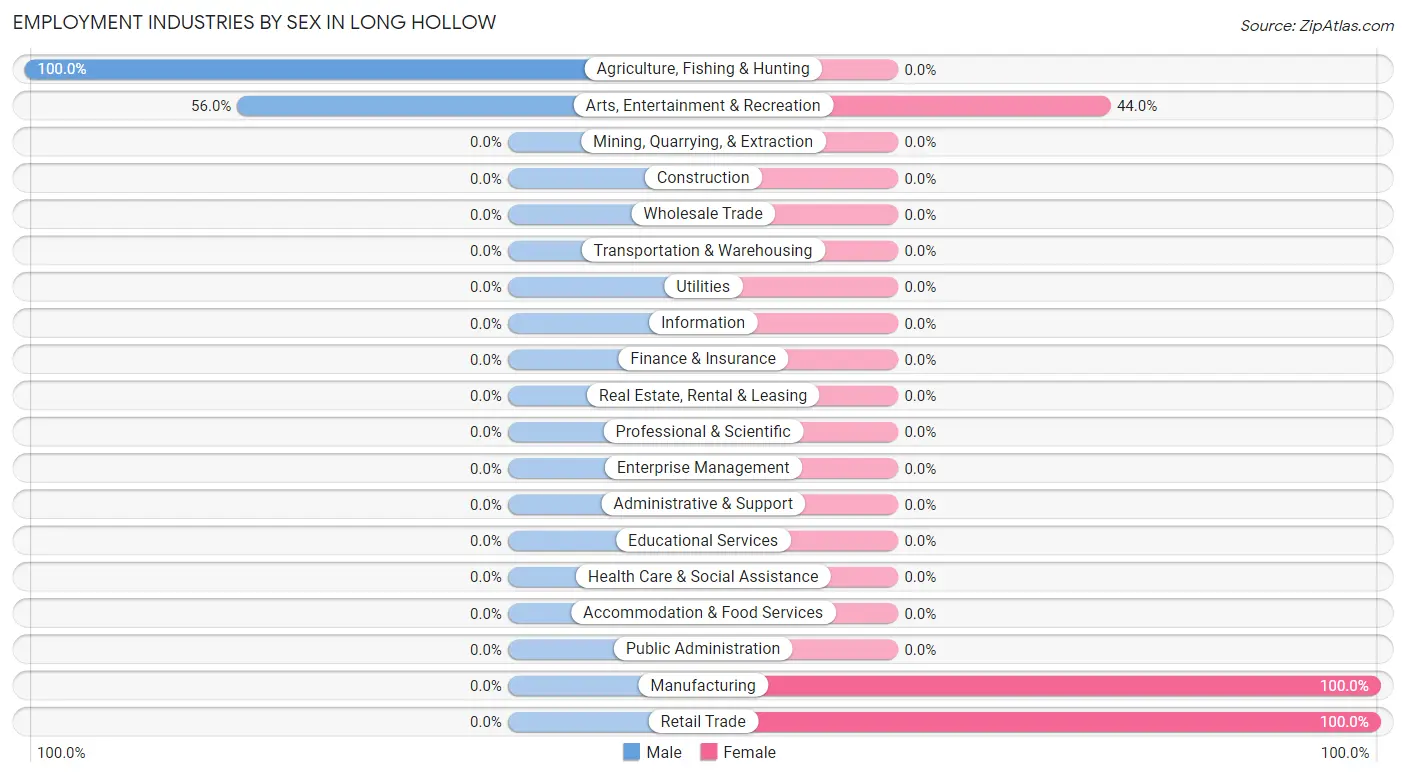
Employment Industries by Sex in Long Hollow
The Long Hollow industries that see more men than women are Agriculture, Fishing & Hunting (100.0%), and Arts, Entertainment & Recreation (56.0%), whereas the industries that tend to have a higher number of women are Manufacturing (100.0%), Retail Trade (100.0%), and Arts, Entertainment & Recreation (44.0%).
| Industry | Male | Female |
| Agriculture, Fishing & Hunting | 8 (100.0%) | 0 (0.0%) |
| Mining, Quarrying, & Extraction | 0 (0.0%) | 0 (0.0%) |
| Construction | 0 (0.0%) | 0 (0.0%) |
| Manufacturing | 0 (0.0%) | 43 (100.0%) |
| Wholesale Trade | 0 (0.0%) | 0 (0.0%) |
| Retail Trade | 0 (0.0%) | 8 (100.0%) |
| Transportation & Warehousing | 0 (0.0%) | 0 (0.0%) |
| Utilities | 0 (0.0%) | 0 (0.0%) |
| Information | 0 (0.0%) | 0 (0.0%) |
| Finance & Insurance | 0 (0.0%) | 0 (0.0%) |
| Real Estate, Rental & Leasing | 0 (0.0%) | 0 (0.0%) |
| Professional & Scientific | 0 (0.0%) | 0 (0.0%) |
| Enterprise Management | 0 (0.0%) | 0 (0.0%) |
| Administrative & Support | 0 (0.0%) | 0 (0.0%) |
| Educational Services | 0 (0.0%) | 0 (0.0%) |
| Health Care & Social Assistance | 0 (0.0%) | 0 (0.0%) |
| Arts, Entertainment & Recreation | 14 (56.0%) | 11 (44.0%) |
| Accommodation & Food Services | 0 (0.0%) | 0 (0.0%) |
| Public Administration | 0 (0.0%) | 0 (0.0%) |
| Total | 22 (26.2%) | 62 (73.8%) |
Education in Long Hollow
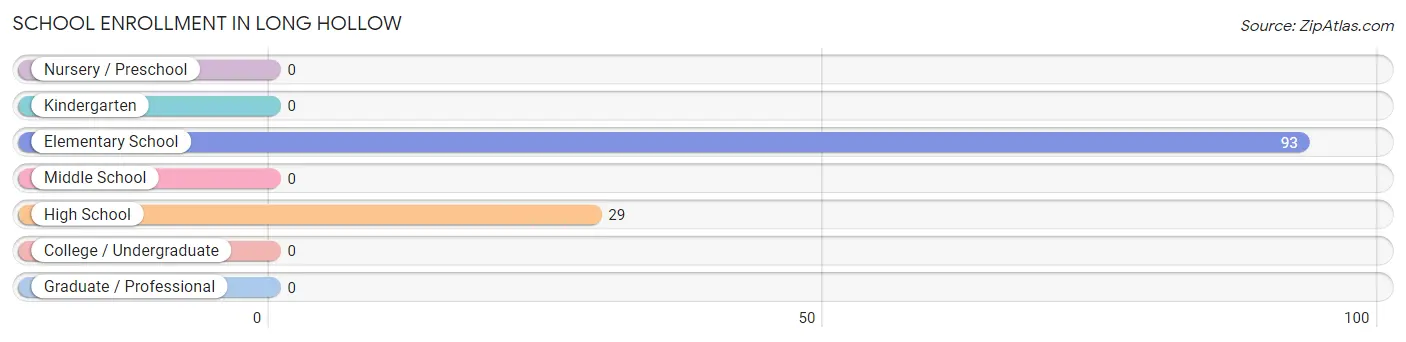
School Enrollment in Long Hollow
The most common levels of schooling among the 122 students in Long Hollow are elementary school (93 | 76.2%), and high school (29 | 23.8%).
| School Level | # Students | % Students |
| Nursery / Preschool | 0 | 0.0% |
| Kindergarten | 0 | 0.0% |
| Elementary School | 93 | 76.2% |
| Middle School | 0 | 0.0% |
| High School | 29 | 23.8% |
| College / Undergraduate | 0 | 0.0% |
| Graduate / Professional | 0 | 0.0% |
| Total | 122 | 100.0% |
School Enrollment by Age by Funding Source in Long Hollow
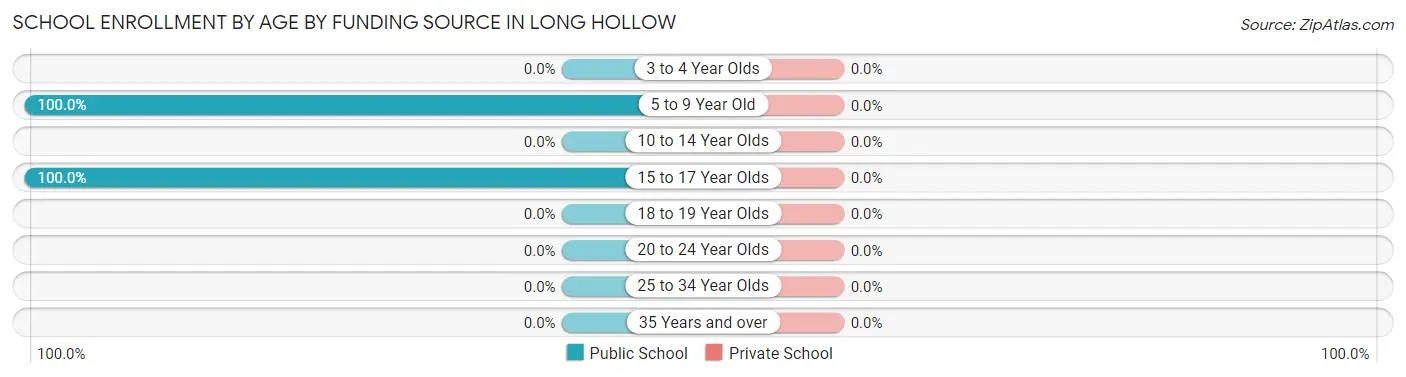
| Age Bracket | Public School | Private School |
| 3 to 4 Year Olds | 0 (0.0%) | 0 (0.0%) |
| 5 to 9 Year Old | 93 (100.0%) | 0 (0.0%) |
| 10 to 14 Year Olds | 0 (0.0%) | 0 (0.0%) |
| 15 to 17 Year Olds | 29 (100.0%) | 0 (0.0%) |
| 18 to 19 Year Olds | 0 (0.0%) | 0 (0.0%) |
| 20 to 24 Year Olds | 0 (0.0%) | 0 (0.0%) |
| 25 to 34 Year Olds | 0 (0.0%) | 0 (0.0%) |
| 35 Years and over | 0 (0.0%) | 0 (0.0%) |
| Total | 122 (100.0%) | 0 (0.0%) |
Educational Attainment by Field of Study in Long Hollow
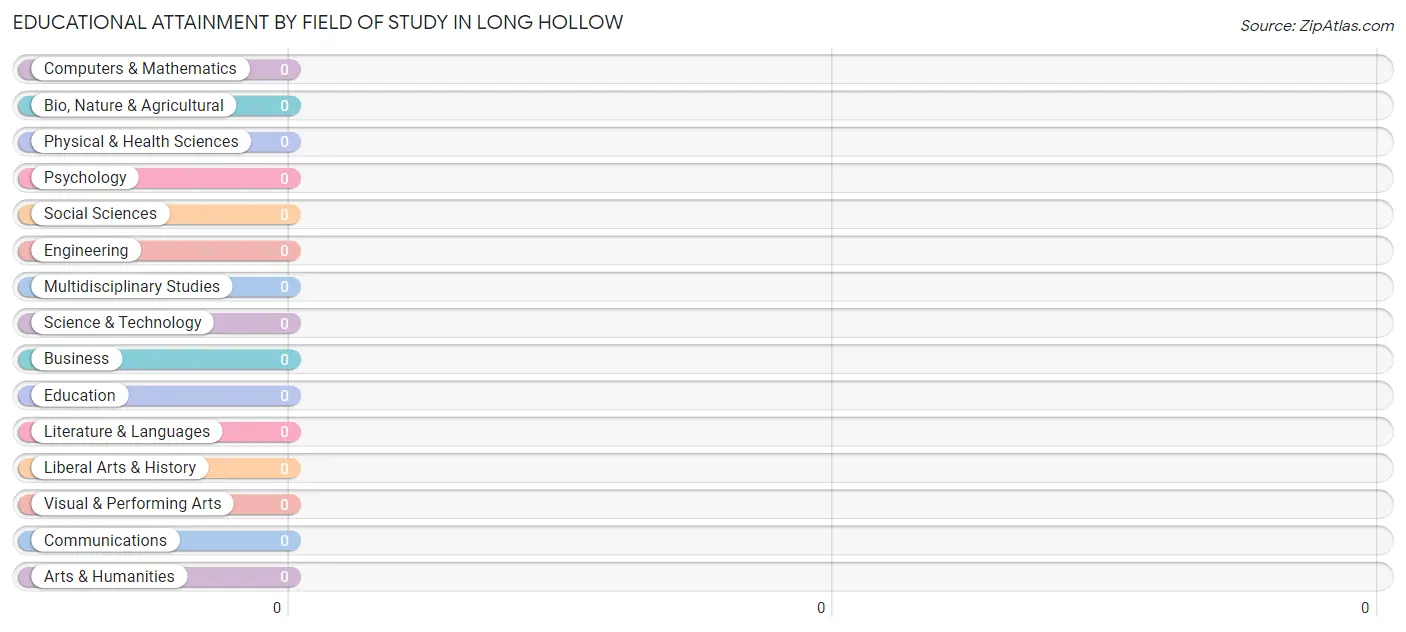
| Field of Study | # Graduates | % Graduates |
| Computers & Mathematics | 0 | 0.0% |
| Bio, Nature & Agricultural | 0 | 0.0% |
| Physical & Health Sciences | 0 | 0.0% |
| Psychology | 0 | 0.0% |
| Social Sciences | 0 | 0.0% |
| Engineering | 0 | 0.0% |
| Multidisciplinary Studies | 0 | 0.0% |
| Science & Technology | 0 | 0.0% |
| Business | 0 | 0.0% |
| Education | 0 | 0.0% |
| Literature & Languages | 0 | 0.0% |
| Liberal Arts & History | 0 | 0.0% |
| Visual & Performing Arts | 0 | 0.0% |
| Communications | 0 | 0.0% |
| Arts & Humanities | 0 | 0.0% |
| Total | 0 | 0.0% |
Transportation & Commute in Long Hollow
Vehicle Availability by Sex in Long Hollow
The most prevalent vehicle ownership categories in Long Hollow are males with 1 vehicle (14, accounting for 63.6%) and females with 1 vehicle (8, making up 22.6%).
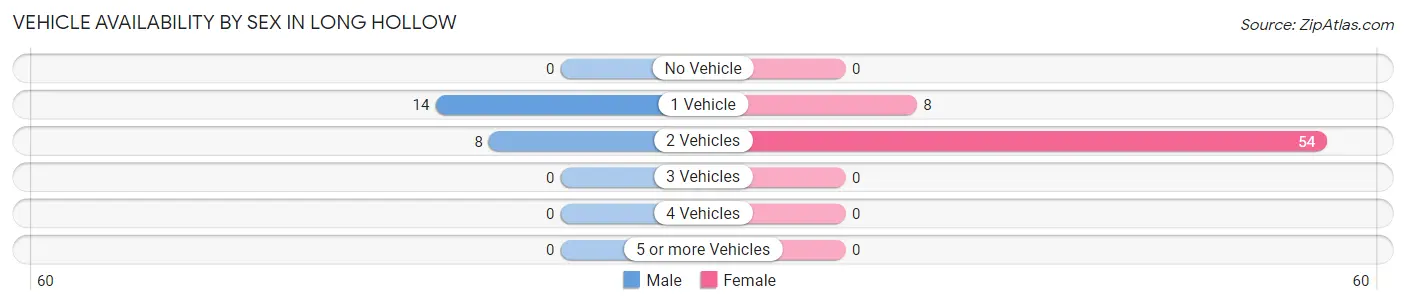
| Vehicles Available | Male | Female |
| No Vehicle | 0 (0.0%) | 0 (0.0%) |
| 1 Vehicle | 14 (63.6%) | 8 (12.9%) |
| 2 Vehicles | 8 (36.4%) | 54 (87.1%) |
| 3 Vehicles | 0 (0.0%) | 0 (0.0%) |
| 4 Vehicles | 0 (0.0%) | 0 (0.0%) |
| 5 or more Vehicles | 0 (0.0%) | 0 (0.0%) |
| Total | 22 (100.0%) | 62 (100.0%) |
Commute Time in Long Hollow
The most frequently occuring commute durations in Long Hollow are 15 to 19 minutes (30 commuters, 73.2%), 45 to 59 minutes (11 commuters, 26.8%), and less than 5 minutes (0 commuters, 0.0%).
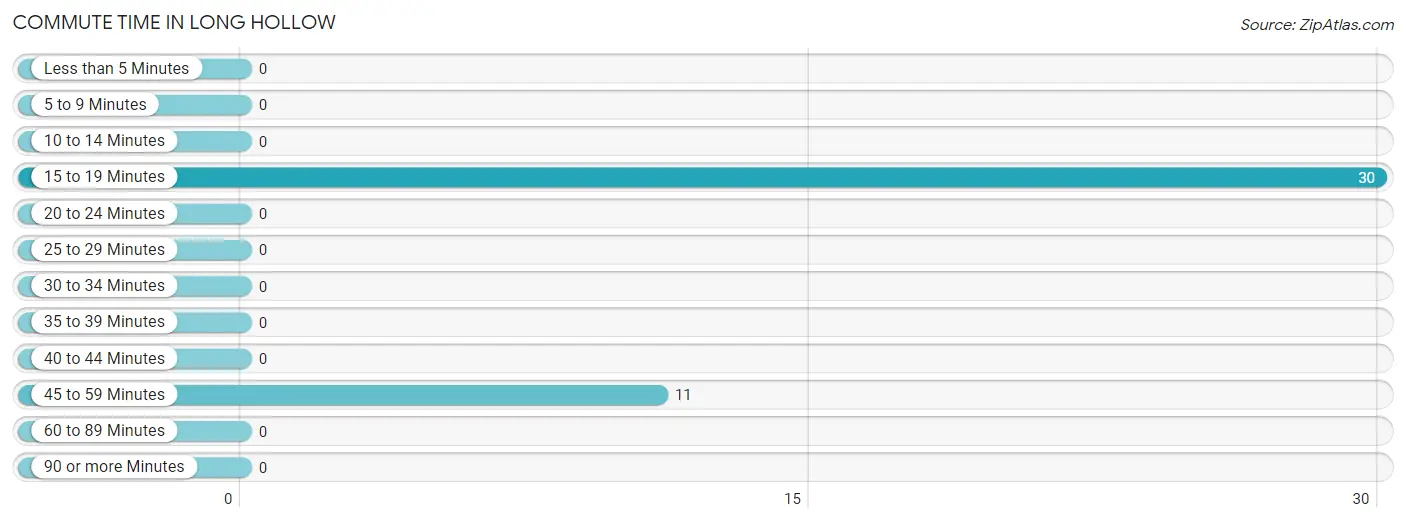
| Commute Time | # Commuters | % Commuters |
| Less than 5 Minutes | 0 | 0.0% |
| 5 to 9 Minutes | 0 | 0.0% |
| 10 to 14 Minutes | 0 | 0.0% |
| 15 to 19 Minutes | 30 | 73.2% |
| 20 to 24 Minutes | 0 | 0.0% |
| 25 to 29 Minutes | 0 | 0.0% |
| 30 to 34 Minutes | 0 | 0.0% |
| 35 to 39 Minutes | 0 | 0.0% |
| 40 to 44 Minutes | 0 | 0.0% |
| 45 to 59 Minutes | 11 | 26.8% |
| 60 to 89 Minutes | 0 | 0.0% |
| 90 or more Minutes | 0 | 0.0% |
Commute Time by Sex in Long Hollow
The most common commute times in Long Hollow are 15 to 19 minutes (22 commuters, 100.0%) for males and 45 to 59 minutes (11 commuters, 57.9%) for females.
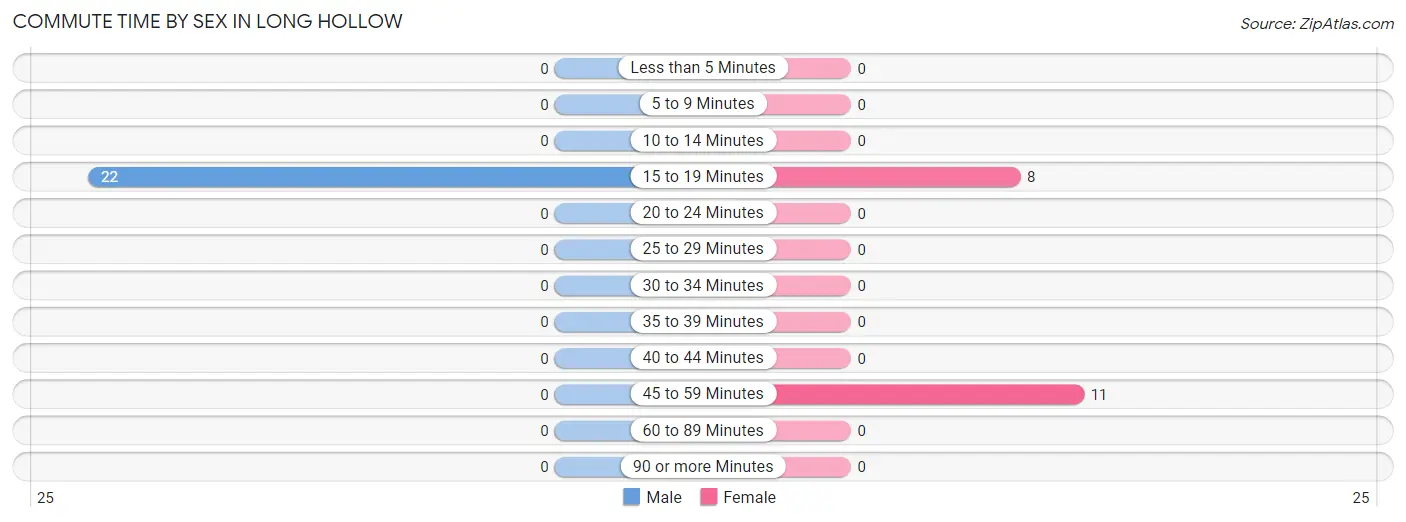
| Commute Time | Male | Female |
| Less than 5 Minutes | 0 (0.0%) | 0 (0.0%) |
| 5 to 9 Minutes | 0 (0.0%) | 0 (0.0%) |
| 10 to 14 Minutes | 0 (0.0%) | 0 (0.0%) |
| 15 to 19 Minutes | 22 (100.0%) | 8 (42.1%) |
| 20 to 24 Minutes | 0 (0.0%) | 0 (0.0%) |
| 25 to 29 Minutes | 0 (0.0%) | 0 (0.0%) |
| 30 to 34 Minutes | 0 (0.0%) | 0 (0.0%) |
| 35 to 39 Minutes | 0 (0.0%) | 0 (0.0%) |
| 40 to 44 Minutes | 0 (0.0%) | 0 (0.0%) |
| 45 to 59 Minutes | 0 (0.0%) | 11 (57.9%) |
| 60 to 89 Minutes | 0 (0.0%) | 0 (0.0%) |
| 90 or more Minutes | 0 (0.0%) | 0 (0.0%) |
Time of Departure to Work by Sex in Long Hollow
The most frequent times of departure to work in Long Hollow are 8:00 AM to 8:29 AM (22, 100.0%) for males and 6:00 AM to 6:29 AM (11, 57.9%) for females.
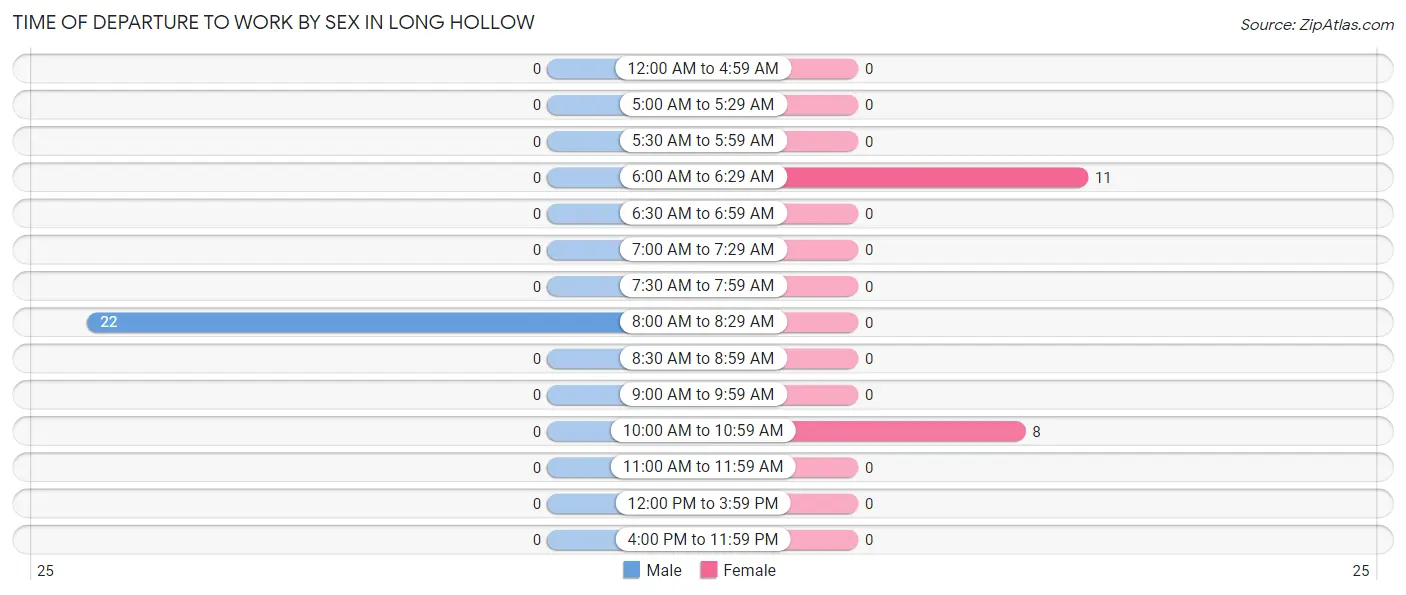
| Time of Departure | Male | Female |
| 12:00 AM to 4:59 AM | 0 (0.0%) | 0 (0.0%) |
| 5:00 AM to 5:29 AM | 0 (0.0%) | 0 (0.0%) |
| 5:30 AM to 5:59 AM | 0 (0.0%) | 0 (0.0%) |
| 6:00 AM to 6:29 AM | 0 (0.0%) | 11 (57.9%) |
| 6:30 AM to 6:59 AM | 0 (0.0%) | 0 (0.0%) |
| 7:00 AM to 7:29 AM | 0 (0.0%) | 0 (0.0%) |
| 7:30 AM to 7:59 AM | 0 (0.0%) | 0 (0.0%) |
| 8:00 AM to 8:29 AM | 22 (100.0%) | 0 (0.0%) |
| 8:30 AM to 8:59 AM | 0 (0.0%) | 0 (0.0%) |
| 9:00 AM to 9:59 AM | 0 (0.0%) | 0 (0.0%) |
| 10:00 AM to 10:59 AM | 0 (0.0%) | 8 (42.1%) |
| 11:00 AM to 11:59 AM | 0 (0.0%) | 0 (0.0%) |
| 12:00 PM to 3:59 PM | 0 (0.0%) | 0 (0.0%) |
| 4:00 PM to 11:59 PM | 0 (0.0%) | 0 (0.0%) |
| Total | 22 (100.0%) | 19 (100.0%) |
Housing Occupancy in Long Hollow
Occupancy by Ownership in Long Hollow
Of the total 98 dwellings in Long Hollow, owner-occupied units account for 19 (19.4%), while renter-occupied units make up 79 (80.6%).
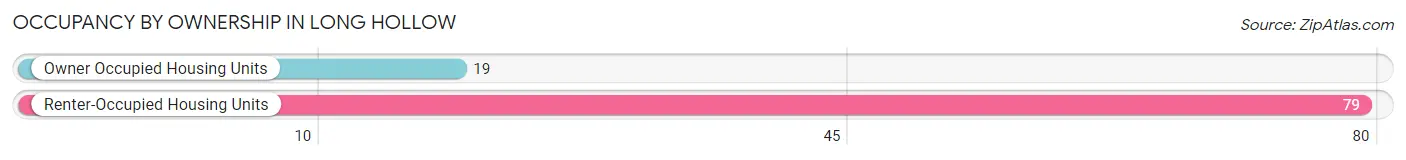
| Occupancy | # Housing Units | % Housing Units |
| Owner Occupied Housing Units | 19 | 19.4% |
| Renter-Occupied Housing Units | 79 | 80.6% |
| Total Occupied Housing Units | 98 | 100.0% |
Occupancy by Household Size in Long Hollow
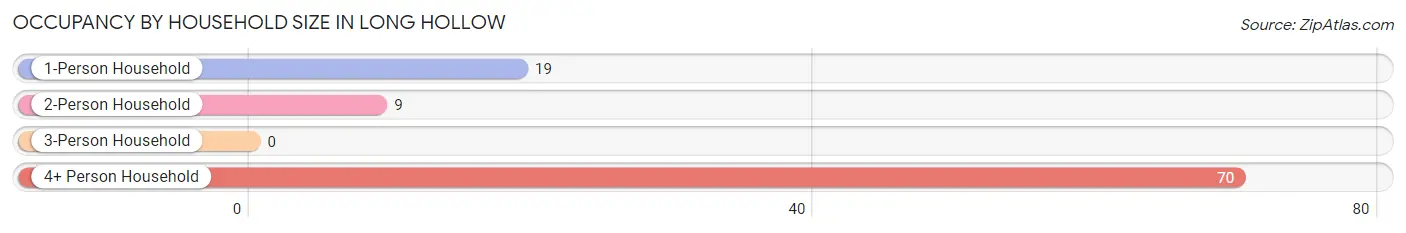
| Household Size | # Housing Units | % Housing Units |
| 1-Person Household | 19 | 19.4% |
| 2-Person Household | 9 | 9.2% |
| 3-Person Household | 0 | 0.0% |
| 4+ Person Household | 70 | 71.4% |
| Total Housing Units | 98 | 100.0% |
Occupancy by Ownership by Household Size in Long Hollow
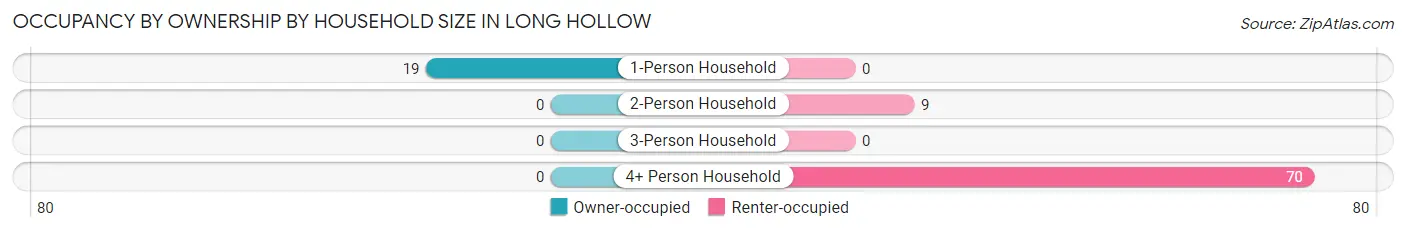
| Household Size | Owner-occupied | Renter-occupied |
| 1-Person Household | 19 (100.0%) | 0 (0.0%) |
| 2-Person Household | 0 (0.0%) | 9 (100.0%) |
| 3-Person Household | 0 (0.0%) | 0 (0.0%) |
| 4+ Person Household | 0 (0.0%) | 70 (100.0%) |
| Total Housing Units | 19 (19.4%) | 79 (80.6%) |
Occupancy by Educational Attainment in Long Hollow
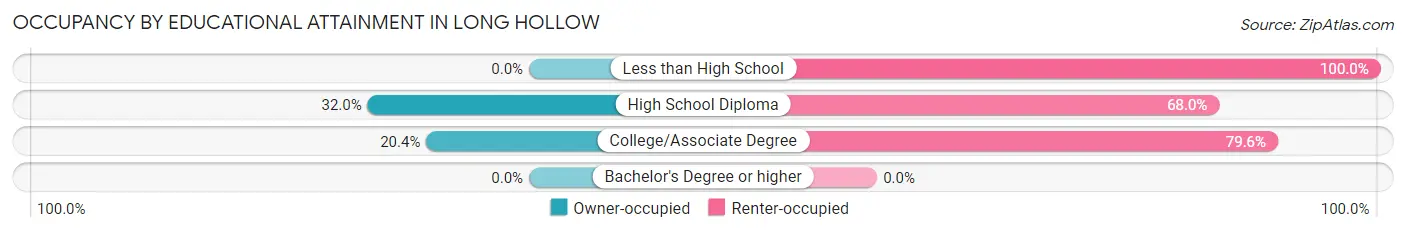
| Household Size | Owner-occupied | Renter-occupied |
| Less than High School | 0 (0.0%) | 19 (100.0%) |
| High School Diploma | 8 (32.0%) | 17 (68.0%) |
| College/Associate Degree | 11 (20.4%) | 43 (79.6%) |
| Bachelor's Degree or higher | 0 (0.0%) | 0 (0.0%) |
Occupancy by Age of Householder in Long Hollow
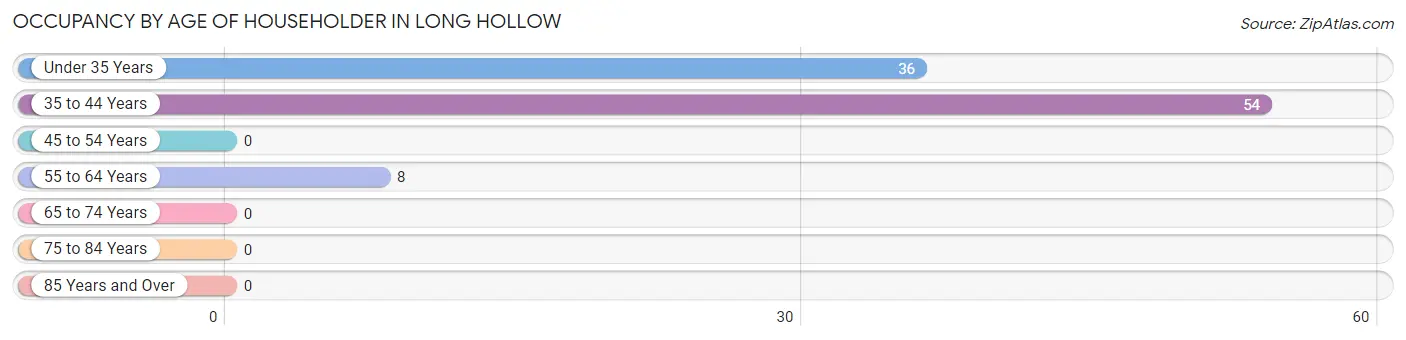
| Age Bracket | # Households | % Households |
| Under 35 Years | 36 | 36.7% |
| 35 to 44 Years | 54 | 55.1% |
| 45 to 54 Years | 0 | 0.0% |
| 55 to 64 Years | 8 | 8.2% |
| 65 to 74 Years | 0 | 0.0% |
| 75 to 84 Years | 0 | 0.0% |
| 85 Years and Over | 0 | 0.0% |
| Total | 98 | 100.0% |
Housing Finances in Long Hollow
Median Income by Occupancy in Long Hollow
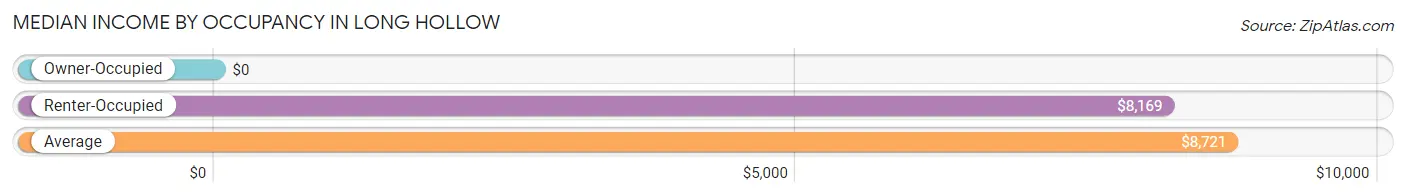
| Occupancy Type | # Households | Median Income |
| Owner-Occupied | 19 (19.4%) | $0 |
| Renter-Occupied | 79 (80.6%) | $8,169 |
| Average | 98 (100.0%) | $8,721 |
Occupancy by Householder Income Bracket in Long Hollow
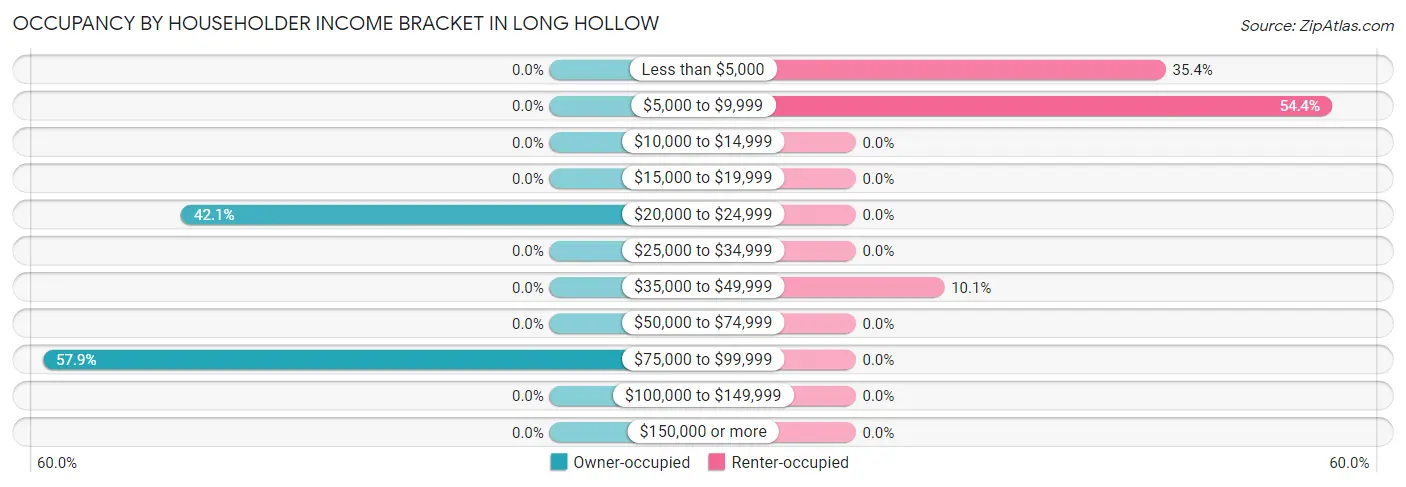
| Income Bracket | Owner-occupied | Renter-occupied |
| Less than $5,000 | 0 (0.0%) | 28 (35.4%) |
| $5,000 to $9,999 | 0 (0.0%) | 43 (54.4%) |
| $10,000 to $14,999 | 0 (0.0%) | 0 (0.0%) |
| $15,000 to $19,999 | 0 (0.0%) | 0 (0.0%) |
| $20,000 to $24,999 | 8 (42.1%) | 0 (0.0%) |
| $25,000 to $34,999 | 0 (0.0%) | 0 (0.0%) |
| $35,000 to $49,999 | 0 (0.0%) | 8 (10.1%) |
| $50,000 to $74,999 | 0 (0.0%) | 0 (0.0%) |
| $75,000 to $99,999 | 11 (57.9%) | 0 (0.0%) |
| $100,000 to $149,999 | 0 (0.0%) | 0 (0.0%) |
| $150,000 or more | 0 (0.0%) | 0 (0.0%) |
| Total | 19 (100.0%) | 79 (100.0%) |
Monthly Housing Cost Tiers in Long Hollow
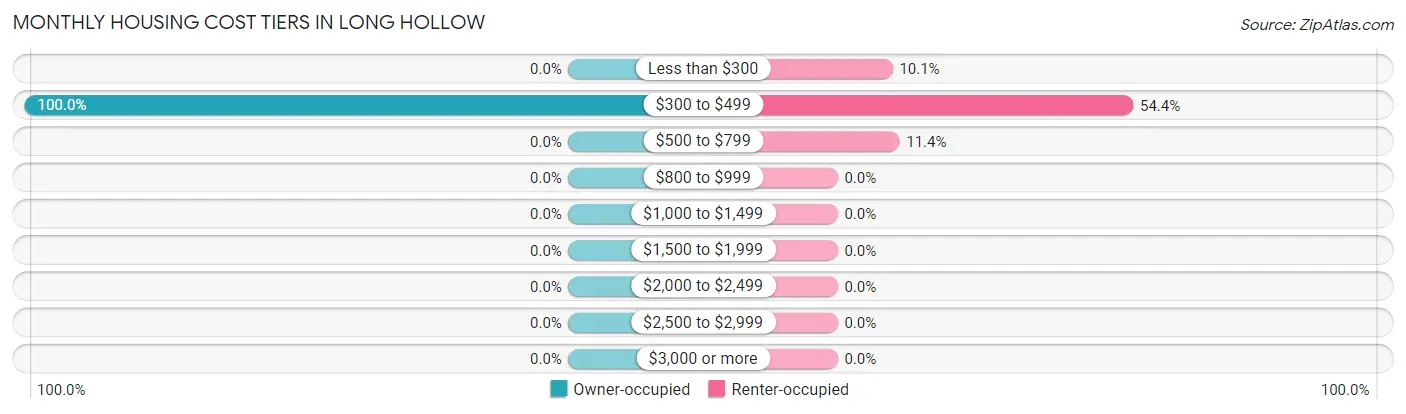
| Monthly Cost | Owner-occupied | Renter-occupied |
| Less than $300 | 0 (0.0%) | 8 (10.1%) |
| $300 to $499 | 19 (100.0%) | 43 (54.4%) |
| $500 to $799 | 0 (0.0%) | 9 (11.4%) |
| $800 to $999 | 0 (0.0%) | 0 (0.0%) |
| $1,000 to $1,499 | 0 (0.0%) | 0 (0.0%) |
| $1,500 to $1,999 | 0 (0.0%) | 0 (0.0%) |
| $2,000 to $2,499 | 0 (0.0%) | 0 (0.0%) |
| $2,500 to $2,999 | 0 (0.0%) | 0 (0.0%) |
| $3,000 or more | 0 (0.0%) | 0 (0.0%) |
| Total | 19 (100.0%) | 79 (100.0%) |
Physical Housing Characteristics in Long Hollow
Housing Structures in Long Hollow
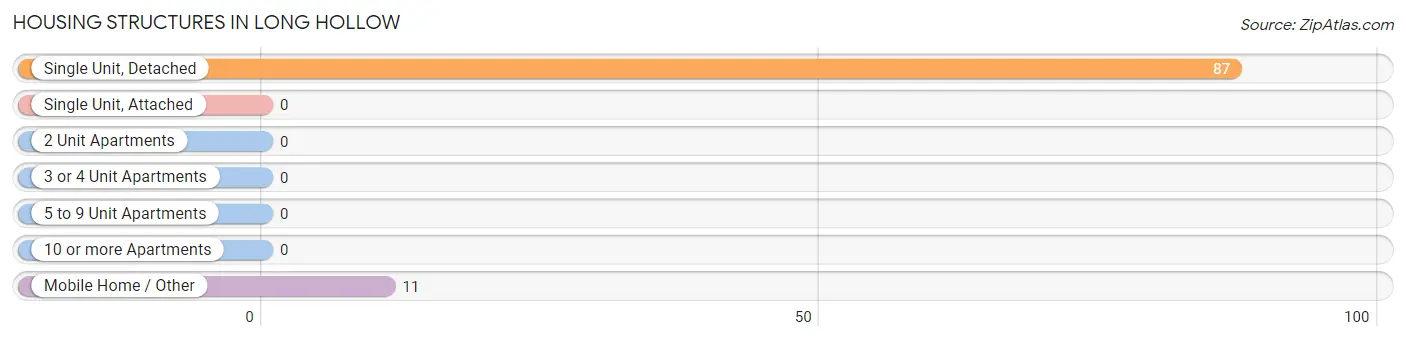
| Structure Type | # Housing Units | % Housing Units |
| Single Unit, Detached | 87 | 88.8% |
| Single Unit, Attached | 0 | 0.0% |
| 2 Unit Apartments | 0 | 0.0% |
| 3 or 4 Unit Apartments | 0 | 0.0% |
| 5 to 9 Unit Apartments | 0 | 0.0% |
| 10 or more Apartments | 0 | 0.0% |
| Mobile Home / Other | 11 | 11.2% |
| Total | 98 | 100.0% |
Housing Structures by Occupancy in Long Hollow
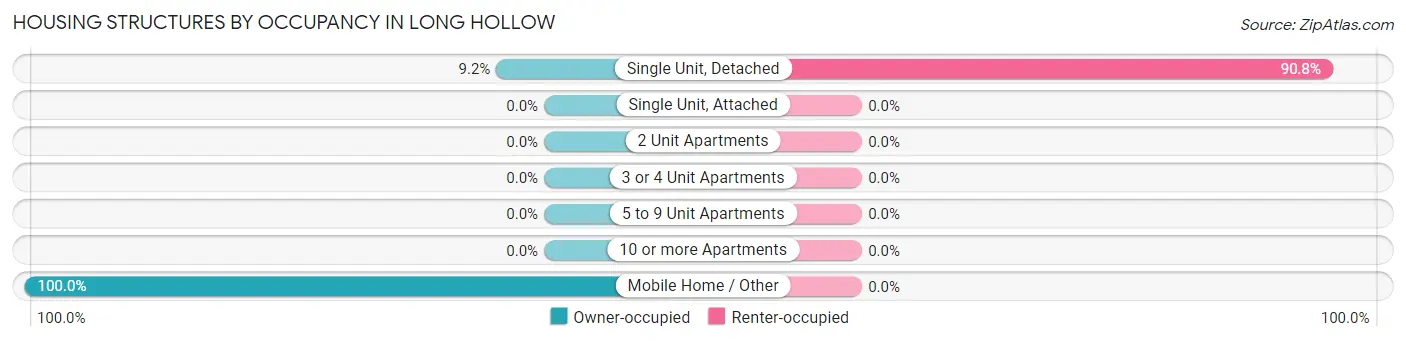
| Structure Type | Owner-occupied | Renter-occupied |
| Single Unit, Detached | 8 (9.2%) | 79 (90.8%) |
| Single Unit, Attached | 0 (0.0%) | 0 (0.0%) |
| 2 Unit Apartments | 0 (0.0%) | 0 (0.0%) |
| 3 or 4 Unit Apartments | 0 (0.0%) | 0 (0.0%) |
| 5 to 9 Unit Apartments | 0 (0.0%) | 0 (0.0%) |
| 10 or more Apartments | 0 (0.0%) | 0 (0.0%) |
| Mobile Home / Other | 11 (100.0%) | 0 (0.0%) |
| Total | 19 (19.4%) | 79 (80.6%) |
Housing Structures by Number of Rooms in Long Hollow
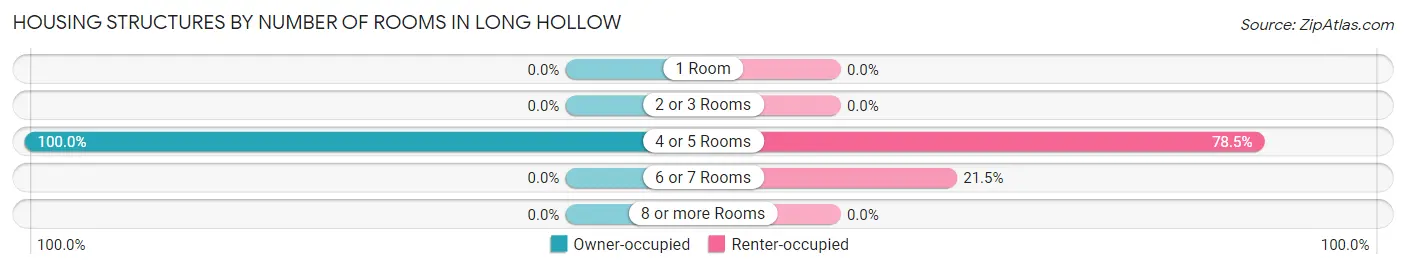
| Number of Rooms | Owner-occupied | Renter-occupied |
| 1 Room | 0 (0.0%) | 0 (0.0%) |
| 2 or 3 Rooms | 0 (0.0%) | 0 (0.0%) |
| 4 or 5 Rooms | 19 (100.0%) | 62 (78.5%) |
| 6 or 7 Rooms | 0 (0.0%) | 17 (21.5%) |
| 8 or more Rooms | 0 (0.0%) | 0 (0.0%) |
| Total | 19 (100.0%) | 79 (100.0%) |
Housing Structure by Heating Type in Long Hollow
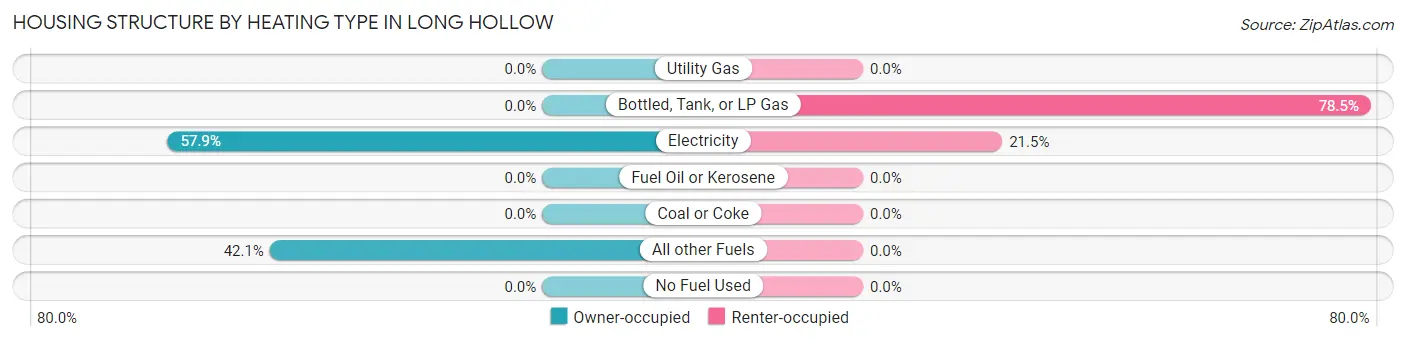
| Heating Type | Owner-occupied | Renter-occupied |
| Utility Gas | 0 (0.0%) | 0 (0.0%) |
| Bottled, Tank, or LP Gas | 0 (0.0%) | 62 (78.5%) |
| Electricity | 11 (57.9%) | 17 (21.5%) |
| Fuel Oil or Kerosene | 0 (0.0%) | 0 (0.0%) |
| Coal or Coke | 0 (0.0%) | 0 (0.0%) |
| All other Fuels | 8 (42.1%) | 0 (0.0%) |
| No Fuel Used | 0 (0.0%) | 0 (0.0%) |
| Total | 19 (100.0%) | 79 (100.0%) |
Household Vehicle Usage in Long Hollow
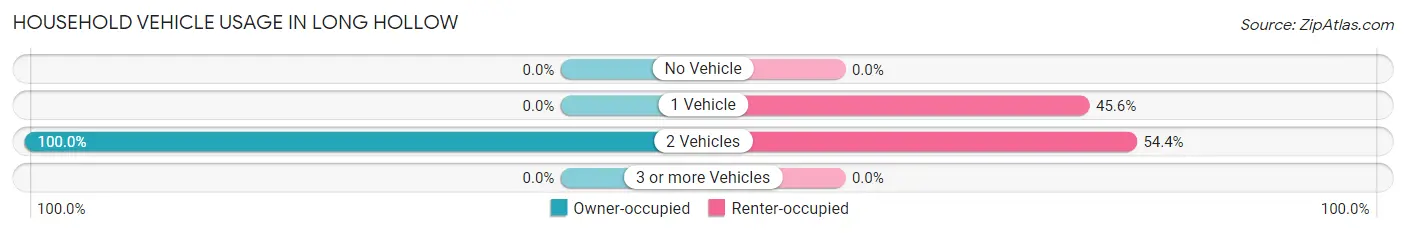
| Vehicles per Household | Owner-occupied | Renter-occupied |
| No Vehicle | 0 (0.0%) | 0 (0.0%) |
| 1 Vehicle | 0 (0.0%) | 36 (45.6%) |
| 2 Vehicles | 19 (100.0%) | 43 (54.4%) |
| 3 or more Vehicles | 0 (0.0%) | 0 (0.0%) |
| Total | 19 (100.0%) | 79 (100.0%) |
Real Estate & Mortgages in Long Hollow
Real Estate and Mortgage Overview in Long Hollow
| Characteristic | Without Mortgage | With Mortgage |
| Housing Units | 19 | 0 |
| Median Property Value | - | - |
| Median Household Income | - | - |
| Monthly Housing Costs | - | - |
| Real Estate Taxes | - | - |
Property Value by Mortgage Status in Long Hollow
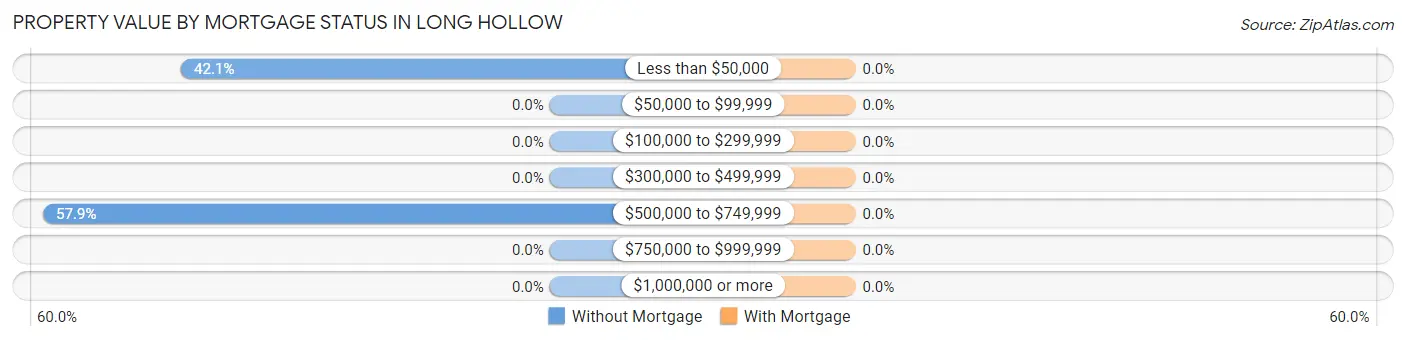
| Property Value | Without Mortgage | With Mortgage |
| Less than $50,000 | 8 (42.1%) | 0 (0.0%) |
| $50,000 to $99,999 | 0 (0.0%) | 0 (0.0%) |
| $100,000 to $299,999 | 0 (0.0%) | 0 (0.0%) |
| $300,000 to $499,999 | 0 (0.0%) | 0 (0.0%) |
| $500,000 to $749,999 | 11 (57.9%) | 0 (0.0%) |
| $750,000 to $999,999 | 0 (0.0%) | 0 (0.0%) |
| $1,000,000 or more | 0 (0.0%) | 0 (0.0%) |
| Total | 19 (100.0%) | 0 (0.0%) |
Household Income by Mortgage Status in Long Hollow
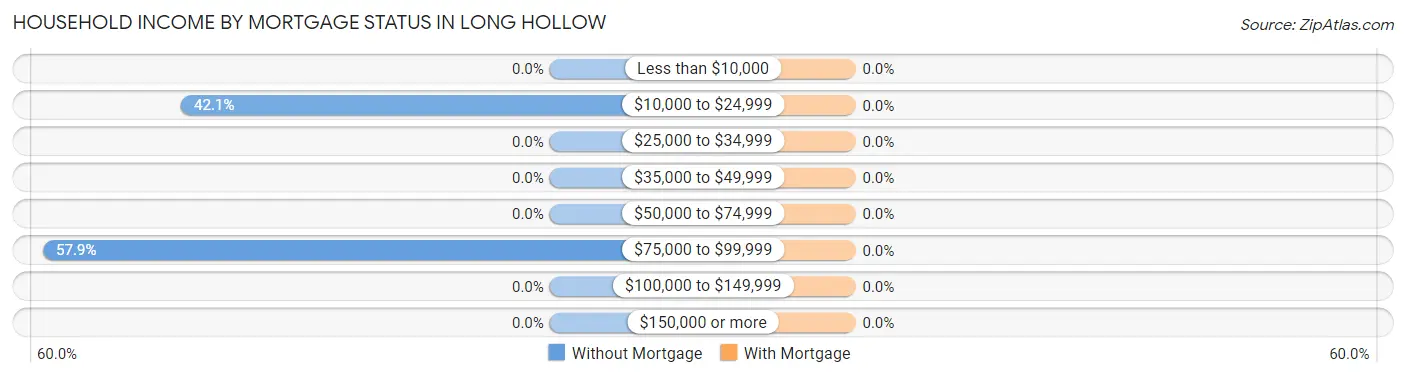
| Household Income | Without Mortgage | With Mortgage |
| Less than $10,000 | 0 (0.0%) | 0 (0.0%) |
| $10,000 to $24,999 | 8 (42.1%) | 0 (0.0%) |
| $25,000 to $34,999 | 0 (0.0%) | 0 (0.0%) |
| $35,000 to $49,999 | 0 (0.0%) | 0 (0.0%) |
| $50,000 to $74,999 | 0 (0.0%) | 0 (0.0%) |
| $75,000 to $99,999 | 11 (57.9%) | 0 (0.0%) |
| $100,000 to $149,999 | 0 (0.0%) | 0 (0.0%) |
| $150,000 or more | 0 (0.0%) | 0 (0.0%) |
| Total | 19 (100.0%) | 0 (0.0%) |
Property Value to Household Income Ratio in Long Hollow
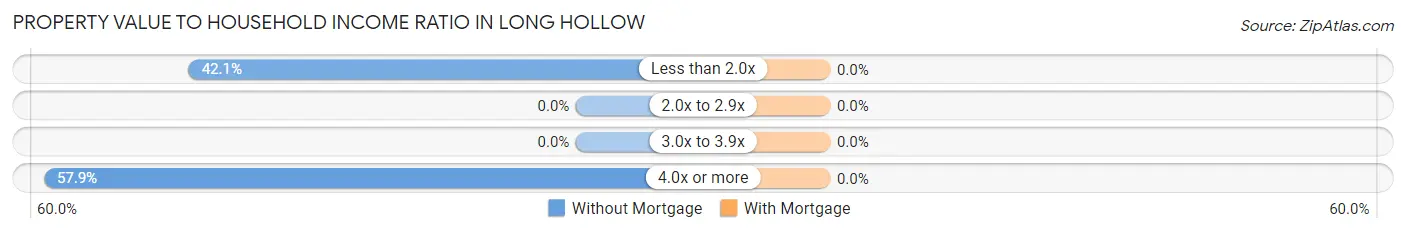
| Value-to-Income Ratio | Without Mortgage | With Mortgage |
| Less than 2.0x | 8 (42.1%) | 0 (0.0%) |
| 2.0x to 2.9x | 0 (0.0%) | 0 (0.0%) |
| 3.0x to 3.9x | 0 (0.0%) | 0 (0.0%) |
| 4.0x or more | 11 (57.9%) | 0 (0.0%) |
| Total | 19 (100.0%) | 0 (0.0%) |
Real Estate Taxes by Mortgage Status in Long Hollow
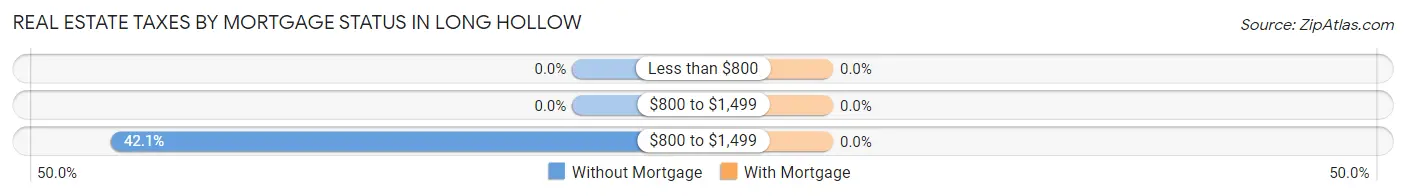
| Property Taxes | Without Mortgage | With Mortgage |
| Less than $800 | 0 (0.0%) | 0 (0.0%) |
| $800 to $1,499 | 0 (0.0%) | 0 (0.0%) |
| $800 to $1,499 | 8 (42.1%) | 0 (0.0%) |
| Total | 19 (100.0%) | 0 (0.0%) |
Health & Disability in Long Hollow
Health Insurance Coverage by Age in Long Hollow
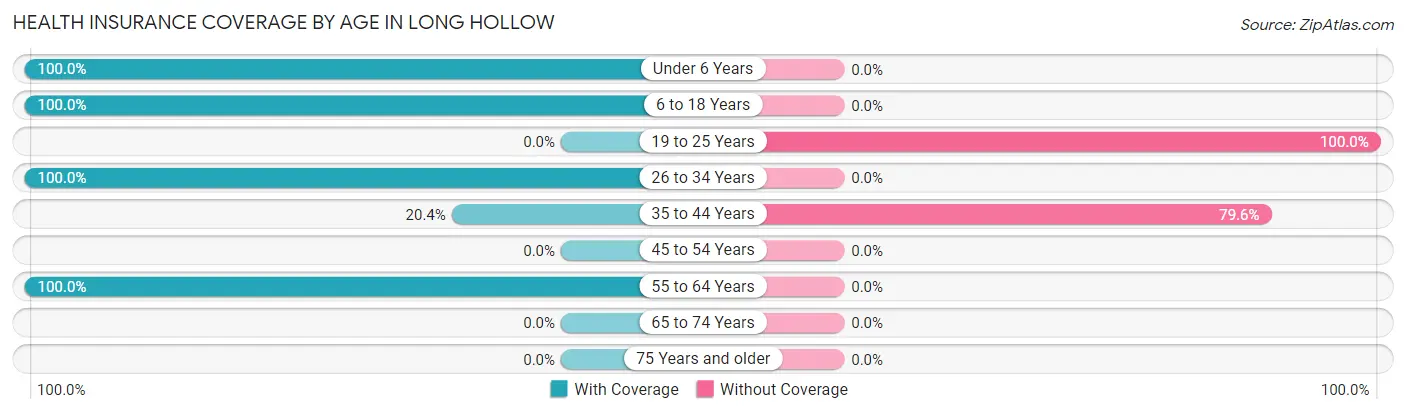
| Age Bracket | With Coverage | Without Coverage |
| Under 6 Years | 130 (100.0%) | 0 (0.0%) |
| 6 to 18 Years | 122 (100.0%) | 0 (0.0%) |
| 19 to 25 Years | 0 (0.0%) | 41 (100.0%) |
| 26 to 34 Years | 9 (100.0%) | 0 (0.0%) |
| 35 to 44 Years | 11 (20.4%) | 43 (79.6%) |
| 45 to 54 Years | 0 (0.0%) | 0 (0.0%) |
| 55 to 64 Years | 8 (100.0%) | 0 (0.0%) |
| 65 to 74 Years | 0 (0.0%) | 0 (0.0%) |
| 75 Years and older | 0 (0.0%) | 0 (0.0%) |
| Total | 280 (76.9%) | 84 (23.1%) |
Health Insurance Coverage by Citizenship Status in Long Hollow
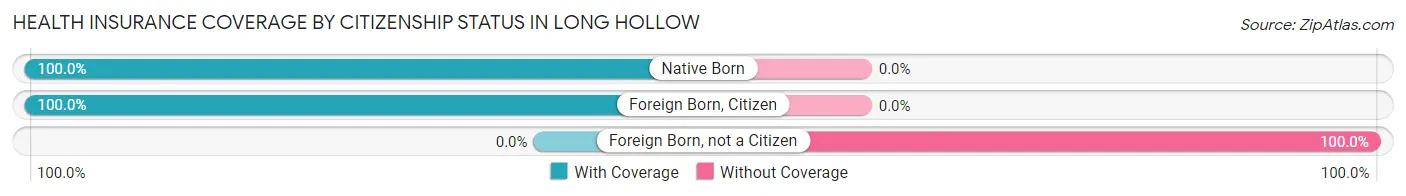
| Citizenship Status | With Coverage | Without Coverage |
| Native Born | 130 (100.0%) | 0 (0.0%) |
| Foreign Born, Citizen | 122 (100.0%) | 0 (0.0%) |
| Foreign Born, not a Citizen | 0 (0.0%) | 41 (100.0%) |
Health Insurance Coverage by Household Income in Long Hollow
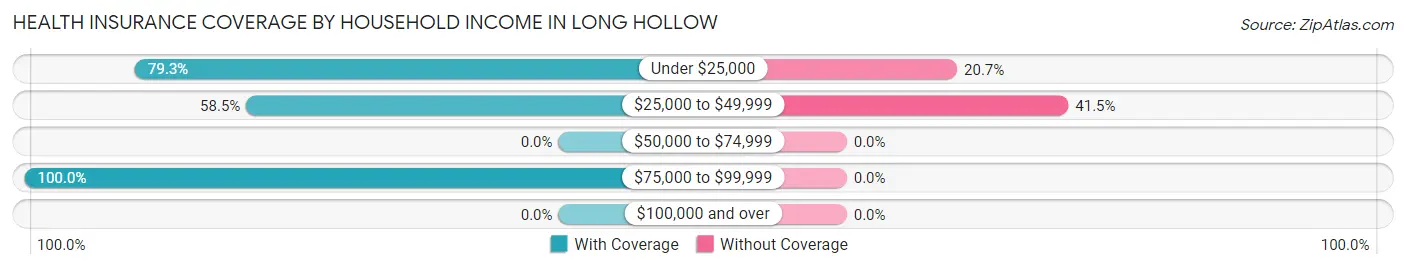
| Household Income | With Coverage | Without Coverage |
| Under $25,000 | 238 (79.3%) | 62 (20.7%) |
| $25,000 to $49,999 | 31 (58.5%) | 22 (41.5%) |
| $50,000 to $74,999 | 0 (0.0%) | 0 (0.0%) |
| $75,000 to $99,999 | 11 (100.0%) | 0 (0.0%) |
| $100,000 and over | 0 (0.0%) | 0 (0.0%) |
Public vs Private Health Insurance Coverage by Age in Long Hollow
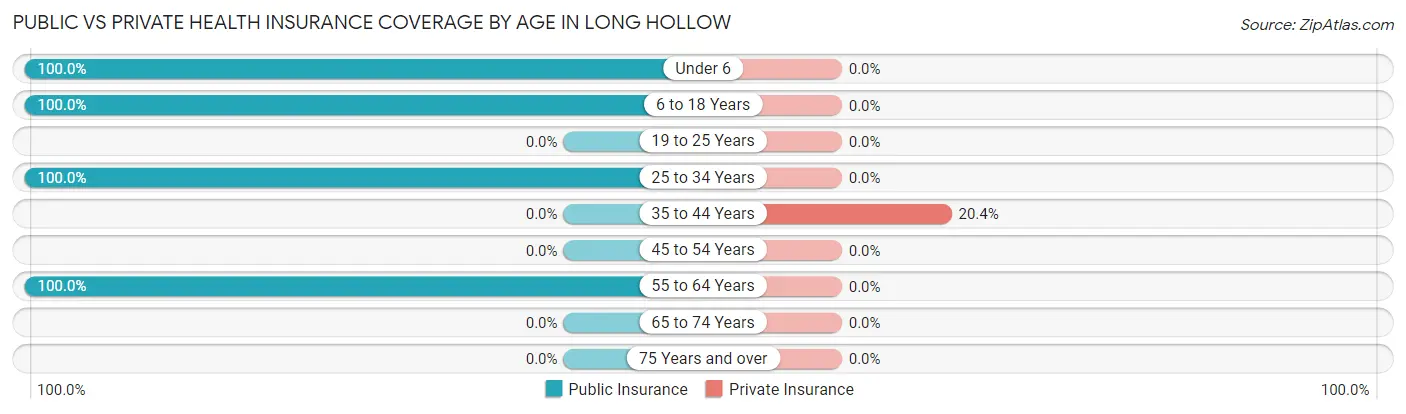
| Age Bracket | Public Insurance | Private Insurance |
| Under 6 | 130 (100.0%) | 0 (0.0%) |
| 6 to 18 Years | 122 (100.0%) | 0 (0.0%) |
| 19 to 25 Years | 0 (0.0%) | 0 (0.0%) |
| 25 to 34 Years | 9 (100.0%) | 0 (0.0%) |
| 35 to 44 Years | 0 (0.0%) | 11 (20.4%) |
| 45 to 54 Years | 0 (0.0%) | 0 (0.0%) |
| 55 to 64 Years | 8 (100.0%) | 0 (0.0%) |
| 65 to 74 Years | 0 (0.0%) | 0 (0.0%) |
| 75 Years and over | 0 (0.0%) | 0 (0.0%) |
| Total | 269 (73.9%) | 11 (3.0%) |
Disability Status by Sex by Age in Long Hollow
| Age Bracket | Male | Female |
| Under 5 Years | 0 (0.0%) | 0 (0.0%) |
| 5 to 17 Years | 0 (0.0%) | 0 (0.0%) |
| 18 to 34 Years | 0 (0.0%) | 0 (0.0%) |
| 35 to 64 Years | 0 (0.0%) | 0 (0.0%) |
| 65 to 74 Years | 0 (0.0%) | 0 (0.0%) |
| 75 Years and over | 0 (0.0%) | 0 (0.0%) |
Disability Class by Sex by Age in Long Hollow
Disability Class: Hearing Difficulty
| Age Bracket | Male | Female |
| Under 5 Years | 0 (0.0%) | 0 (0.0%) |
| 5 to 17 Years | 0 (0.0%) | 0 (0.0%) |
| 18 to 34 Years | 0 (0.0%) | 0 (0.0%) |
| 35 to 64 Years | 0 (0.0%) | 0 (0.0%) |
| 65 to 74 Years | 0 (0.0%) | 0 (0.0%) |
| 75 Years and over | 0 (0.0%) | 0 (0.0%) |
Disability Class: Vision Difficulty
| Age Bracket | Male | Female |
| Under 5 Years | 0 (0.0%) | 0 (0.0%) |
| 5 to 17 Years | 0 (0.0%) | 0 (0.0%) |
| 18 to 34 Years | 0 (0.0%) | 0 (0.0%) |
| 35 to 64 Years | 0 (0.0%) | 0 (0.0%) |
| 65 to 74 Years | 0 (0.0%) | 0 (0.0%) |
| 75 Years and over | 0 (0.0%) | 0 (0.0%) |
Disability Class: Cognitive Difficulty
| Age Bracket | Male | Female |
| 5 to 17 Years | 0 (0.0%) | 0 (0.0%) |
| 18 to 34 Years | 0 (0.0%) | 0 (0.0%) |
| 35 to 64 Years | 0 (0.0%) | 0 (0.0%) |
| 65 to 74 Years | 0 (0.0%) | 0 (0.0%) |
| 75 Years and over | 0 (0.0%) | 0 (0.0%) |
Disability Class: Ambulatory Difficulty
| Age Bracket | Male | Female |
| 5 to 17 Years | 0 (0.0%) | 0 (0.0%) |
| 18 to 34 Years | 0 (0.0%) | 0 (0.0%) |
| 35 to 64 Years | 0 (0.0%) | 0 (0.0%) |
| 65 to 74 Years | 0 (0.0%) | 0 (0.0%) |
| 75 Years and over | 0 (0.0%) | 0 (0.0%) |
Disability Class: Self-Care Difficulty
| Age Bracket | Male | Female |
| 5 to 17 Years | 0 (0.0%) | 0 (0.0%) |
| 18 to 34 Years | 0 (0.0%) | 0 (0.0%) |
| 35 to 64 Years | 0 (0.0%) | 0 (0.0%) |
| 65 to 74 Years | 0 (0.0%) | 0 (0.0%) |
| 75 Years and over | 0 (0.0%) | 0 (0.0%) |
Technology Access in Long Hollow
Computing Device Access in Long Hollow
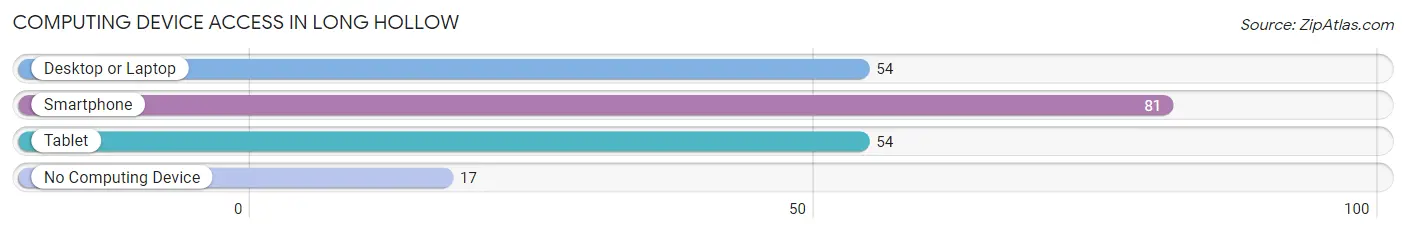
| Device Type | # Households | % Households |
| Desktop or Laptop | 54 | 55.1% |
| Smartphone | 81 | 82.7% |
| Tablet | 54 | 55.1% |
| No Computing Device | 17 | 17.3% |
| Total | 98 | 100.0% |
Internet Access in Long Hollow
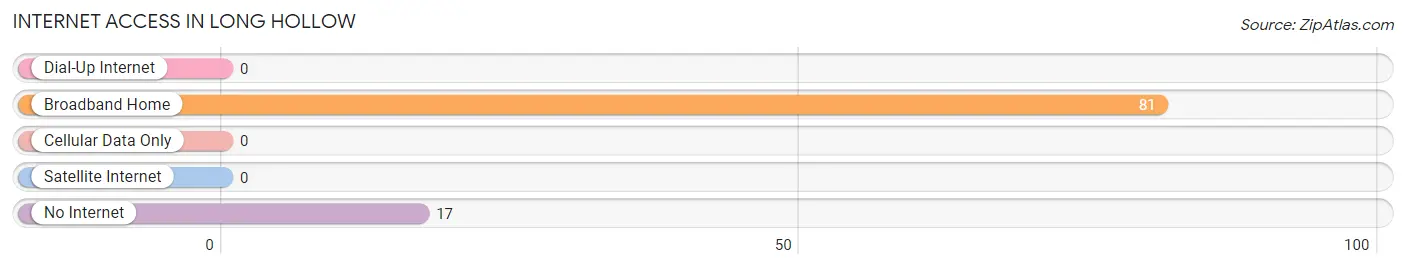
| Internet Type | # Households | % Households |
| Dial-Up Internet | 0 | 0.0% |
| Broadband Home | 81 | 82.7% |
| Cellular Data Only | 0 | 0.0% |
| Satellite Internet | 0 | 0.0% |
| No Internet | 17 | 17.3% |
| Total | 98 | 100.0% |
Long Hollow Summary
History
Long Hollow is a small unincorporated community located in the southeastern corner of South Dakota, in the United States. It is situated in the extreme southeastern corner of the state, near the border with Nebraska. The town was founded in the late 19th century and has a population of approximately 200 people.
Long Hollow was first settled in the late 1800s by a group of settlers from Nebraska. The settlers were looking for a place to settle and start a new life. They chose Long Hollow because of its proximity to the Missouri River and its abundance of natural resources. The settlers built a small community and began to farm the land.
The town was named after the long, narrow valley that runs through the area. The valley was created by the Missouri River, which flows through the area. The town was officially incorporated in 1891.
Geography
Long Hollow is located in the extreme southeastern corner of South Dakota, near the border with Nebraska. It is situated in the Missouri River Valley, which is a long, narrow valley created by the Missouri River. The town is located on the western edge of the valley, and is surrounded by rolling hills and prairies.
The town is located at an elevation of 1,890 feet (576 meters) above sea level. The climate in Long Hollow is generally mild, with hot summers and cold winters. The average annual temperature is around 50°F (10°C).
Economy
The economy of Long Hollow is largely based on agriculture. The town is home to several farms, which produce a variety of crops, including corn, soybeans, wheat, and hay. The town also has a small manufacturing sector, which produces a variety of products, including furniture, clothing, and food products.
The town also has a small tourism industry, which is centered around the nearby Missouri River. The river provides a variety of recreational activities, such as fishing, boating, and camping.
Demographics
As of the 2010 census, the population of Long Hollow was 200 people. The racial makeup of the town was 97.5% White, 0.5% African American, 0.5% Native American, and 1.5% from other races. The median household income was $37,500, and the median family income was $41,250.
Conclusion
Long Hollow is a small unincorporated community located in the extreme southeastern corner of South Dakota. It was founded in the late 19th century and has a population of approximately 200 people. The town is situated in the Missouri River Valley and is surrounded by rolling hills and prairies. The economy of Long Hollow is largely based on agriculture, with a small manufacturing sector and a small tourism industry. The population of Long Hollow is predominantly White, with a small percentage of African American, Native American, and other races.
Common Questions
What is the Total Population of Long Hollow?
Total Population of Long Hollow is 364.
What is the Total Male Population of Long Hollow?
Total Male Population of Long Hollow is 64.
What is the Total Female Population of Long Hollow?
Total Female Population of Long Hollow is 300.
What is the Ratio of Males per 100 Females in Long Hollow?
There are 21.33 Males per 100 Females in Long Hollow.
What is the Ratio of Females per 100 Males in Long Hollow?
There are 468.75 Females per 100 Males in Long Hollow.
What is the Median Population Age in Long Hollow?
Median Population Age in Long Hollow is 7.2 Years.
What is the Average Family Size in Long Hollow
Average Family Size in Long Hollow is 4.2 People.
What is the Average Household Size in Long Hollow
Average Household Size in Long Hollow is 3.7 People.
What is Per Capita Income in Long Hollow?
Per Capita income in Long Hollow is $5,196.
What is the Median Family Income in Long Hollow?
Median Family Income in Long Hollow is $8,169.
What is the Median Household income in Long Hollow?
Median Household Income in Long Hollow is $8,721.
What is Family Income Deficit in Long Hollow?
Family Income Deficit in Long Hollow is $22,670.
Families that are below poverty line in Long Hollow earn $22,670 less on average than the poverty threshold level.
What is Inequality or Gini Index in Long Hollow?
Inequality or Gini Index in Long Hollow is 0.61.
How Large is the Labor Force in Long Hollow?
There are 93 People in the Labor Forcein in Long Hollow.
What is the Percentage of People in the Labor Force in Long Hollow?
66.0% of People are in the Labor Force in Long Hollow.
What is the Unemployment Rate in Long Hollow?
Unemployment Rate in Long Hollow is 9.7%.