Zip Codes with the Highest Percentage of Households with Income Below $10,000 in South Dakota
RELATED REPORTS & OPTIONS
Household Income | $0-10k
South Dakota
Compare Zip Codes
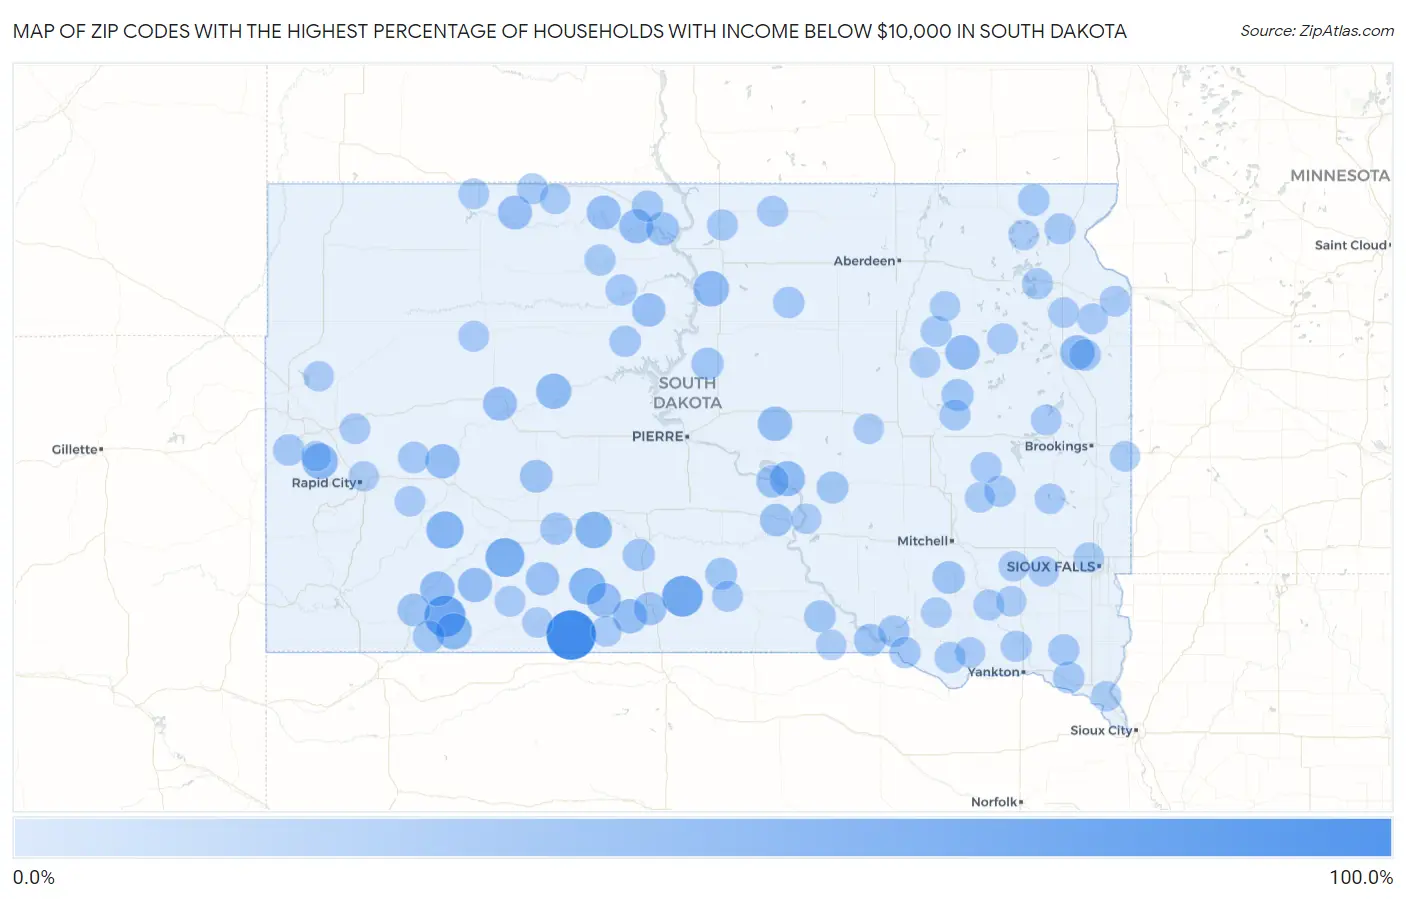
Map of Zip Codes with the Highest Percentage of Households with Income Below $10,000 in South Dakota
0.0%
100.0%
Zip Codes with the Highest Percentage of Households with Income Below $10,000 in South Dakota
| Zip Code | Households with Income < $10k | vs State | vs National | |
| 1. | 57574 | 88.7% | 4.2%(+84.5)#1 | 4.9%(+83.8)#39 |
| 2. | 57756 | 51.6% | 4.2%(+47.4)#2 | 4.9%(+46.7)#106 |
| 3. | 57563 | 50.0% | 4.2%(+45.8)#3 | 4.9%(+45.1)#115 |
| 4. | 57750 | 42.9% | 4.2%(+38.7)#4 | 4.9%(+38.0)#153 |
| 5. | 57780 | 34.7% | 4.2%(+30.5)#5 | 4.9%(+29.8)#225 |
| 6. | 57560 | 32.9% | 4.2%(+28.7)#6 | 4.9%(+28.0)#271 |
| 7. | 57521 | 32.2% | 4.2%(+28.0)#7 | 4.9%(+27.3)#285 |
| 8. | 57794 | 30.4% | 4.2%(+26.2)#8 | 4.9%(+25.5)#320 |
| 9. | 57759 | 28.3% | 4.2%(+24.1)#9 | 4.9%(+23.4)#365 |
| 10. | 57420 | 27.7% | 4.2%(+23.5)#10 | 4.9%(+22.8)#382 |
| 11. | 57622 | 26.3% | 4.2%(+22.1)#11 | 4.9%(+21.4)#427 |
| 12. | 57339 | 25.3% | 4.2%(+21.1)#12 | 4.9%(+20.4)#474 |
| 13. | 57772 | 24.0% | 4.2%(+19.8)#13 | 4.9%(+19.1)#531 |
| 14. | 57258 | 23.5% | 4.2%(+19.3)#14 | 4.9%(+18.6)#558 |
| 15. | 57245 | 23.5% | 4.2%(+19.3)#15 | 4.9%(+18.6)#560 |
| 16. | 57540 | 22.9% | 4.2%(+18.7)#16 | 4.9%(+18.0)#598 |
| 17. | 57570 | 22.5% | 4.2%(+18.3)#17 | 4.9%(+17.6)#610 |
| 18. | 57752 | 22.2% | 4.2%(+18.0)#18 | 4.9%(+17.3)#622 |
| 19. | 57791 | 22.2% | 4.2%(+18.0)#19 | 4.9%(+17.3)#627 |
| 20. | 57566 | 21.9% | 4.2%(+17.7)#20 | 4.9%(+17.0)#644 |
| 21. | 57639 | 21.6% | 4.2%(+17.4)#21 | 4.9%(+16.7)#661 |
| 22. | 57621 | 21.2% | 4.2%(+17.0)#22 | 4.9%(+16.3)#694 |
| 23. | 57634 | 21.2% | 4.2%(+17.0)#23 | 4.9%(+16.3)#697 |
| 24. | 57748 | 20.3% | 4.2%(+16.1)#24 | 4.9%(+15.4)#778 |
| 25. | 57577 | 18.9% | 4.2%(+14.7)#25 | 4.9%(+14.0)#908 |
| 26. | 57652 | 18.7% | 4.2%(+14.5)#26 | 4.9%(+13.8)#931 |
| 27. | 57658 | 17.7% | 4.2%(+13.5)#27 | 4.9%(+12.8)#1,063 |
| 28. | 57555 | 16.2% | 4.2%(+12.0)#28 | 4.9%(+11.3)#1,297 |
| 29. | 57567 | 16.2% | 4.2%(+12.0)#29 | 4.9%(+11.3)#1,305 |
| 30. | 57764 | 15.6% | 4.2%(+11.4)#30 | 4.9%(+10.7)#1,415 |
| 31. | 57548 | 15.4% | 4.2%(+11.2)#31 | 4.9%(+10.5)#1,443 |
| 32. | 57331 | 15.2% | 4.2%(+11.0)#32 | 4.9%(+10.3)#1,494 |
| 33. | 57569 | 15.1% | 4.2%(+10.9)#33 | 4.9%(+10.2)#1,510 |
| 34. | 57579 | 13.5% | 4.2%(+9.30)#34 | 4.9%(+8.60)#1,931 |
| 35. | 57520 | 13.5% | 4.2%(+9.30)#35 | 4.9%(+8.60)#1,940 |
| 36. | 57335 | 13.4% | 4.2%(+9.20)#36 | 4.9%(+8.50)#1,971 |
| 37. | 57543 | 13.3% | 4.2%(+9.10)#37 | 4.9%(+8.40)#1,990 |
| 38. | 57322 | 12.5% | 4.2%(+8.30)#38 | 4.9%(+7.60)#2,274 |
| 39. | 57341 | 12.5% | 4.2%(+8.30)#39 | 4.9%(+7.60)#2,280 |
| 40. | 57584 | 12.5% | 4.2%(+8.30)#40 | 4.9%(+7.60)#2,285 |
| 41. | 57770 | 11.6% | 4.2%(+7.40)#41 | 4.9%(+6.70)#2,638 |
| 42. | 57523 | 11.6% | 4.2%(+7.40)#42 | 4.9%(+6.70)#2,652 |
| 43. | 57270 | 11.3% | 4.2%(+7.10)#43 | 4.9%(+6.40)#2,814 |
| 44. | 57238 | 11.2% | 4.2%(+7.00)#44 | 4.9%(+6.30)#2,877 |
| 45. | 57356 | 10.9% | 4.2%(+6.70)#45 | 4.9%(+6.00)#3,026 |
| 46. | 57069 | 10.8% | 4.2%(+6.60)#46 | 4.9%(+5.90)#3,073 |
| 47. | 57761 | 10.7% | 4.2%(+6.50)#47 | 4.9%(+5.80)#3,150 |
| 48. | 57754 | 10.3% | 4.2%(+6.10)#48 | 4.9%(+5.40)#3,383 |
| 49. | 57642 | 10.2% | 4.2%(+6.00)#49 | 4.9%(+5.30)#3,463 |
| 50. | 57073 | 10.2% | 4.2%(+6.00)#50 | 4.9%(+5.30)#3,480 |
| 51. | 57661 | 10.2% | 4.2%(+6.00)#51 | 4.9%(+5.30)#3,488 |
| 52. | 57361 | 10.0% | 4.2%(+5.80)#52 | 4.9%(+5.10)#3,630 |
| 53. | 57625 | 9.9% | 4.2%(+5.70)#53 | 4.9%(+5.00)#3,669 |
| 54. | 57466 | 9.9% | 4.2%(+5.70)#54 | 4.9%(+5.00)#3,704 |
| 55. | 57349 | 9.8% | 4.2%(+5.60)#55 | 4.9%(+4.90)#3,769 |
| 56. | 57656 | 9.8% | 4.2%(+5.60)#56 | 4.9%(+4.90)#3,777 |
| 57. | 57477 | 9.1% | 4.2%(+4.90)#57 | 4.9%(+4.20)#4,387 |
| 58. | 57067 | 8.8% | 4.2%(+4.60)#58 | 4.9%(+3.90)#4,706 |
| 59. | 57262 | 8.5% | 4.2%(+4.30)#59 | 4.9%(+3.60)#4,954 |
| 60. | 57580 | 8.4% | 4.2%(+4.20)#60 | 4.9%(+3.50)#5,069 |
| 61. | 57273 | 8.4% | 4.2%(+4.20)#61 | 4.9%(+3.50)#5,114 |
| 62. | 57386 | 8.4% | 4.2%(+4.20)#62 | 4.9%(+3.50)#5,141 |
| 63. | 57646 | 8.3% | 4.2%(+4.10)#63 | 4.9%(+3.40)#5,275 |
| 64. | 57437 | 8.2% | 4.2%(+4.00)#64 | 4.9%(+3.30)#5,364 |
| 65. | 57315 | 8.2% | 4.2%(+4.00)#65 | 4.9%(+3.30)#5,371 |
| 66. | 57645 | 8.2% | 4.2%(+4.00)#66 | 4.9%(+3.30)#5,403 |
| 67. | 57052 | 8.1% | 4.2%(+3.90)#67 | 4.9%(+3.20)#5,528 |
| 68. | 57323 | 8.1% | 4.2%(+3.90)#68 | 4.9%(+3.20)#5,532 |
| 69. | 57714 | 7.9% | 4.2%(+3.70)#69 | 4.9%(+3.00)#5,761 |
| 70. | 57626 | 7.9% | 4.2%(+3.70)#70 | 4.9%(+3.00)#5,772 |
| 71. | 57236 | 7.5% | 4.2%(+3.30)#71 | 4.9%(+2.60)#6,328 |
| 72. | 57264 | 7.3% | 4.2%(+3.10)#72 | 4.9%(+2.40)#6,601 |
| 73. | 57214 | 7.3% | 4.2%(+3.10)#73 | 4.9%(+2.40)#6,605 |
| 74. | 57660 | 7.3% | 4.2%(+3.10)#74 | 4.9%(+2.40)#6,608 |
| 75. | 57252 | 7.2% | 4.2%(+3.00)#75 | 4.9%(+2.30)#6,696 |
| 76. | 57572 | 7.2% | 4.2%(+3.00)#76 | 4.9%(+2.30)#6,732 |
| 77. | 57785 | 7.0% | 4.2%(+2.80)#77 | 4.9%(+2.10)#7,001 |
| 78. | 57047 | 7.0% | 4.2%(+2.80)#78 | 4.9%(+2.10)#7,084 |
| 79. | 57638 | 6.8% | 4.2%(+2.60)#79 | 4.9%(+1.90)#7,446 |
| 80. | 57066 | 6.7% | 4.2%(+2.50)#80 | 4.9%(+1.80)#7,653 |
| 81. | 57725 | 6.7% | 4.2%(+2.50)#81 | 4.9%(+1.80)#7,681 |
| 82. | 57042 | 6.6% | 4.2%(+2.40)#82 | 4.9%(+1.70)#7,771 |
| 83. | 57551 | 6.6% | 4.2%(+2.40)#83 | 4.9%(+1.70)#7,827 |
| 84. | 57263 | 6.6% | 4.2%(+2.40)#84 | 4.9%(+1.70)#7,869 |
| 85. | 57440 | 6.5% | 4.2%(+2.30)#85 | 4.9%(+1.60)#8,063 |
| 86. | 57026 | 6.3% | 4.2%(+2.10)#86 | 4.9%(+1.40)#8,440 |
| 87. | 57232 | 6.3% | 4.2%(+2.10)#87 | 4.9%(+1.40)#8,481 |
| 88. | 57571 | 6.3% | 4.2%(+2.10)#88 | 4.9%(+1.40)#8,504 |
| 89. | 57732 | 6.2% | 4.2%(+2.00)#89 | 4.9%(+1.30)#8,653 |
| 90. | 57330 | 6.2% | 4.2%(+2.00)#90 | 4.9%(+1.30)#8,699 |
| 91. | 57029 | 6.1% | 4.2%(+1.90)#91 | 4.9%(+1.20)#8,874 |
| 92. | 57025 | 6.0% | 4.2%(+1.80)#92 | 4.9%(+1.10)#9,091 |
| 93. | 57762 | 6.0% | 4.2%(+1.80)#93 | 4.9%(+1.10)#9,163 |
| 94. | 57325 | 5.9% | 4.2%(+1.70)#94 | 4.9%(+1.00)#9,329 |
| 95. | 57434 | 5.9% | 4.2%(+1.70)#95 | 4.9%(+1.00)#9,407 |
| 96. | 57337 | 5.9% | 4.2%(+1.70)#96 | 4.9%(+1.00)#9,429 |
| 97. | 57701 | 5.8% | 4.2%(+1.60)#97 | 4.9%(+0.900)#9,446 |
| 98. | 57107 | 5.8% | 4.2%(+1.60)#98 | 4.9%(+0.900)#9,539 |
| 99. | 57381 | 5.8% | 4.2%(+1.60)#99 | 4.9%(+0.900)#9,664 |
| 100. | 57319 | 5.7% | 4.2%(+1.50)#100 | 4.9%(+0.800)#9,914 |
Common Questions
What are the Top 10 Zip Codes with the Highest Percentage of Households with Income Below $10,000 in South Dakota?
Top 10 Zip Codes with the Highest Percentage of Households with Income Below $10,000 in South Dakota are:
What zip code has the Highest Percentage of Households with Income Below $10,000 in South Dakota?
57574 has the Highest Percentage of Households with Income Below $10,000 in South Dakota with 88.7%.
What is the Percentage of Households with Income Below $10,000 in the State of South Dakota?
Percentage of Households with Income Below $10,000 in South Dakota is 4.2%.
What is the Percentage of Households with Income Below $10,000 in the United States?
Percentage of Households with Income Below $10,000 in the United States is 4.9%.