Lower Brule, SD
Lower Brule Map
Lower Brule Overview
892
TOTAL POPULATION
470
MALE POPULATION
422
FEMALE POPULATION
111.37
MALES / 100 FEMALES
89.79
FEMALES / 100 MALES
25.7
MEDIAN AGE
5.0
AVG FAMILY SIZE
4.1
AVG HOUSEHOLD SIZE
$12,035
PER CAPITA INCOME
$30,500
AVG FAMILY INCOME
$29,375
AVG HOUSEHOLD INCOME
31.6%
WAGE / INCOME GAP [ % ]
68.4¢/ $1
WAGE / INCOME GAP [ $ ]
0.46
INEQUALITY / GINI INDEX
270
LABOR FORCE [ PEOPLE ]
46.5%
PERCENT IN LABOR FORCE
8.9%
UNEMPLOYMENT RATE
Lower Brule Zip Codes
Lower Brule Area Codes
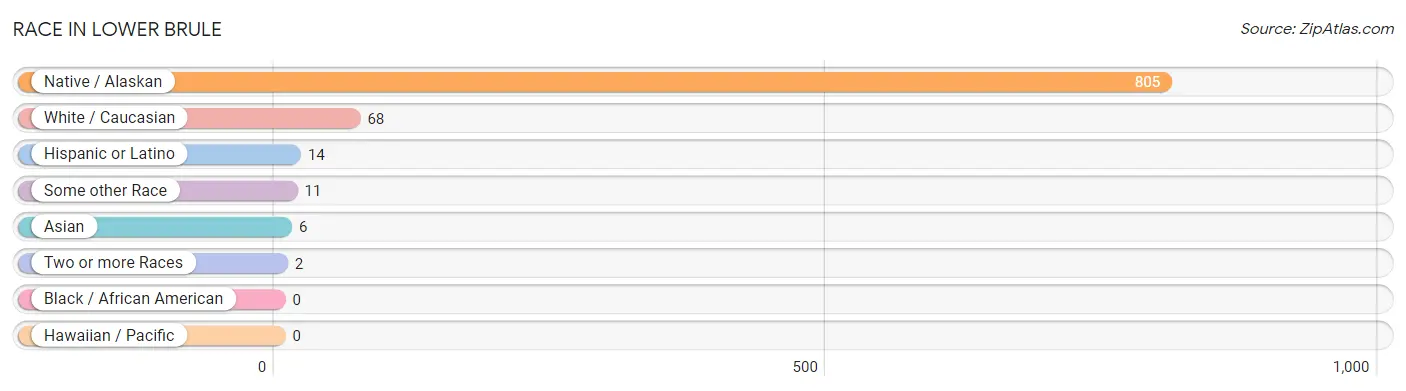
Race in Lower Brule
The most populous races in Lower Brule are Native / Alaskan (805 | 90.2%), White / Caucasian (68 | 7.6%), and Hispanic or Latino (14 | 1.6%).
| Race | # Population | % Population |
| Asian | 6 | 0.7% |
| Black / African American | 0 | 0.0% |
| Hawaiian / Pacific | 0 | 0.0% |
| Hispanic or Latino | 14 | 1.6% |
| Native / Alaskan | 805 | 90.2% |
| White / Caucasian | 68 | 7.6% |
| Two or more Races | 2 | 0.2% |
| Some other Race | 11 | 1.2% |
| Total | 892 | 100.0% |
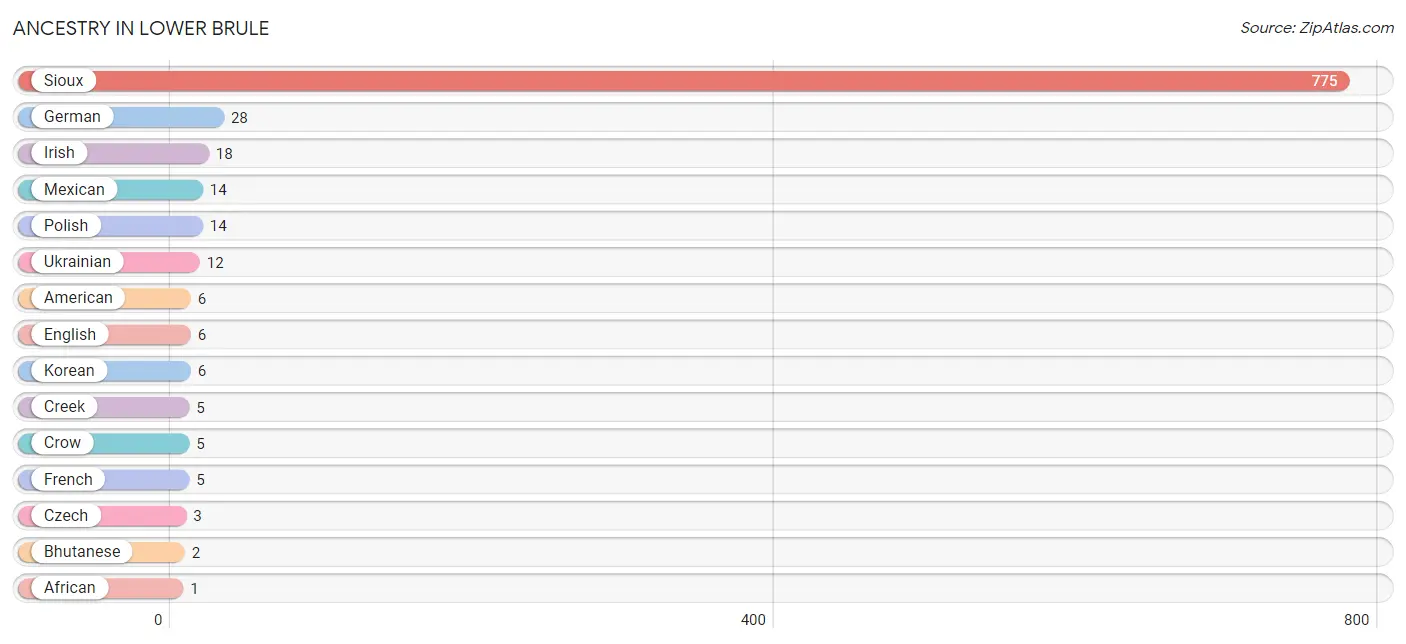
Ancestry in Lower Brule
The most populous ancestries reported in Lower Brule are Sioux (775 | 86.9%), German (28 | 3.1%), Irish (18 | 2.0%), Mexican (14 | 1.6%), and Polish (14 | 1.6%), together accounting for 95.2% of all Lower Brule residents.
| Ancestry | # Population | % Population |
| African | 1 | 0.1% |
| American | 6 | 0.7% |
| Bhutanese | 2 | 0.2% |
| Creek | 5 | 0.6% |
| Crow | 5 | 0.6% |
| Czech | 3 | 0.3% |
| English | 6 | 0.7% |
| French | 5 | 0.6% |
| German | 28 | 3.1% |
| Irish | 18 | 2.0% |
| Korean | 6 | 0.7% |
| Mexican | 14 | 1.6% |
| Polish | 14 | 1.6% |
| Sioux | 775 | 86.9% |
| Subsaharan African | 1 | 0.1% |
| Ukrainian | 12 | 1.3% | View All 16 Rows |
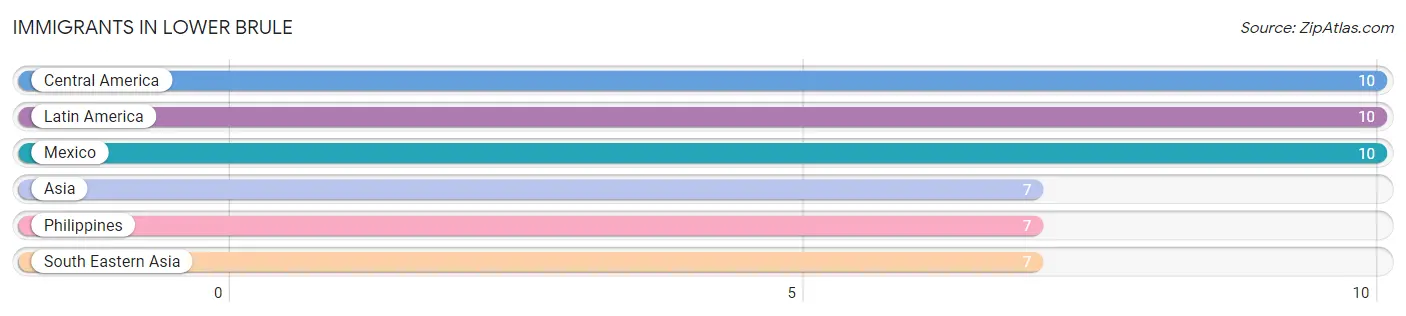
Immigrants in Lower Brule
The most numerous immigrant groups reported in Lower Brule came from Central America (10 | 1.1%), Latin America (10 | 1.1%), Mexico (10 | 1.1%), Asia (7 | 0.8%), and Philippines (7 | 0.8%), together accounting for 4.9% of all Lower Brule residents.
| Immigration Origin | # Population | % Population |
| Asia | 7 | 0.8% |
| Central America | 10 | 1.1% |
| Latin America | 10 | 1.1% |
| Mexico | 10 | 1.1% |
| Philippines | 7 | 0.8% |
| South Eastern Asia | 7 | 0.8% | View All 6 Rows |
Sex and Age in Lower Brule
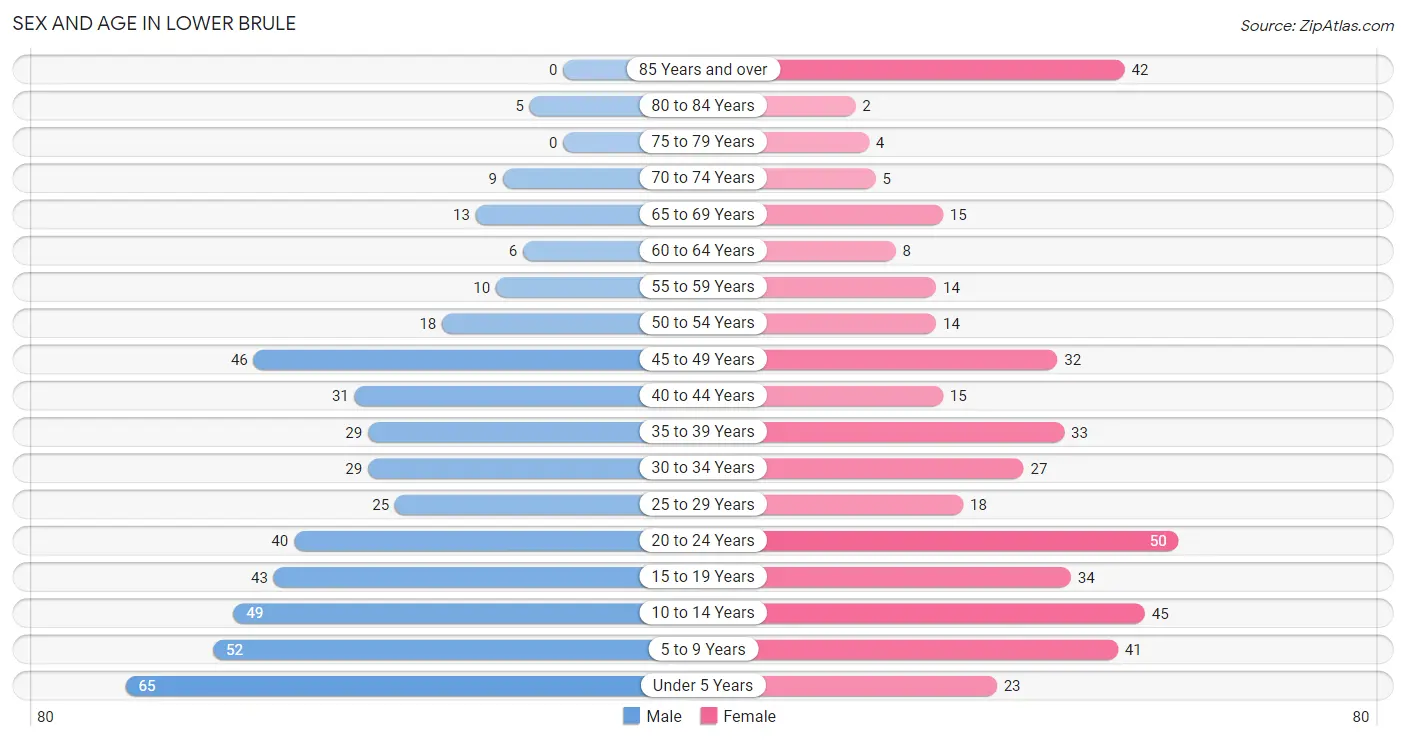
Sex and Age in Lower Brule
The most populous age groups in Lower Brule are Under 5 Years (65 | 13.8%) for men and 20 to 24 Years (50 | 11.8%) for women.
| Age Bracket | Male | Female |
| Under 5 Years | 65 (13.8%) | 23 (5.4%) |
| 5 to 9 Years | 52 (11.1%) | 41 (9.7%) |
| 10 to 14 Years | 49 (10.4%) | 45 (10.7%) |
| 15 to 19 Years | 43 (9.1%) | 34 (8.1%) |
| 20 to 24 Years | 40 (8.5%) | 50 (11.8%) |
| 25 to 29 Years | 25 (5.3%) | 18 (4.3%) |
| 30 to 34 Years | 29 (6.2%) | 27 (6.4%) |
| 35 to 39 Years | 29 (6.2%) | 33 (7.8%) |
| 40 to 44 Years | 31 (6.6%) | 15 (3.5%) |
| 45 to 49 Years | 46 (9.8%) | 32 (7.6%) |
| 50 to 54 Years | 18 (3.8%) | 14 (3.3%) |
| 55 to 59 Years | 10 (2.1%) | 14 (3.3%) |
| 60 to 64 Years | 6 (1.3%) | 8 (1.9%) |
| 65 to 69 Years | 13 (2.8%) | 15 (3.5%) |
| 70 to 74 Years | 9 (1.9%) | 5 (1.2%) |
| 75 to 79 Years | 0 (0.0%) | 4 (0.9%) |
| 80 to 84 Years | 5 (1.1%) | 2 (0.5%) |
| 85 Years and over | 0 (0.0%) | 42 (10.0%) |
| Total | 470 (100.0%) | 422 (100.0%) |
Families and Households in Lower Brule
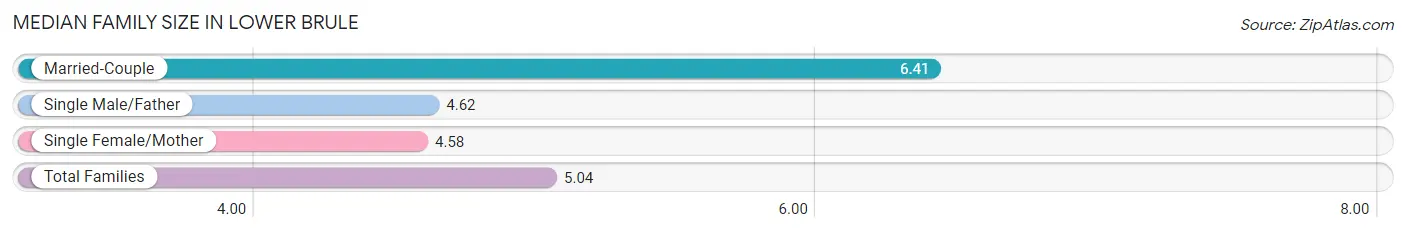
Median Family Size in Lower Brule
The median family size in Lower Brule is 5.04 persons per family, with married-couple families (34 | 24.3%) accounting for the largest median family size of 6.41 persons per family. On the other hand, single female/mother families (59 | 42.1%) represent the smallest median family size with 4.58 persons per family.
| Family Type | # Families | Family Size |
| Married-Couple | 34 (24.3%) | 6.41 |
| Single Male/Father | 47 (33.6%) | 4.62 |
| Single Female/Mother | 59 (42.1%) | 4.58 |
| Total Families | 140 (100.0%) | 5.04 |
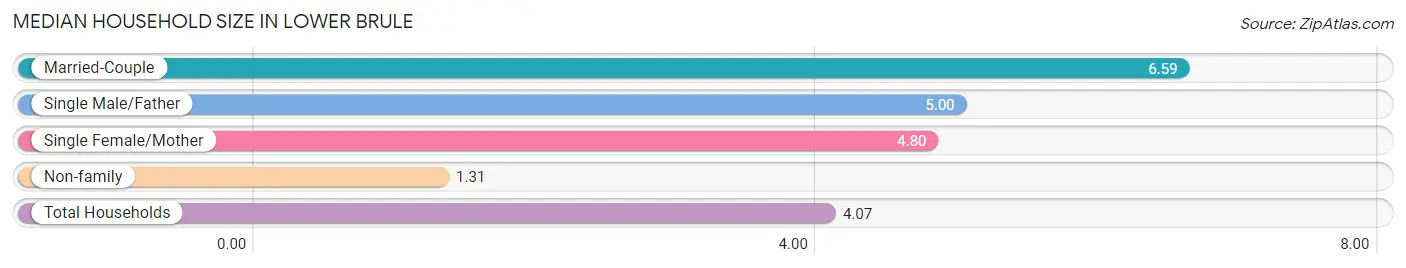
Median Household Size in Lower Brule
The median household size in Lower Brule is 4.07 persons per household, with married-couple households (34 | 16.8%) accounting for the largest median household size of 6.59 persons per household. non-family households (62 | 30.7%) represent the smallest median household size with 1.31 persons per household.
| Household Type | # Households | Household Size |
| Married-Couple | 34 (16.8%) | 6.59 |
| Single Male/Father | 47 (23.3%) | 5.00 |
| Single Female/Mother | 59 (29.2%) | 4.80 |
| Non-family | 62 (30.7%) | 1.31 |
| Total Households | 202 (100.0%) | 4.07 |
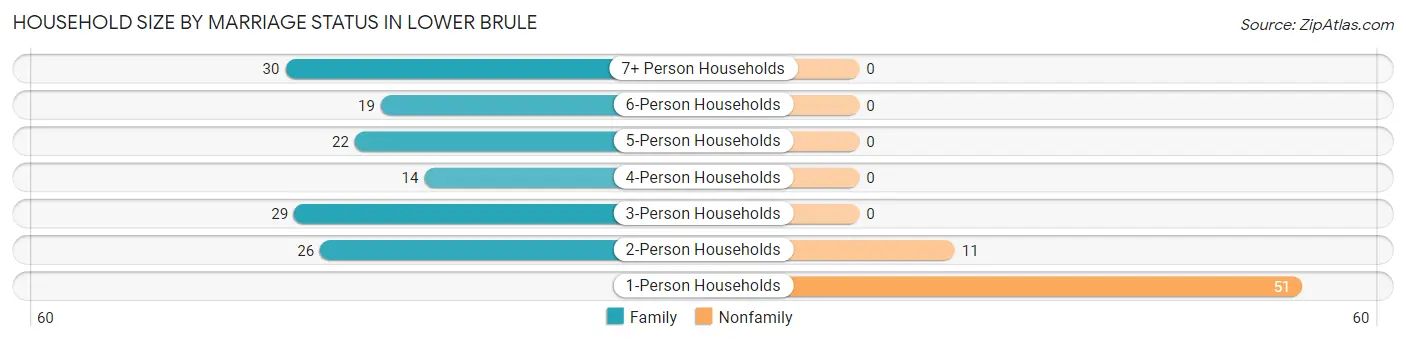
Household Size by Marriage Status in Lower Brule
Out of a total of 202 households in Lower Brule, 140 (69.3%) are family households, while 62 (30.7%) are nonfamily households. The most numerous type of family households are 7+ person households, comprising 30, and the most common type of nonfamily households are 1-person households, comprising 51.
| Household Size | Family Households | Nonfamily Households |
| 1-Person Households | - | 51 (25.3%) |
| 2-Person Households | 26 (12.9%) | 11 (5.4%) |
| 3-Person Households | 29 (14.4%) | 0 (0.0%) |
| 4-Person Households | 14 (6.9%) | 0 (0.0%) |
| 5-Person Households | 22 (10.9%) | 0 (0.0%) |
| 6-Person Households | 19 (9.4%) | 0 (0.0%) |
| 7+ Person Households | 30 (14.8%) | 0 (0.0%) |
| Total | 140 (69.3%) | 62 (30.7%) |
Female Fertility in Lower Brule
Fertility by Age in Lower Brule
Average fertility rate in Lower Brule is 105.0 births per 1,000 women. Women in the age bracket of 20 to 34 years have the highest fertility rate with 137.0 births per 1,000 women. Women in the age bracket of 20 to 34 years acount for 59.1% of all women with births.
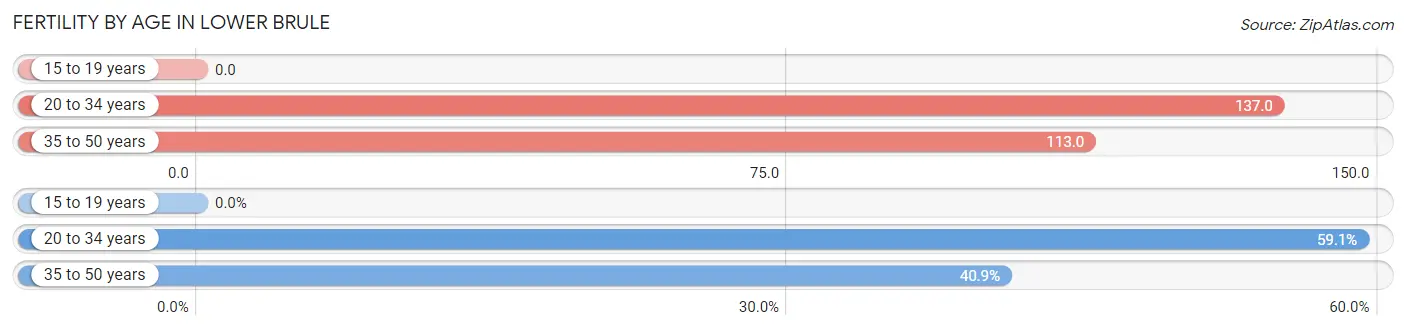
| Age Bracket | Women with Births | Births / 1,000 Women |
| 15 to 19 years | 0 (0.0%) | 0.0 |
| 20 to 34 years | 13 (59.1%) | 137.0 |
| 35 to 50 years | 9 (40.9%) | 113.0 |
| Total | 22 (100.0%) | 105.0 |
Fertility by Age by Marriage Status in Lower Brule
9.1% of women with births (22) in Lower Brule are married. The highest percentage of unmarried women with births falls into 35 to 50 years age bracket with 100.0% of them unmarried at the time of birth, while the lowest percentage of unmarried women with births belong to 20 to 34 years age bracket with 84.6% of them unmarried.
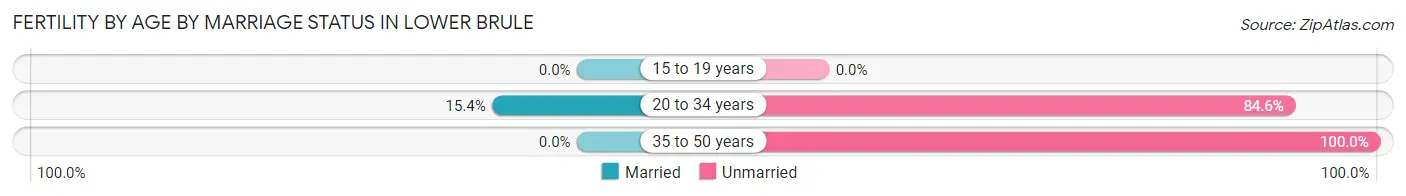
| Age Bracket | Married | Unmarried |
| 15 to 19 years | 0 (0.0%) | 0 (0.0%) |
| 20 to 34 years | 2 (15.4%) | 11 (84.6%) |
| 35 to 50 years | 0 (0.0%) | 9 (100.0%) |
| Total | 2 (9.1%) | 20 (90.9%) |
Fertility by Education in Lower Brule
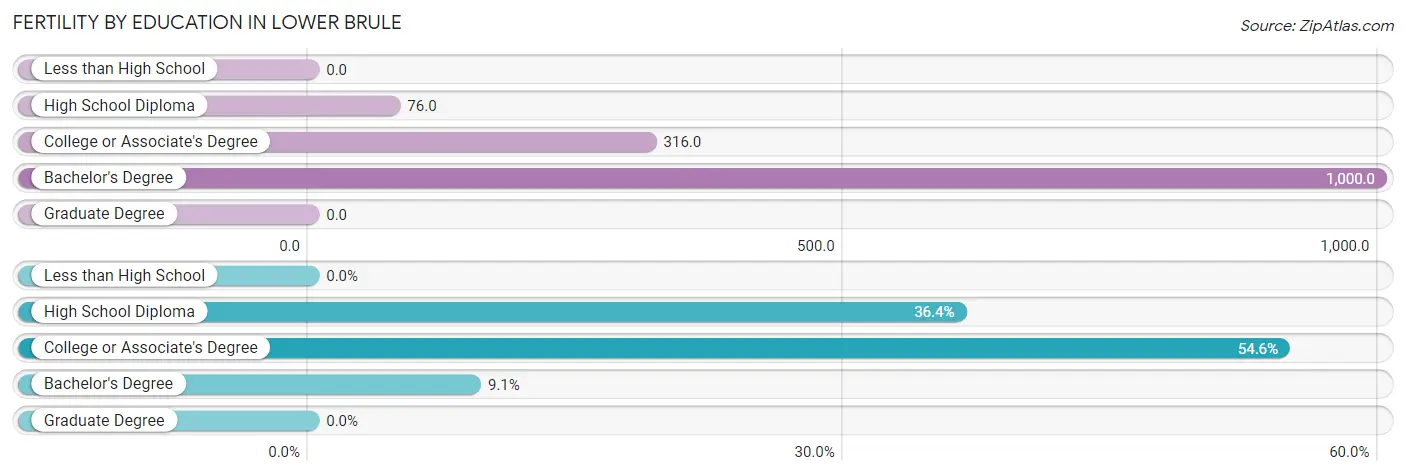
| Educational Attainment | Women with Births | Births / 1,000 Women |
| Less than High School | 0 (0.0%) | 0.0 |
| High School Diploma | 8 (36.4%) | 76.0 |
| College or Associate's Degree | 12 (54.5%) | 316.0 |
| Bachelor's Degree | 2 (9.1%) | 1,000.0 |
| Graduate Degree | 0 (0.0%) | 0.0 |
| Total | 22 (100.0%) | 105.0 |
Fertility by Education by Marriage Status in Lower Brule
90.9% of women with births in Lower Brule are unmarried. Women with the educational attainment of high school diploma are most likely to be married with 25.0% of them married at childbirth, while women with the educational attainment of college or associate's degree are least likely to be married with 100.0% of them unmarried at childbirth.
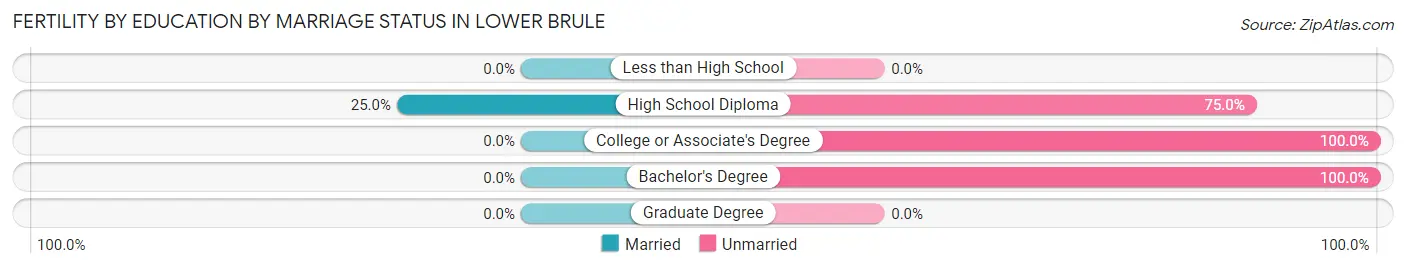
| Educational Attainment | Married | Unmarried |
| Less than High School | 0 (0.0%) | 0 (0.0%) |
| High School Diploma | 2 (25.0%) | 6 (75.0%) |
| College or Associate's Degree | 0 (0.0%) | 12 (100.0%) |
| Bachelor's Degree | 0 (0.0%) | 2 (100.0%) |
| Graduate Degree | 0 (0.0%) | 0 (0.0%) |
| Total | 2 (9.1%) | 20 (90.9%) |
Income in Lower Brule
Income Overview in Lower Brule
Per Capita Income in Lower Brule is $12,035, while median incomes of families and households are $30,500 and $29,375 respectively.
| Characteristic | Number | Measure |
| Per Capita Income | 892 | $12,035 |
| Median Family Income | 140 | $30,500 |
| Mean Family Income | 140 | $39,736 |
| Median Household Income | 202 | $29,375 |
| Mean Household Income | 202 | $40,189 |
| Income Deficit | 140 | $0 |
| Wage / Income Gap (%) | 892 | 31.58% |
| Wage / Income Gap ($) | 892 | 68.42¢ per $1 |
| Gini / Inequality Index | 892 | 0.46 |
Earnings by Sex in Lower Brule
Average Earnings in Lower Brule are $25,000, $31,667 for men and $21,667 for women, a difference of 31.6%.
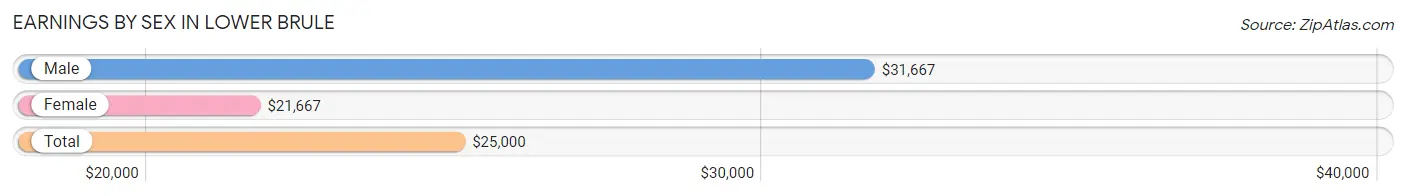
| Sex | Number | Average Earnings |
| Male | 124 (43.1%) | $31,667 |
| Female | 164 (56.9%) | $21,667 |
| Total | 288 (100.0%) | $25,000 |
Earnings by Sex by Income Bracket in Lower Brule
The most common earnings brackets in Lower Brule are $55,000 to $64,999 for men (17 | 13.7%) and $25,000 to $29,999 for women (20 | 12.2%).
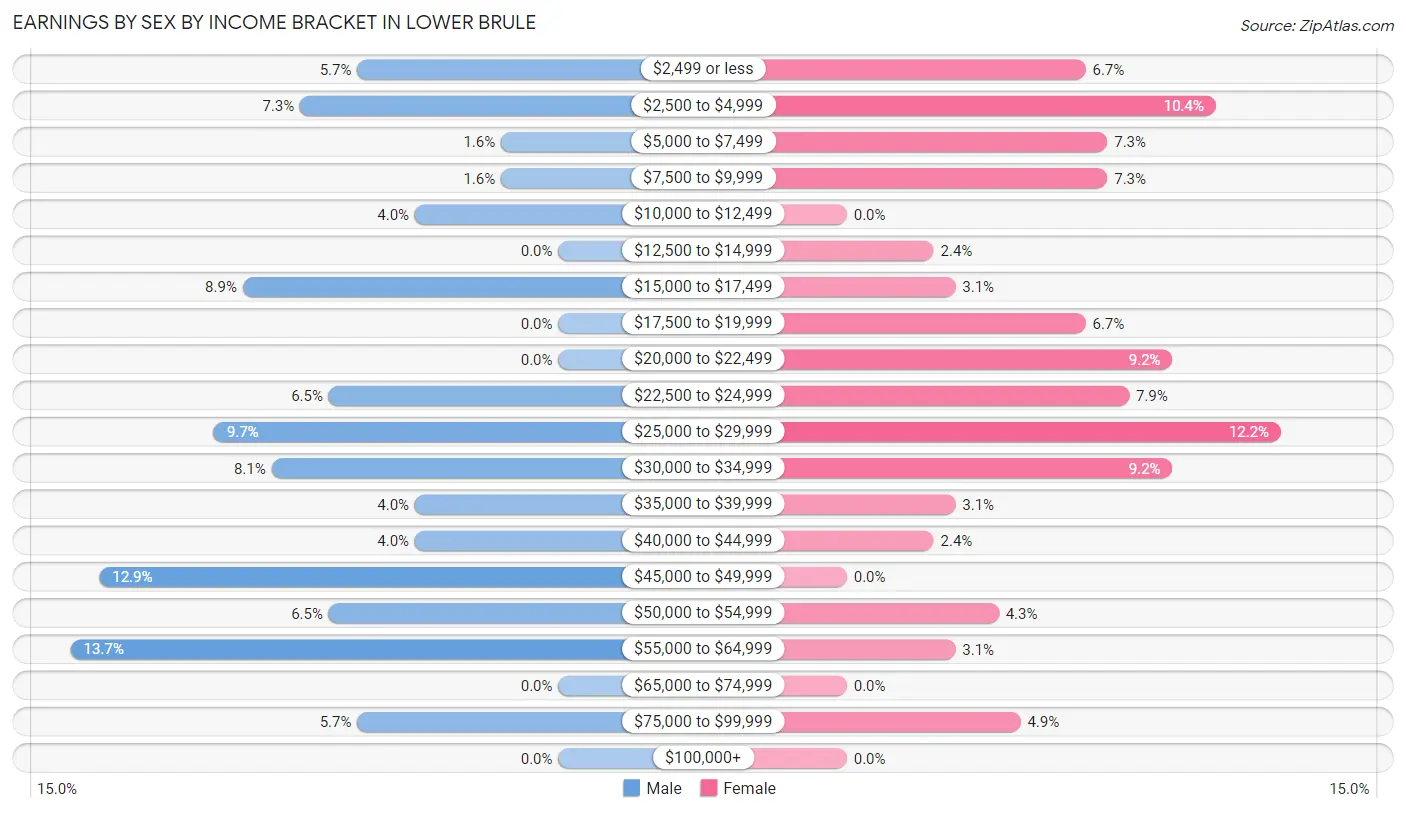
| Income | Male | Female |
| $2,499 or less | 7 (5.7%) | 11 (6.7%) |
| $2,500 to $4,999 | 9 (7.3%) | 17 (10.4%) |
| $5,000 to $7,499 | 2 (1.6%) | 12 (7.3%) |
| $7,500 to $9,999 | 2 (1.6%) | 12 (7.3%) |
| $10,000 to $12,499 | 5 (4.0%) | 0 (0.0%) |
| $12,500 to $14,999 | 0 (0.0%) | 4 (2.4%) |
| $15,000 to $17,499 | 11 (8.9%) | 5 (3.0%) |
| $17,500 to $19,999 | 0 (0.0%) | 11 (6.7%) |
| $20,000 to $22,499 | 0 (0.0%) | 15 (9.1%) |
| $22,500 to $24,999 | 8 (6.5%) | 13 (7.9%) |
| $25,000 to $29,999 | 12 (9.7%) | 20 (12.2%) |
| $30,000 to $34,999 | 10 (8.1%) | 15 (9.1%) |
| $35,000 to $39,999 | 5 (4.0%) | 5 (3.0%) |
| $40,000 to $44,999 | 5 (4.0%) | 4 (2.4%) |
| $45,000 to $49,999 | 16 (12.9%) | 0 (0.0%) |
| $50,000 to $54,999 | 8 (6.5%) | 7 (4.3%) |
| $55,000 to $64,999 | 17 (13.7%) | 5 (3.0%) |
| $65,000 to $74,999 | 0 (0.0%) | 0 (0.0%) |
| $75,000 to $99,999 | 7 (5.7%) | 8 (4.9%) |
| $100,000+ | 0 (0.0%) | 0 (0.0%) |
| Total | 124 (100.0%) | 164 (100.0%) |
Earnings by Sex by Educational Attainment in Lower Brule
Average earnings in Lower Brule are $44,250 for men and $23,571 for women, a difference of 46.7%. Men with an educational attainment of graduate degree enjoy the highest average annual earnings of $52,813, while those with college or associate's degree education earn the least with $38,125. Women with an educational attainment of high school diploma earn the most with the average annual earnings of $28,750, while those with college or associate's degree education have the smallest earnings of $19,205.
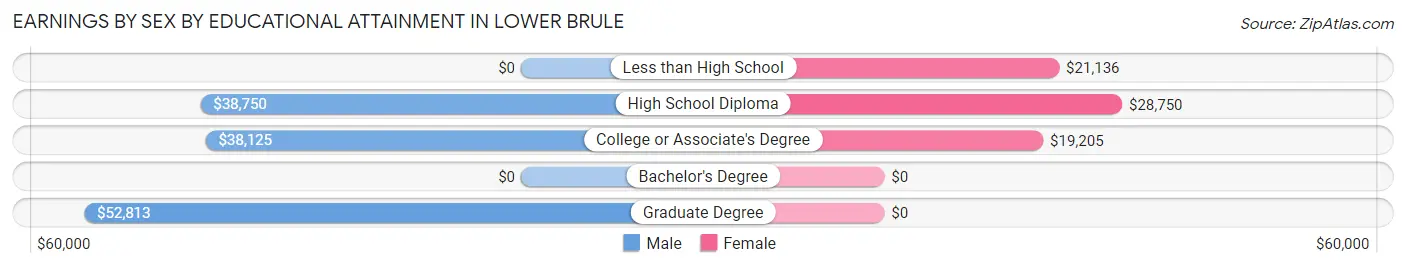
| Educational Attainment | Male Income | Female Income |
| Less than High School | - | - |
| High School Diploma | $38,750 | $28,750 |
| College or Associate's Degree | $38,125 | $19,205 |
| Bachelor's Degree | - | - |
| Graduate Degree | $52,813 | $0 |
| Total | $44,250 | $23,571 |
Family Income in Lower Brule
Family Income Brackets in Lower Brule
According to the Lower Brule family income data, there are 23 families falling into the $35,000 to $49,999 income range, which is the most common income bracket and makes up 16.4% of all families.
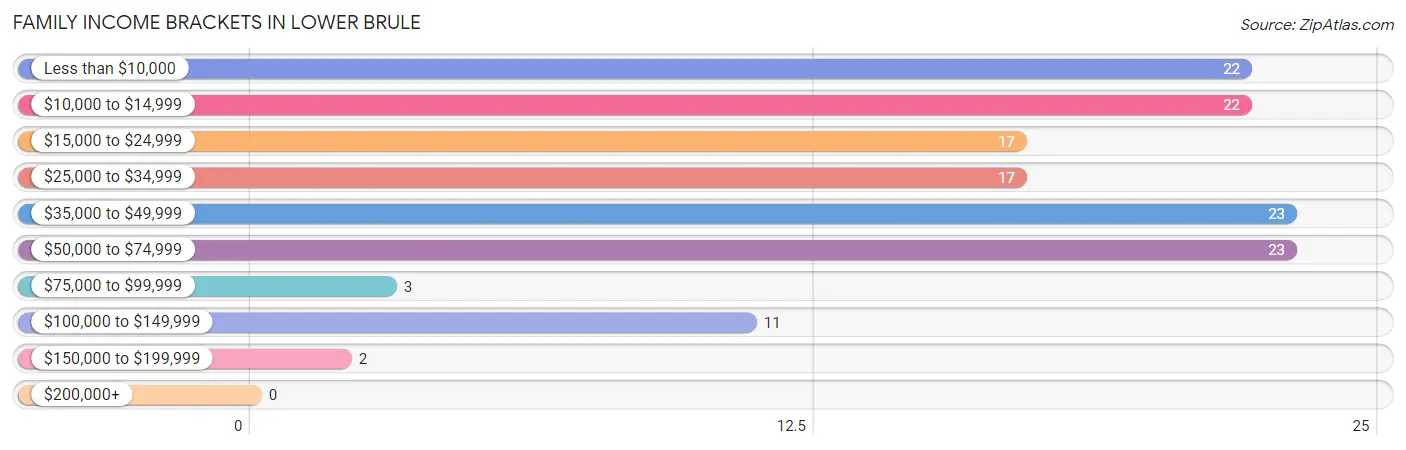
| Income Bracket | # Families | % Families |
| Less than $10,000 | 22 | 15.7% |
| $10,000 to $14,999 | 22 | 15.7% |
| $15,000 to $24,999 | 17 | 12.1% |
| $25,000 to $34,999 | 17 | 12.1% |
| $35,000 to $49,999 | 23 | 16.4% |
| $50,000 to $74,999 | 23 | 16.4% |
| $75,000 to $99,999 | 3 | 2.1% |
| $100,000 to $149,999 | 11 | 7.9% |
| $150,000 to $199,999 | 2 | 1.4% |
| $200,000+ | 0 | 0.0% |
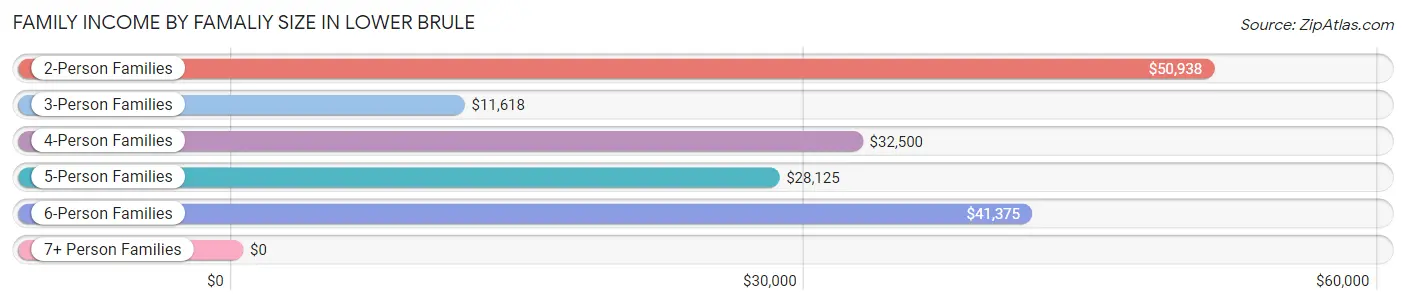
Family Income by Famaliy Size in Lower Brule
2-person families (33 | 23.6%) account for the highest median family income in Lower Brule with $50,938 per family, while 2-person families (33 | 23.6%) have the highest median income of $25,469 per family member.
| Income Bracket | # Families | Median Income |
| 2-Person Families | 33 (23.6%) | $50,938 |
| 3-Person Families | 22 (15.7%) | $11,618 |
| 4-Person Families | 22 (15.7%) | $32,500 |
| 5-Person Families | 18 (12.9%) | $28,125 |
| 6-Person Families | 23 (16.4%) | $41,375 |
| 7+ Person Families | 22 (15.7%) | $0 |
| Total | 140 (100.0%) | $30,500 |
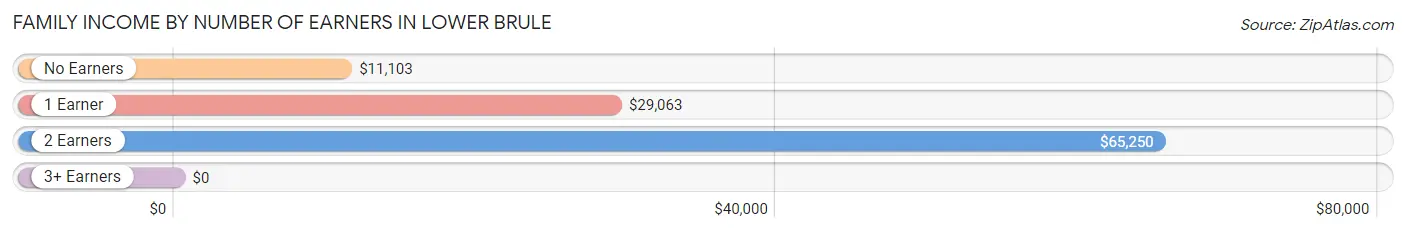
Family Income by Number of Earners in Lower Brule
| Number of Earners | # Families | Median Income |
| No Earners | 45 (32.1%) | $11,103 |
| 1 Earner | 31 (22.1%) | $29,063 |
| 2 Earners | 45 (32.1%) | $65,250 |
| 3+ Earners | 19 (13.6%) | $0 |
| Total | 140 (100.0%) | $30,500 |
Household Income in Lower Brule
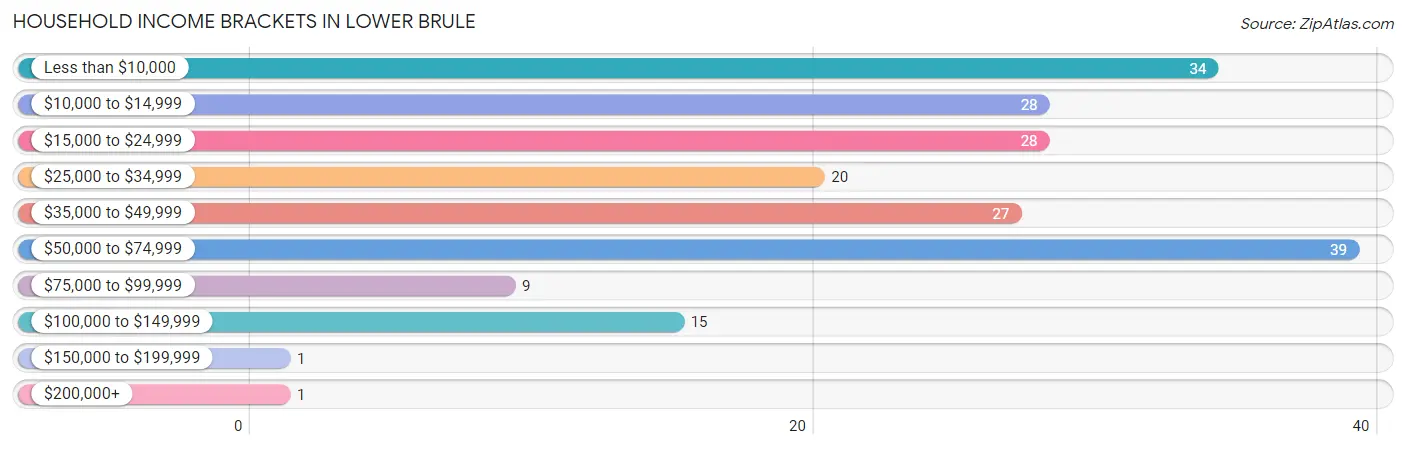
Household Income Brackets in Lower Brule
With 39 households falling in the category, the $50,000 to $74,999 income range is the most frequent in Lower Brule, accounting for 19.3% of all households. In contrast, only 1 households (0.5%) fall into the $150,000 to $199,999 income bracket, making it the least populous group.
| Income Bracket | # Households | % Households |
| Less than $10,000 | 34 | 16.8% |
| $10,000 to $14,999 | 28 | 13.9% |
| $15,000 to $24,999 | 28 | 13.9% |
| $25,000 to $34,999 | 20 | 9.9% |
| $35,000 to $49,999 | 27 | 13.4% |
| $50,000 to $74,999 | 39 | 19.3% |
| $75,000 to $99,999 | 9 | 4.5% |
| $100,000 to $149,999 | 15 | 7.4% |
| $150,000 to $199,999 | 1 | 0.5% |
| $200,000+ | 1 | 0.5% |
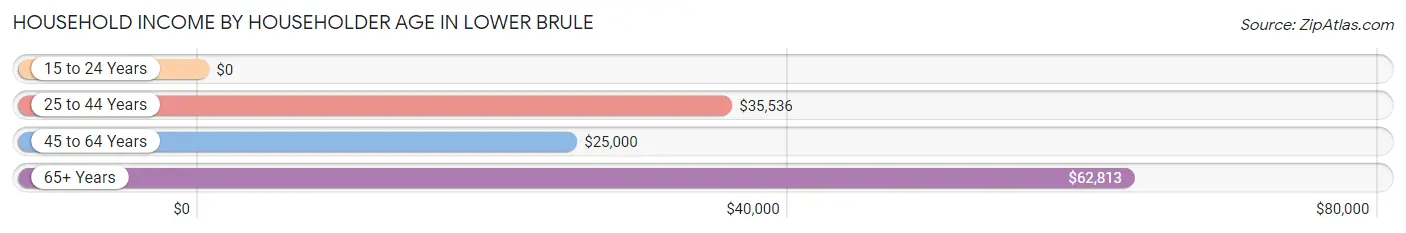
Household Income by Householder Age in Lower Brule
The median household income in Lower Brule is $29,375, with the highest median household income of $62,813 found in the 65+ years age bracket for the primary householder. A total of 31 households (15.3%) fall into this category. Meanwhile, the 15 to 24 years age bracket for the primary householder has the lowest median household income of $0, with 2 households (1.0%) in this group.
| Income Bracket | # Households | Median Income |
| 15 to 24 Years | 2 (1.0%) | $0 |
| 25 to 44 Years | 75 (37.1%) | $35,536 |
| 45 to 64 Years | 94 (46.5%) | $25,000 |
| 65+ Years | 31 (15.3%) | $62,813 |
| Total | 202 (100.0%) | $29,375 |
Poverty in Lower Brule
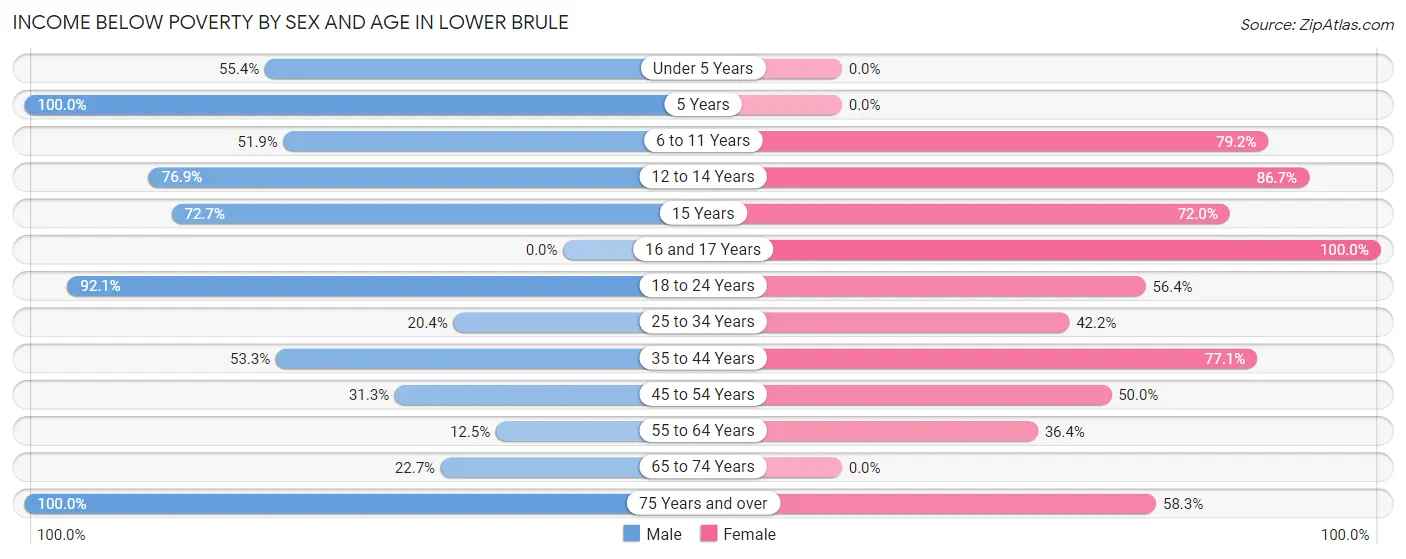
Income Below Poverty by Sex and Age in Lower Brule
With 50.7% poverty level for males and 55.0% for females among the residents of Lower Brule, 5 year old males and 16 and 17 year old females are the most vulnerable to poverty, with 5 males (100.0%) and 4 females (100.0%) in their respective age groups living below the poverty level.
| Age Bracket | Male | Female |
| Under 5 Years | 36 (55.4%) | 0 (0.0%) |
| 5 Years | 5 (100.0%) | 0 (0.0%) |
| 6 to 11 Years | 27 (51.9%) | 38 (79.2%) |
| 12 to 14 Years | 20 (76.9%) | 26 (86.7%) |
| 15 Years | 8 (72.7%) | 18 (72.0%) |
| 16 and 17 Years | 0 (0.0%) | 4 (100.0%) |
| 18 to 24 Years | 58 (92.1%) | 31 (56.4%) |
| 25 to 34 Years | 11 (20.4%) | 19 (42.2%) |
| 35 to 44 Years | 32 (53.3%) | 37 (77.1%) |
| 45 to 54 Years | 20 (31.2%) | 23 (50.0%) |
| 55 to 64 Years | 2 (12.5%) | 8 (36.4%) |
| 65 to 74 Years | 5 (22.7%) | 0 (0.0%) |
| 75 Years and over | 5 (100.0%) | 28 (58.3%) |
| Total | 229 (50.7%) | 232 (55.0%) |
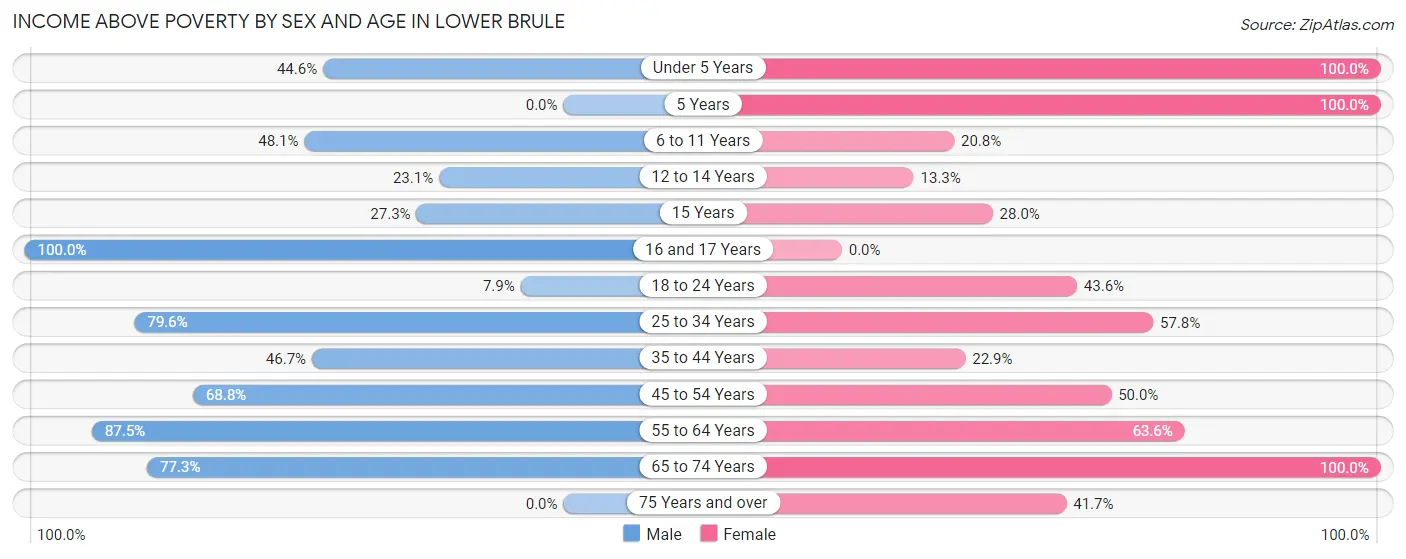
Income Above Poverty by Sex and Age in Lower Brule
According to the poverty statistics in Lower Brule, males aged 16 and 17 years and females aged under 5 years are the age groups that are most secure financially, with 100.0% of males and 100.0% of females in these age groups living above the poverty line.
| Age Bracket | Male | Female |
| Under 5 Years | 29 (44.6%) | 23 (100.0%) |
| 5 Years | 0 (0.0%) | 8 (100.0%) |
| 6 to 11 Years | 25 (48.1%) | 10 (20.8%) |
| 12 to 14 Years | 6 (23.1%) | 4 (13.3%) |
| 15 Years | 3 (27.3%) | 7 (28.0%) |
| 16 and 17 Years | 9 (100.0%) | 0 (0.0%) |
| 18 to 24 Years | 5 (7.9%) | 24 (43.6%) |
| 25 to 34 Years | 43 (79.6%) | 26 (57.8%) |
| 35 to 44 Years | 28 (46.7%) | 11 (22.9%) |
| 45 to 54 Years | 44 (68.8%) | 23 (50.0%) |
| 55 to 64 Years | 14 (87.5%) | 14 (63.6%) |
| 65 to 74 Years | 17 (77.3%) | 20 (100.0%) |
| 75 Years and over | 0 (0.0%) | 20 (41.7%) |
| Total | 223 (49.3%) | 190 (45.0%) |
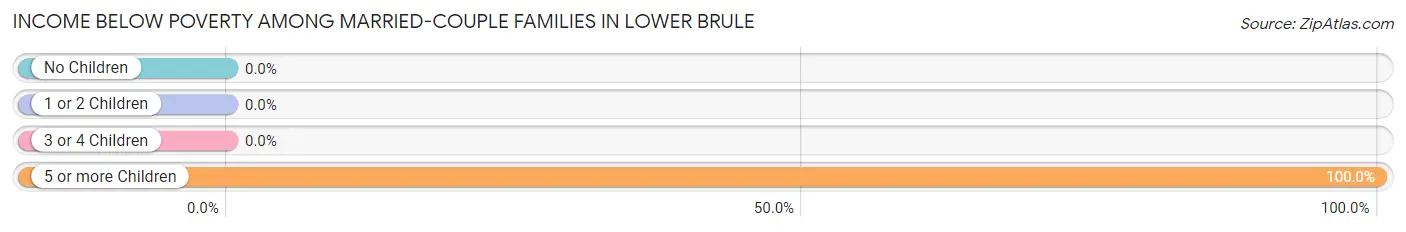
Income Below Poverty Among Married-Couple Families in Lower Brule
The poverty statistics for married-couple families in Lower Brule show that 11.8% or 4 of the total 34 families live below the poverty line. Families with 5 or more children have the highest poverty rate of 100.0%, comprising of 4 families. On the other hand, families with no children have the lowest poverty rate of 0.0%, which includes 0 families.
| Children | Above Poverty | Below Poverty |
| No Children | 10 (100.0%) | 0 (0.0%) |
| 1 or 2 Children | 10 (100.0%) | 0 (0.0%) |
| 3 or 4 Children | 10 (100.0%) | 0 (0.0%) |
| 5 or more Children | 0 (0.0%) | 4 (100.0%) |
| Total | 30 (88.2%) | 4 (11.8%) |
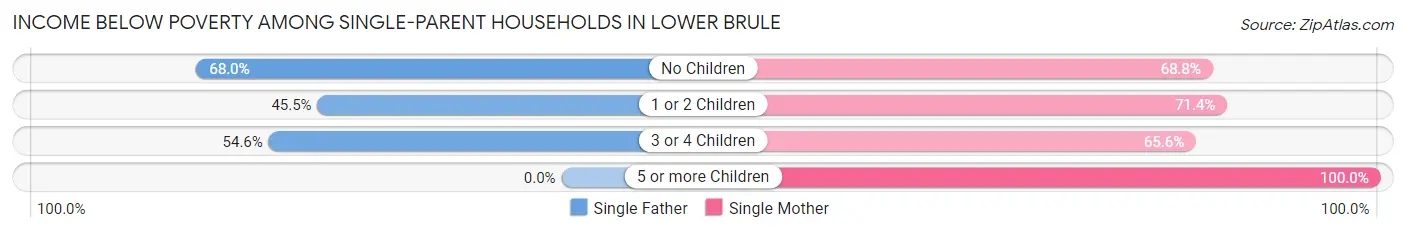
Income Below Poverty Among Single-Parent Households in Lower Brule
According to the poverty data in Lower Brule, 59.6% or 28 single-father households and 69.5% or 41 single-mother households are living below the poverty line. Among single-father households, those with no children have the highest poverty rate, with 17 households (68.0%) experiencing poverty. Likewise, among single-mother households, those with 5 or more children have the highest poverty rate, with 4 households (100.0%) falling below the poverty line.
| Children | Single Father | Single Mother |
| No Children | 17 (68.0%) | 11 (68.8%) |
| 1 or 2 Children | 5 (45.5%) | 5 (71.4%) |
| 3 or 4 Children | 6 (54.5%) | 21 (65.6%) |
| 5 or more Children | 0 (0.0%) | 4 (100.0%) |
| Total | 28 (59.6%) | 41 (69.5%) |
Income Below Poverty Among Married-Couple vs Single-Parent Households in Lower Brule
The poverty data for Lower Brule shows that 4 of the married-couple family households (11.8%) and 69 of the single-parent households (65.1%) are living below the poverty level. Within the married-couple family households, those with 5 or more children have the highest poverty rate, with 4 households (100.0%) falling below the poverty line. Among the single-parent households, those with 5 or more children have the highest poverty rate, with 4 household (100.0%) living below poverty.
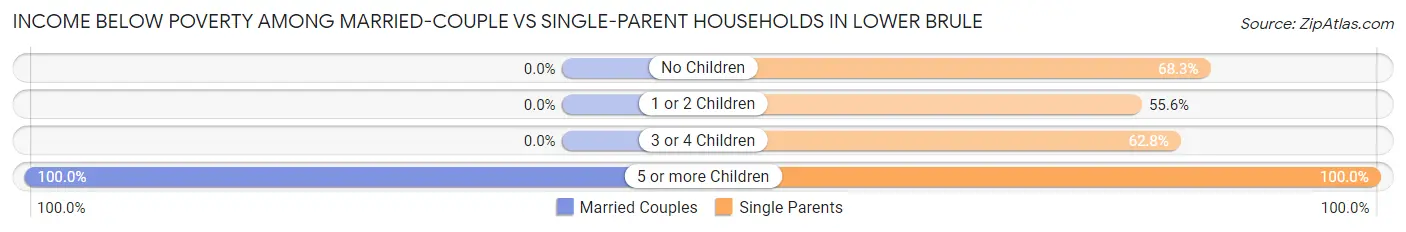
| Children | Married-Couple Families | Single-Parent Households |
| No Children | 0 (0.0%) | 28 (68.3%) |
| 1 or 2 Children | 0 (0.0%) | 10 (55.6%) |
| 3 or 4 Children | 0 (0.0%) | 27 (62.8%) |
| 5 or more Children | 4 (100.0%) | 4 (100.0%) |
| Total | 4 (11.8%) | 69 (65.1%) |
Employment Characteristics in Lower Brule
Employment by Class of Employer in Lower Brule
Among the 240 employed individuals in Lower Brule, local government employees (121 | 50.4%), private company employees (56 | 23.3%), and not-for-profit organizations (32 | 13.3%) make up the most common classes of employment.
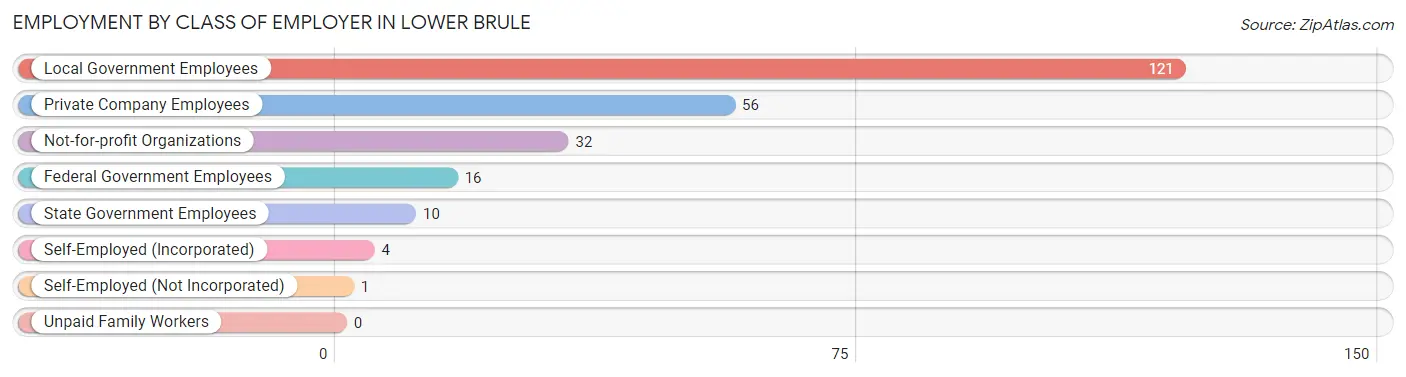
| Employer Class | # Employees | % Employees |
| Private Company Employees | 56 | 23.3% |
| Self-Employed (Incorporated) | 4 | 1.7% |
| Self-Employed (Not Incorporated) | 1 | 0.4% |
| Not-for-profit Organizations | 32 | 13.3% |
| Local Government Employees | 121 | 50.4% |
| State Government Employees | 10 | 4.2% |
| Federal Government Employees | 16 | 6.7% |
| Unpaid Family Workers | 0 | 0.0% |
| Total | 240 | 100.0% |
Employment Status by Age in Lower Brule
According to the labor force statistics for Lower Brule, out of the total population over 16 years of age (581), 46.5% or 270 individuals are in the labor force, with 8.9% or 24 of them unemployed. The age group with the highest labor force participation rate is 60 to 64 years, with 78.6% or 11 individuals in the labor force. Within the labor force, the 25 to 29 years age range has the highest percentage of unemployed individuals, with 29.6% or 8 of them being unemployed.
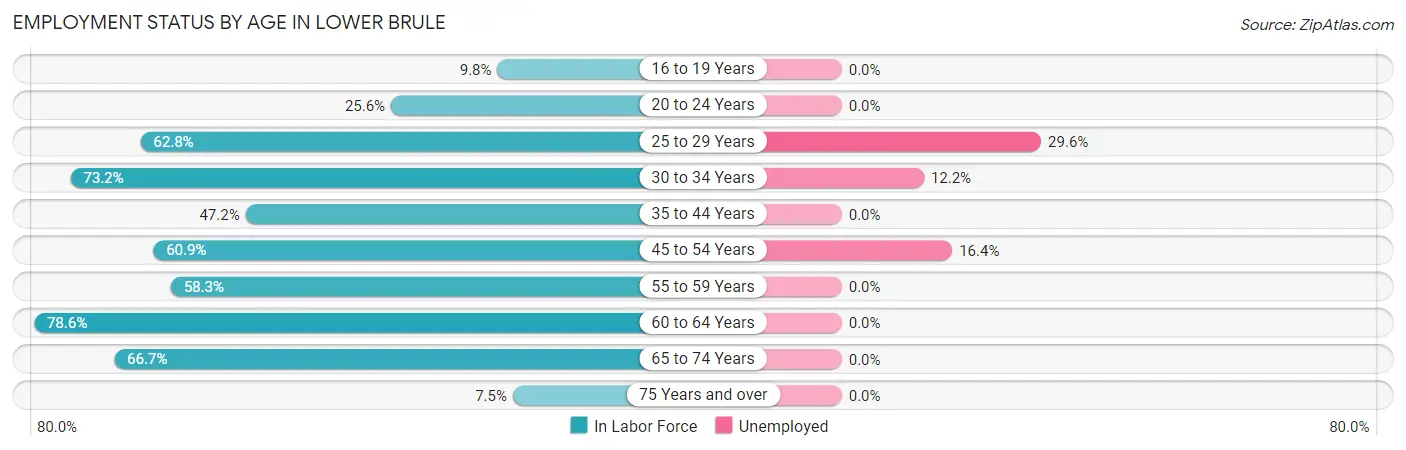
| Age Bracket | In Labor Force | Unemployed |
| 16 to 19 Years | 4 (9.8%) | 0 (0.0%) |
| 20 to 24 Years | 23 (25.6%) | 0 (0.0%) |
| 25 to 29 Years | 27 (62.8%) | 8 (29.6%) |
| 30 to 34 Years | 41 (73.2%) | 5 (12.2%) |
| 35 to 44 Years | 51 (47.2%) | 0 (0.0%) |
| 45 to 54 Years | 67 (60.9%) | 11 (16.4%) |
| 55 to 59 Years | 14 (58.3%) | 0 (0.0%) |
| 60 to 64 Years | 11 (78.6%) | 0 (0.0%) |
| 65 to 74 Years | 28 (66.7%) | 0 (0.0%) |
| 75 Years and over | 4 (7.5%) | 0 (0.0%) |
| Total | 270 (46.5%) | 24 (8.9%) |
Employment Status by Educational Attainment in Lower Brule
According to labor force statistics for Lower Brule, 59.4% of individuals (211) out of the total population between 25 and 64 years of age (355) are in the labor force, with 11.4% or 24 of them being unemployed. The group with the highest labor force participation rate are those with the educational attainment of bachelor's degree or higher, with 81.8% or 18 individuals in the labor force. Within the labor force, individuals with less than high school education have the highest percentage of unemployment, with 46.2% or 12 of them being unemployed.
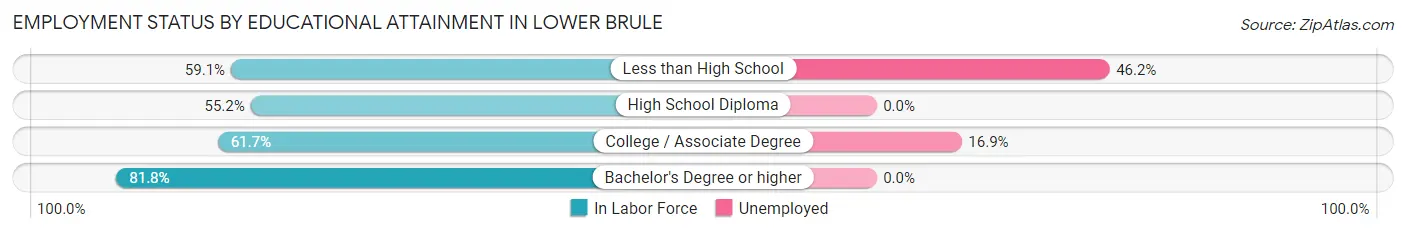
| Educational Attainment | In Labor Force | Unemployed |
| Less than High School | 26 (59.1%) | 20 (46.2%) |
| High School Diploma | 96 (55.2%) | 0 (0.0%) |
| College / Associate Degree | 71 (61.7%) | 19 (16.9%) |
| Bachelor's Degree or higher | 18 (81.8%) | 0 (0.0%) |
| Total | 211 (59.4%) | 40 (11.4%) |
Employment Occupations by Sex in Lower Brule
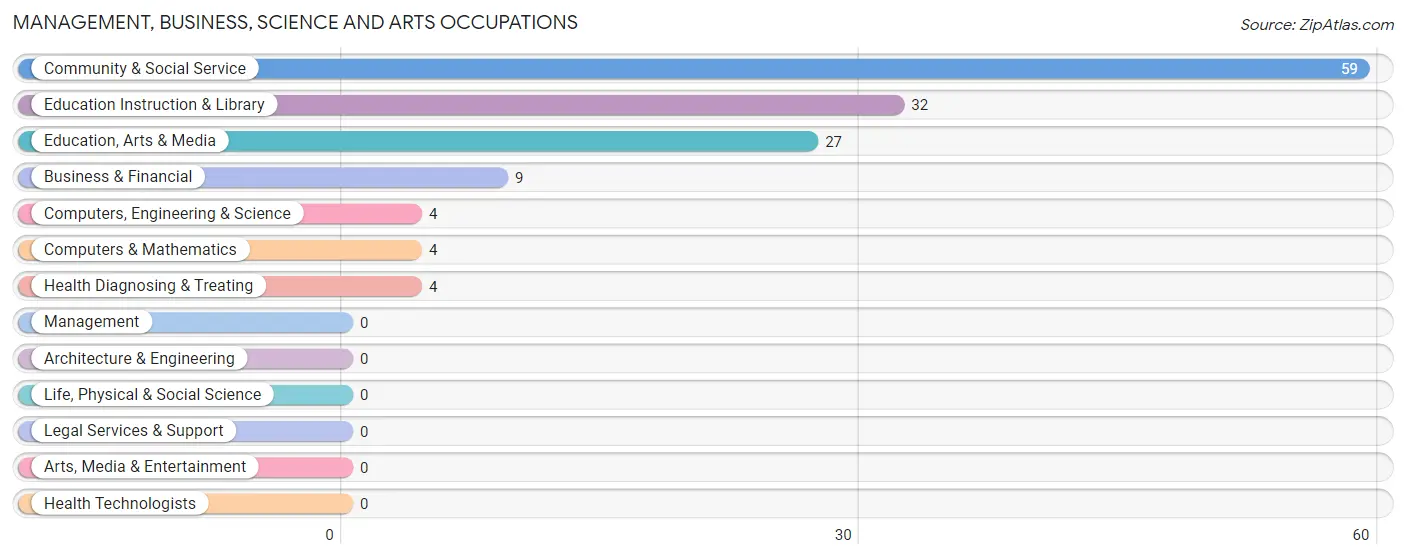
Management, Business, Science and Arts Occupations
The most common Management, Business, Science and Arts occupations in Lower Brule are Community & Social Service (59 | 24.0%), Education Instruction & Library (32 | 13.0%), Education, Arts & Media (27 | 11.0%), Business & Financial (9 | 3.7%), and Computers, Engineering & Science (4 | 1.6%).
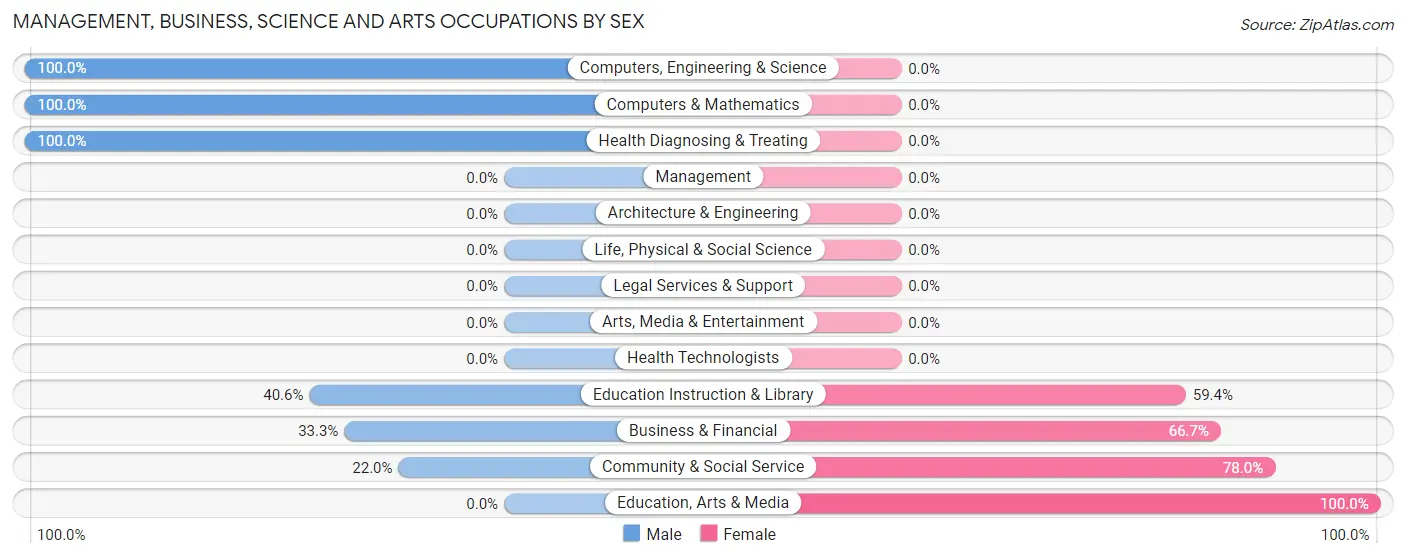
Management, Business, Science and Arts Occupations by Sex
Within the Management, Business, Science and Arts occupations in Lower Brule, the most male-oriented occupations are Computers, Engineering & Science (100.0%), Computers & Mathematics (100.0%), and Health Diagnosing & Treating (100.0%), while the most female-oriented occupations are Education, Arts & Media (100.0%), Community & Social Service (78.0%), and Business & Financial (66.7%).
| Occupation | Male | Female |
| Management | 0 (0.0%) | 0 (0.0%) |
| Business & Financial | 3 (33.3%) | 6 (66.7%) |
| Computers, Engineering & Science | 4 (100.0%) | 0 (0.0%) |
| Computers & Mathematics | 4 (100.0%) | 0 (0.0%) |
| Architecture & Engineering | 0 (0.0%) | 0 (0.0%) |
| Life, Physical & Social Science | 0 (0.0%) | 0 (0.0%) |
| Community & Social Service | 13 (22.0%) | 46 (78.0%) |
| Education, Arts & Media | 0 (0.0%) | 27 (100.0%) |
| Legal Services & Support | 0 (0.0%) | 0 (0.0%) |
| Education Instruction & Library | 13 (40.6%) | 19 (59.4%) |
| Arts, Media & Entertainment | 0 (0.0%) | 0 (0.0%) |
| Health Diagnosing & Treating | 4 (100.0%) | 0 (0.0%) |
| Health Technologists | 0 (0.0%) | 0 (0.0%) |
| Total (Category) | 24 (31.6%) | 52 (68.4%) |
| Total (Overall) | 109 (44.3%) | 137 (55.7%) |
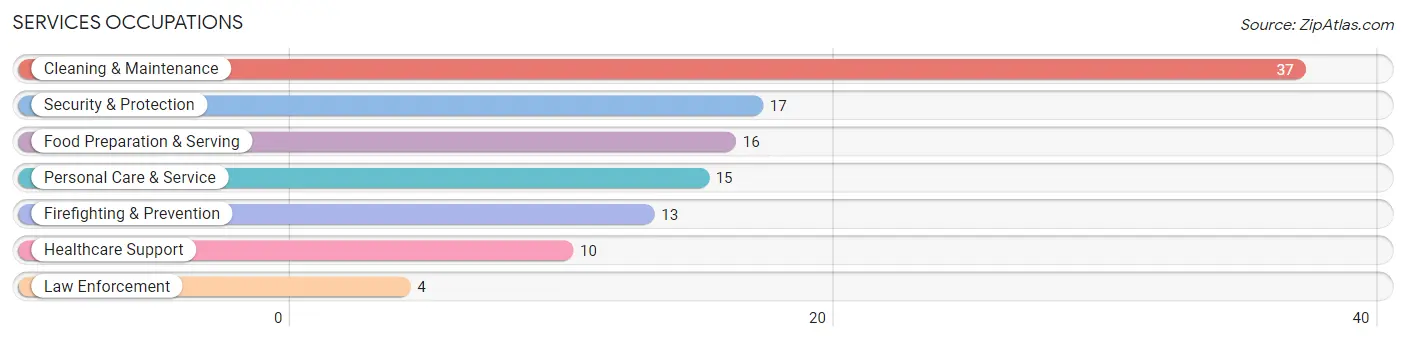
Services Occupations
The most common Services occupations in Lower Brule are Cleaning & Maintenance (37 | 15.0%), Security & Protection (17 | 6.9%), Food Preparation & Serving (16 | 6.5%), Personal Care & Service (15 | 6.1%), and Firefighting & Prevention (13 | 5.3%).
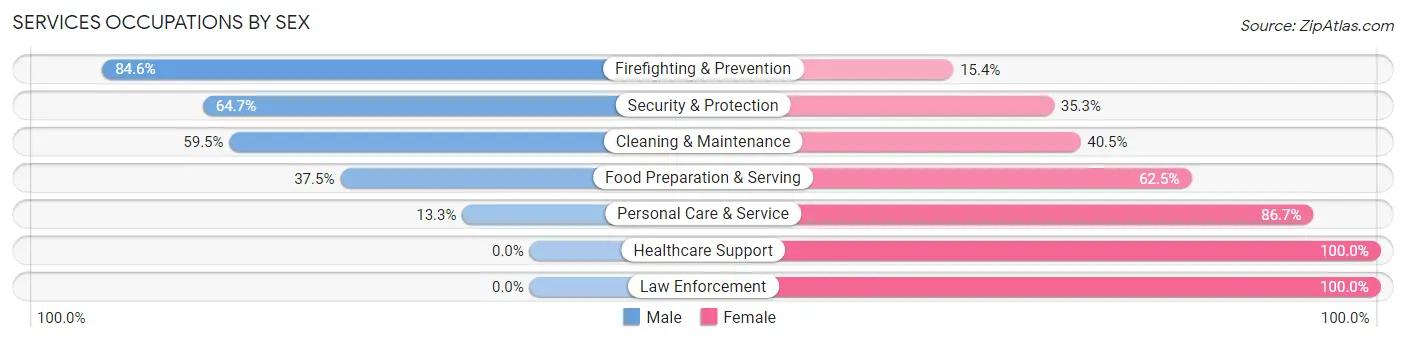
Services Occupations by Sex
Within the Services occupations in Lower Brule, the most male-oriented occupations are Firefighting & Prevention (84.6%), Security & Protection (64.7%), and Cleaning & Maintenance (59.5%), while the most female-oriented occupations are Healthcare Support (100.0%), Law Enforcement (100.0%), and Personal Care & Service (86.7%).
| Occupation | Male | Female |
| Healthcare Support | 0 (0.0%) | 10 (100.0%) |
| Security & Protection | 11 (64.7%) | 6 (35.3%) |
| Firefighting & Prevention | 11 (84.6%) | 2 (15.4%) |
| Law Enforcement | 0 (0.0%) | 4 (100.0%) |
| Food Preparation & Serving | 6 (37.5%) | 10 (62.5%) |
| Cleaning & Maintenance | 22 (59.5%) | 15 (40.5%) |
| Personal Care & Service | 2 (13.3%) | 13 (86.7%) |
| Total (Category) | 41 (43.2%) | 54 (56.8%) |
| Total (Overall) | 109 (44.3%) | 137 (55.7%) |
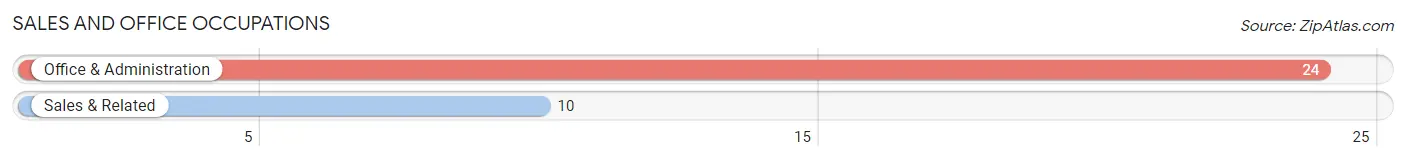
Sales and Office Occupations
The most common Sales and Office occupations in Lower Brule are Office & Administration (24 | 9.8%), and Sales & Related (10 | 4.1%).
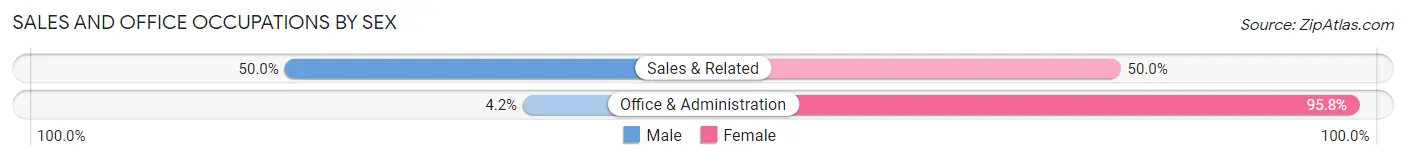
Sales and Office Occupations by Sex
| Occupation | Male | Female |
| Sales & Related | 5 (50.0%) | 5 (50.0%) |
| Office & Administration | 1 (4.2%) | 23 (95.8%) |
| Total (Category) | 6 (17.6%) | 28 (82.4%) |
| Total (Overall) | 109 (44.3%) | 137 (55.7%) |
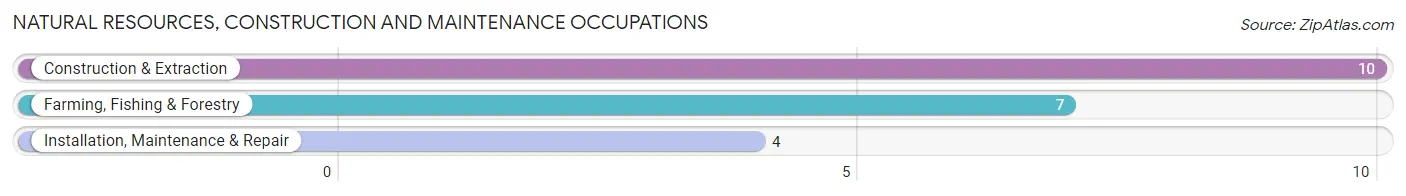
Natural Resources, Construction and Maintenance Occupations
The most common Natural Resources, Construction and Maintenance occupations in Lower Brule are Construction & Extraction (10 | 4.1%), Farming, Fishing & Forestry (7 | 2.9%), and Installation, Maintenance & Repair (4 | 1.6%).
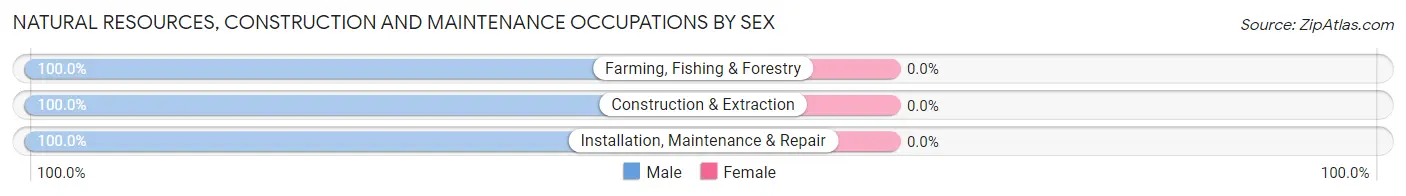
Natural Resources, Construction and Maintenance Occupations by Sex
| Occupation | Male | Female |
| Farming, Fishing & Forestry | 7 (100.0%) | 0 (0.0%) |
| Construction & Extraction | 10 (100.0%) | 0 (0.0%) |
| Installation, Maintenance & Repair | 4 (100.0%) | 0 (0.0%) |
| Total (Category) | 21 (100.0%) | 0 (0.0%) |
| Total (Overall) | 109 (44.3%) | 137 (55.7%) |
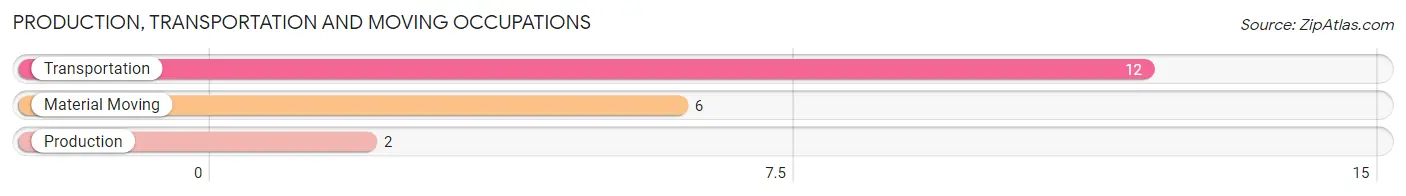
Production, Transportation and Moving Occupations
The most common Production, Transportation and Moving occupations in Lower Brule are Transportation (12 | 4.9%), Material Moving (6 | 2.4%), and Production (2 | 0.8%).
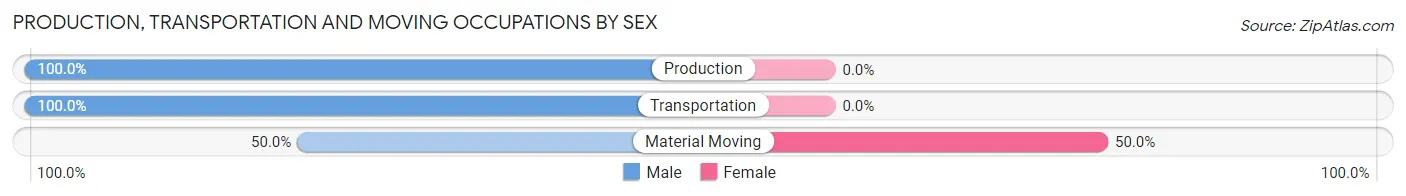
Production, Transportation and Moving Occupations by Sex
| Occupation | Male | Female |
| Production | 2 (100.0%) | 0 (0.0%) |
| Transportation | 12 (100.0%) | 0 (0.0%) |
| Material Moving | 3 (50.0%) | 3 (50.0%) |
| Total (Category) | 17 (85.0%) | 3 (15.0%) |
| Total (Overall) | 109 (44.3%) | 137 (55.7%) |
Employment Industries by Sex in Lower Brule
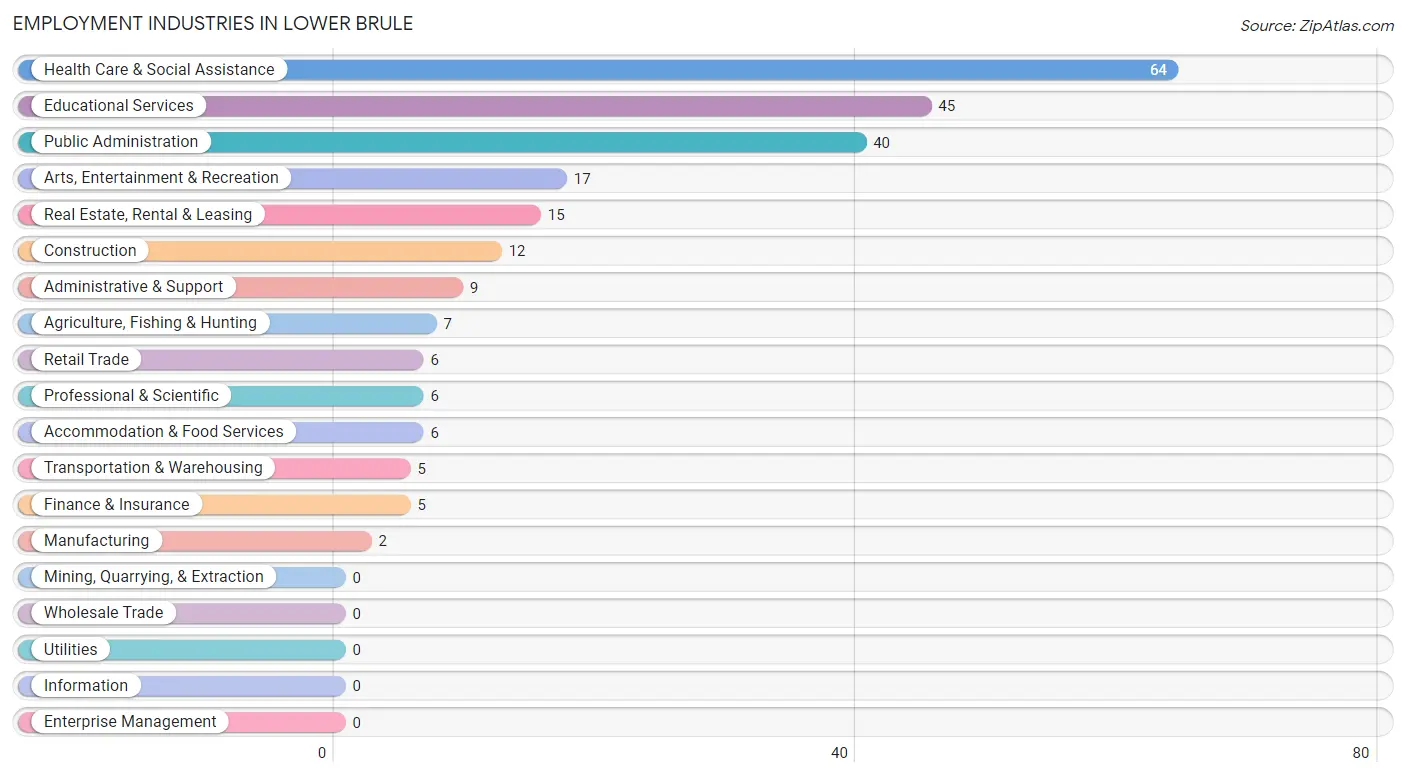
Employment Industries in Lower Brule
The major employment industries in Lower Brule include Health Care & Social Assistance (64 | 26.0%), Educational Services (45 | 18.3%), Public Administration (40 | 16.3%), Arts, Entertainment & Recreation (17 | 6.9%), and Real Estate, Rental & Leasing (15 | 6.1%).
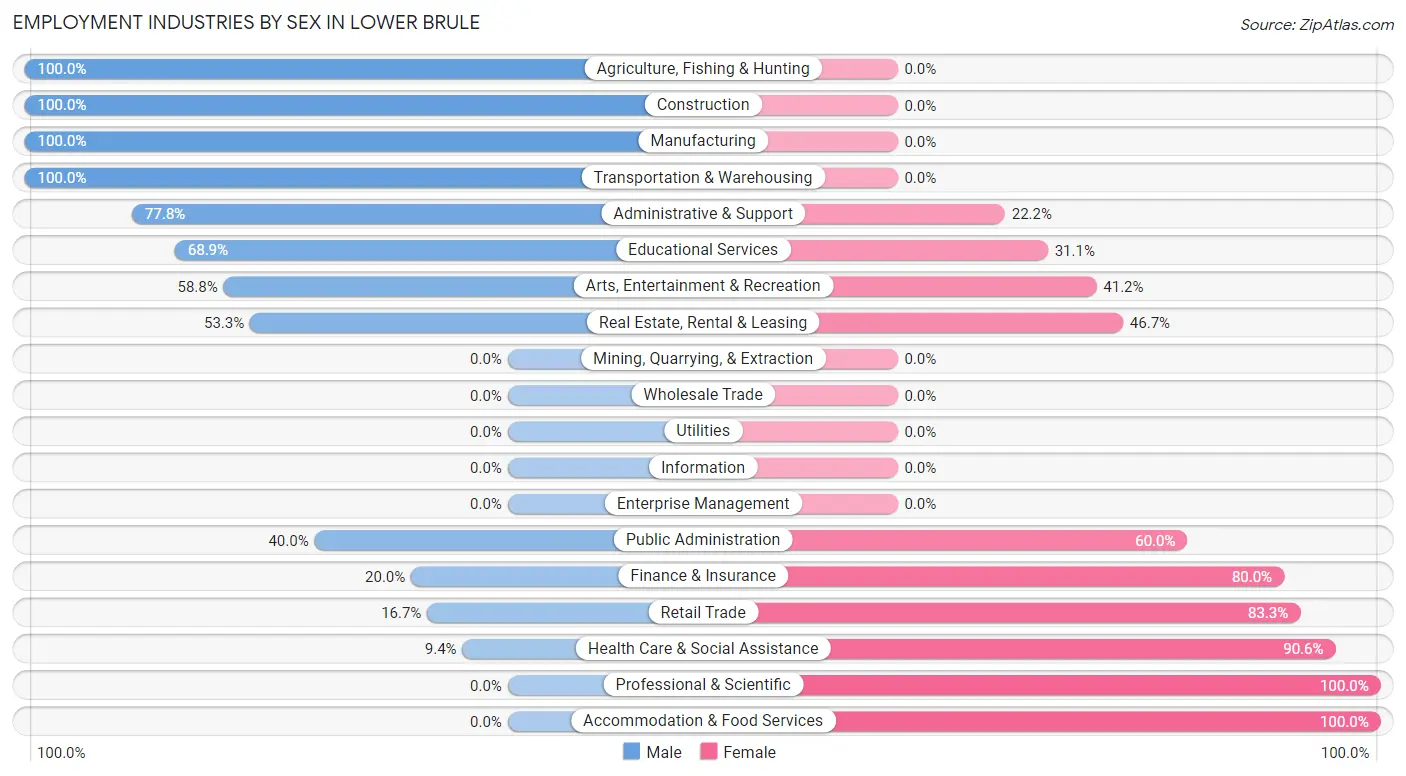
Employment Industries by Sex in Lower Brule
The Lower Brule industries that see more men than women are Agriculture, Fishing & Hunting (100.0%), Construction (100.0%), and Manufacturing (100.0%), whereas the industries that tend to have a higher number of women are Professional & Scientific (100.0%), Accommodation & Food Services (100.0%), and Health Care & Social Assistance (90.6%).
| Industry | Male | Female |
| Agriculture, Fishing & Hunting | 7 (100.0%) | 0 (0.0%) |
| Mining, Quarrying, & Extraction | 0 (0.0%) | 0 (0.0%) |
| Construction | 12 (100.0%) | 0 (0.0%) |
| Manufacturing | 2 (100.0%) | 0 (0.0%) |
| Wholesale Trade | 0 (0.0%) | 0 (0.0%) |
| Retail Trade | 1 (16.7%) | 5 (83.3%) |
| Transportation & Warehousing | 5 (100.0%) | 0 (0.0%) |
| Utilities | 0 (0.0%) | 0 (0.0%) |
| Information | 0 (0.0%) | 0 (0.0%) |
| Finance & Insurance | 1 (20.0%) | 4 (80.0%) |
| Real Estate, Rental & Leasing | 8 (53.3%) | 7 (46.7%) |
| Professional & Scientific | 0 (0.0%) | 6 (100.0%) |
| Enterprise Management | 0 (0.0%) | 0 (0.0%) |
| Administrative & Support | 7 (77.8%) | 2 (22.2%) |
| Educational Services | 31 (68.9%) | 14 (31.1%) |
| Health Care & Social Assistance | 6 (9.4%) | 58 (90.6%) |
| Arts, Entertainment & Recreation | 10 (58.8%) | 7 (41.2%) |
| Accommodation & Food Services | 0 (0.0%) | 6 (100.0%) |
| Public Administration | 16 (40.0%) | 24 (60.0%) |
| Total | 109 (44.3%) | 137 (55.7%) |
Education in Lower Brule
School Enrollment in Lower Brule
The most common levels of schooling among the 306 students in Lower Brule are high school (78 | 25.5%), elementary school (66 | 21.6%), and middle school (62 | 20.3%).
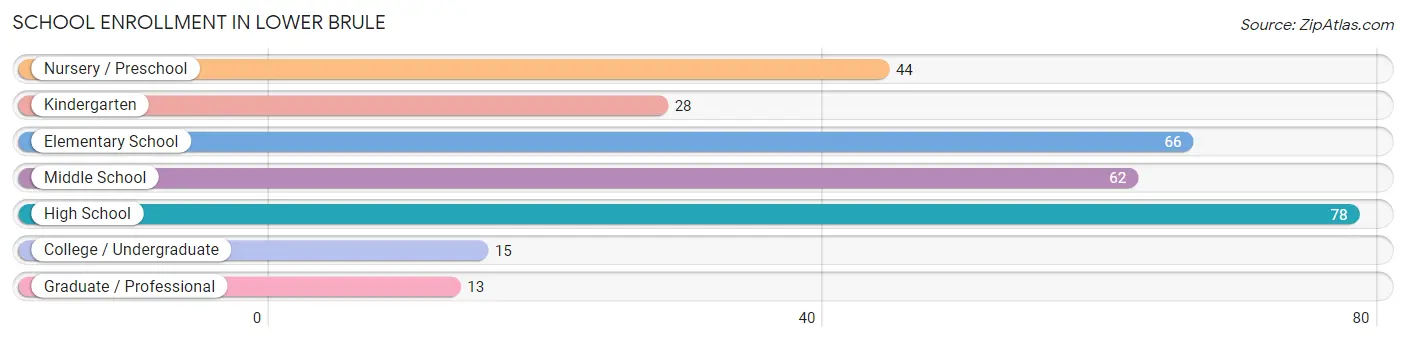
| School Level | # Students | % Students |
| Nursery / Preschool | 44 | 14.4% |
| Kindergarten | 28 | 9.1% |
| Elementary School | 66 | 21.6% |
| Middle School | 62 | 20.3% |
| High School | 78 | 25.5% |
| College / Undergraduate | 15 | 4.9% |
| Graduate / Professional | 13 | 4.3% |
| Total | 306 | 100.0% |
School Enrollment by Age by Funding Source in Lower Brule
Out of a total of 306 students who are enrolled in schools in Lower Brule, 18 (5.9%) attend a private institution, while the remaining 288 (94.1%) are enrolled in public schools. The age group of 20 to 24 year olds has the highest likelihood of being enrolled in private schools, with 5 (71.4% in the age bracket) enrolled. Conversely, the age group of 5 to 9 year old has the lowest likelihood of being enrolled in a private school, with 93 (100.0% in the age bracket) attending a public institution.
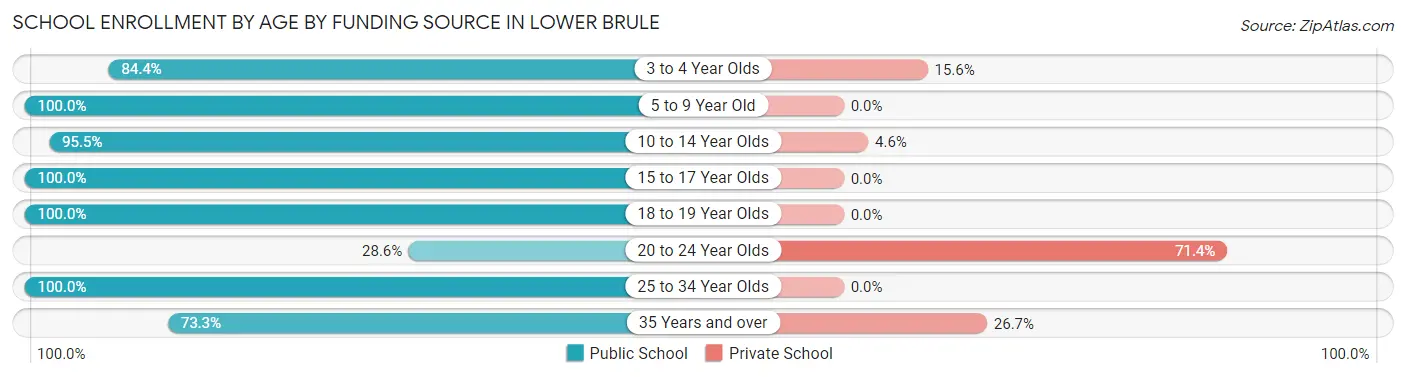
| Age Bracket | Public School | Private School |
| 3 to 4 Year Olds | 27 (84.4%) | 5 (15.6%) |
| 5 to 9 Year Old | 93 (100.0%) | 0 (0.0%) |
| 10 to 14 Year Olds | 84 (95.5%) | 4 (4.5%) |
| 15 to 17 Year Olds | 49 (100.0%) | 0 (0.0%) |
| 18 to 19 Year Olds | 8 (100.0%) | 0 (0.0%) |
| 20 to 24 Year Olds | 2 (28.6%) | 5 (71.4%) |
| 25 to 34 Year Olds | 14 (100.0%) | 0 (0.0%) |
| 35 Years and over | 11 (73.3%) | 4 (26.7%) |
| Total | 288 (94.1%) | 18 (5.9%) |
Educational Attainment by Field of Study in Lower Brule
Education (54 | 79.4%), science & technology (6 | 8.8%), arts & humanities (6 | 8.8%), and business (2 | 2.9%) are the most common fields of study among 68 individuals in Lower Brule who have obtained a bachelor's degree or higher.
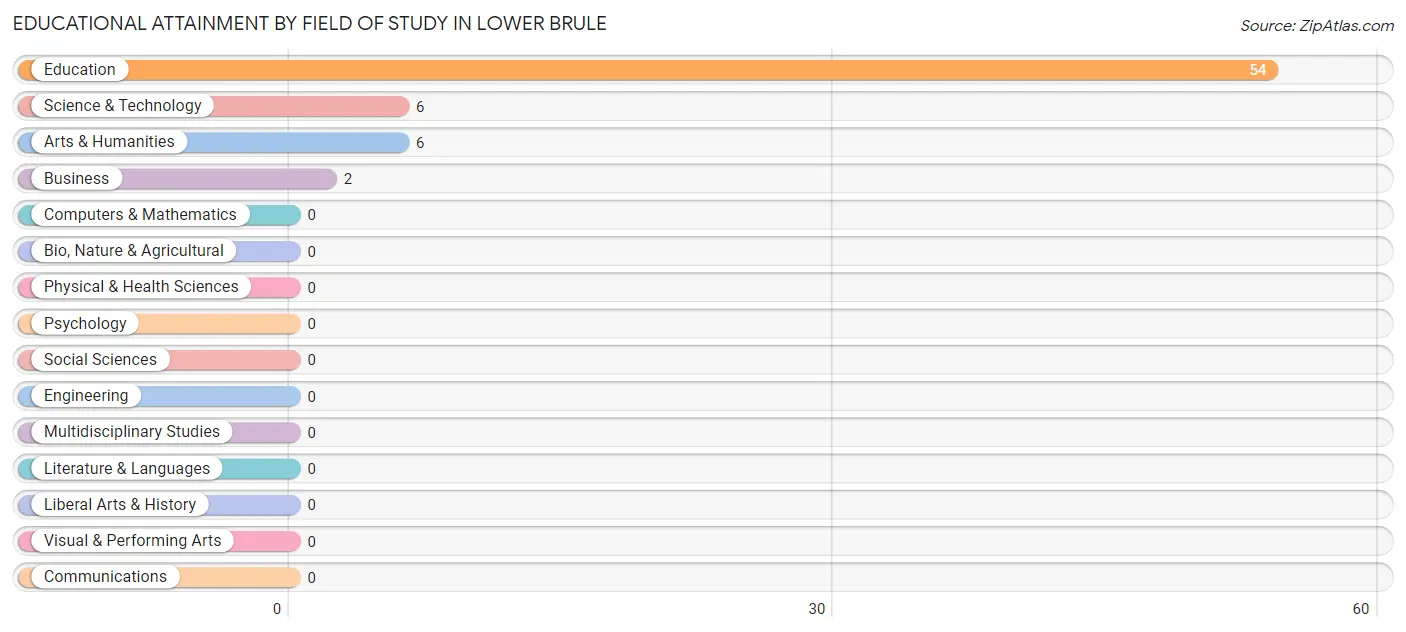
| Field of Study | # Graduates | % Graduates |
| Computers & Mathematics | 0 | 0.0% |
| Bio, Nature & Agricultural | 0 | 0.0% |
| Physical & Health Sciences | 0 | 0.0% |
| Psychology | 0 | 0.0% |
| Social Sciences | 0 | 0.0% |
| Engineering | 0 | 0.0% |
| Multidisciplinary Studies | 0 | 0.0% |
| Science & Technology | 6 | 8.8% |
| Business | 2 | 2.9% |
| Education | 54 | 79.4% |
| Literature & Languages | 0 | 0.0% |
| Liberal Arts & History | 0 | 0.0% |
| Visual & Performing Arts | 0 | 0.0% |
| Communications | 0 | 0.0% |
| Arts & Humanities | 6 | 8.8% |
| Total | 68 | 100.0% |
Transportation & Commute in Lower Brule
Vehicle Availability by Sex in Lower Brule
The most prevalent vehicle ownership categories in Lower Brule are males with 2 vehicles (37, accounting for 35.9%) and females with 2 vehicles (39, making up 27.0%).
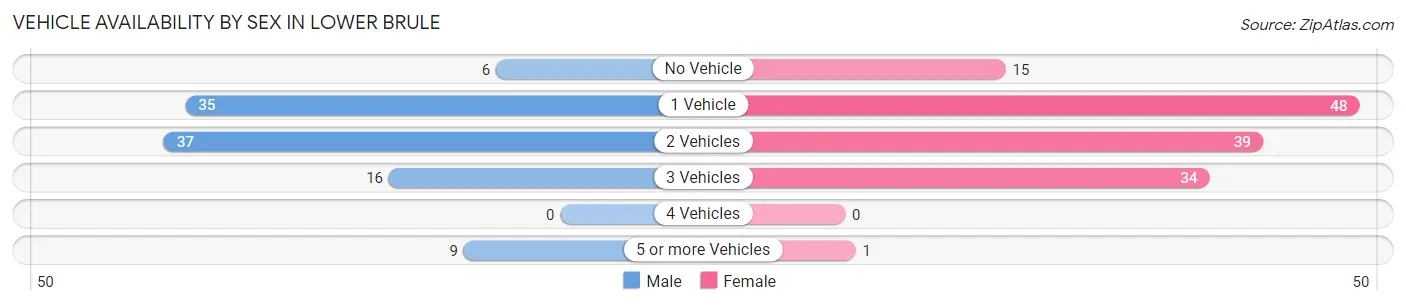
| Vehicles Available | Male | Female |
| No Vehicle | 6 (5.8%) | 15 (11.0%) |
| 1 Vehicle | 35 (34.0%) | 48 (35.0%) |
| 2 Vehicles | 37 (35.9%) | 39 (28.5%) |
| 3 Vehicles | 16 (15.5%) | 34 (24.8%) |
| 4 Vehicles | 0 (0.0%) | 0 (0.0%) |
| 5 or more Vehicles | 9 (8.7%) | 1 (0.7%) |
| Total | 103 (100.0%) | 137 (100.0%) |
Commute Time in Lower Brule
The most frequently occuring commute durations in Lower Brule are 5 to 9 minutes (116 commuters, 48.5%), less than 5 minutes (52 commuters, 21.8%), and 10 to 14 minutes (21 commuters, 8.8%).
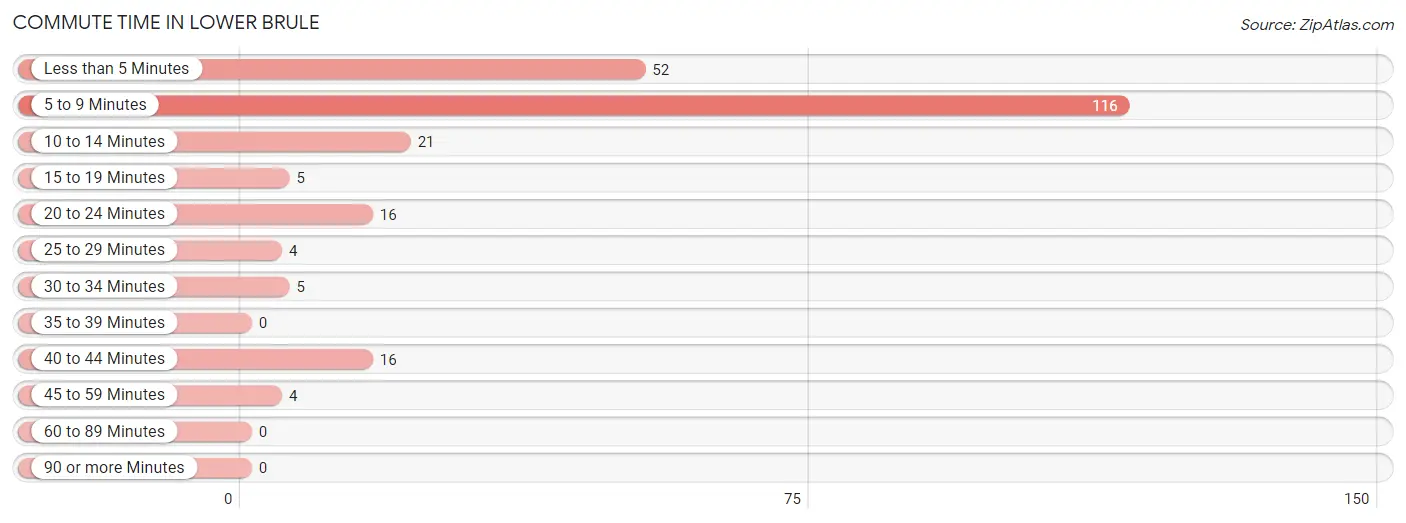
| Commute Time | # Commuters | % Commuters |
| Less than 5 Minutes | 52 | 21.8% |
| 5 to 9 Minutes | 116 | 48.5% |
| 10 to 14 Minutes | 21 | 8.8% |
| 15 to 19 Minutes | 5 | 2.1% |
| 20 to 24 Minutes | 16 | 6.7% |
| 25 to 29 Minutes | 4 | 1.7% |
| 30 to 34 Minutes | 5 | 2.1% |
| 35 to 39 Minutes | 0 | 0.0% |
| 40 to 44 Minutes | 16 | 6.7% |
| 45 to 59 Minutes | 4 | 1.7% |
| 60 to 89 Minutes | 0 | 0.0% |
| 90 or more Minutes | 0 | 0.0% |
Commute Time by Sex in Lower Brule
The most common commute times in Lower Brule are 5 to 9 minutes (39 commuters, 38.2%) for males and 5 to 9 minutes (77 commuters, 56.2%) for females.
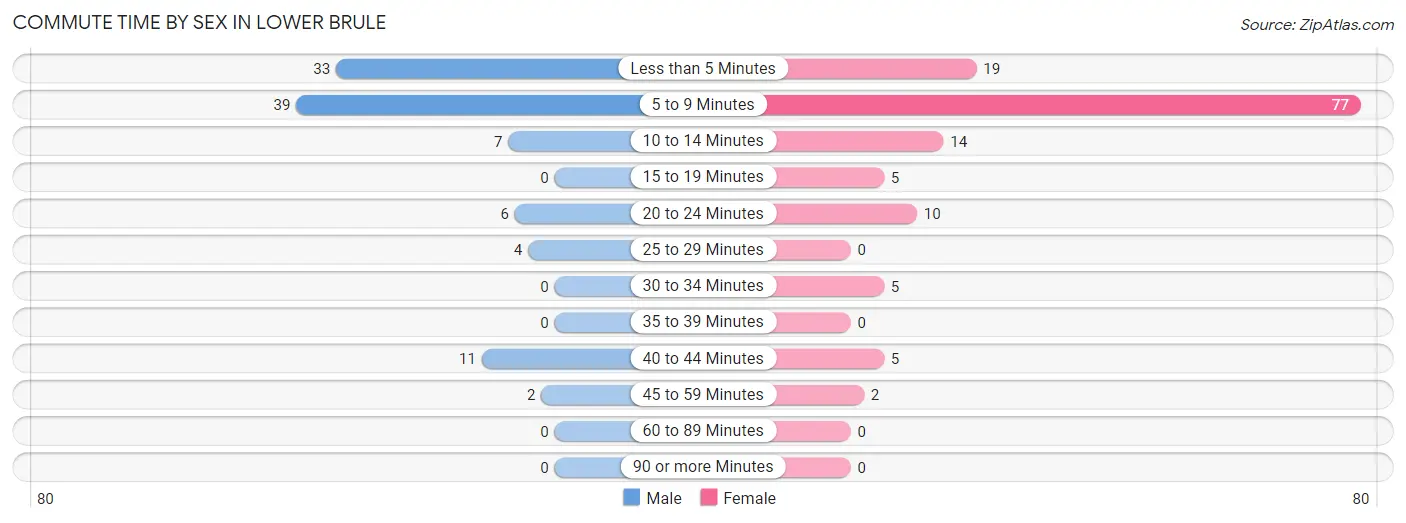
| Commute Time | Male | Female |
| Less than 5 Minutes | 33 (32.4%) | 19 (13.9%) |
| 5 to 9 Minutes | 39 (38.2%) | 77 (56.2%) |
| 10 to 14 Minutes | 7 (6.9%) | 14 (10.2%) |
| 15 to 19 Minutes | 0 (0.0%) | 5 (3.6%) |
| 20 to 24 Minutes | 6 (5.9%) | 10 (7.3%) |
| 25 to 29 Minutes | 4 (3.9%) | 0 (0.0%) |
| 30 to 34 Minutes | 0 (0.0%) | 5 (3.6%) |
| 35 to 39 Minutes | 0 (0.0%) | 0 (0.0%) |
| 40 to 44 Minutes | 11 (10.8%) | 5 (3.6%) |
| 45 to 59 Minutes | 2 (2.0%) | 2 (1.5%) |
| 60 to 89 Minutes | 0 (0.0%) | 0 (0.0%) |
| 90 or more Minutes | 0 (0.0%) | 0 (0.0%) |
Time of Departure to Work by Sex in Lower Brule
The most frequent times of departure to work in Lower Brule are 7:30 AM to 7:59 AM (38, 37.2%) for males and 8:00 AM to 8:29 AM (56, 40.9%) for females.
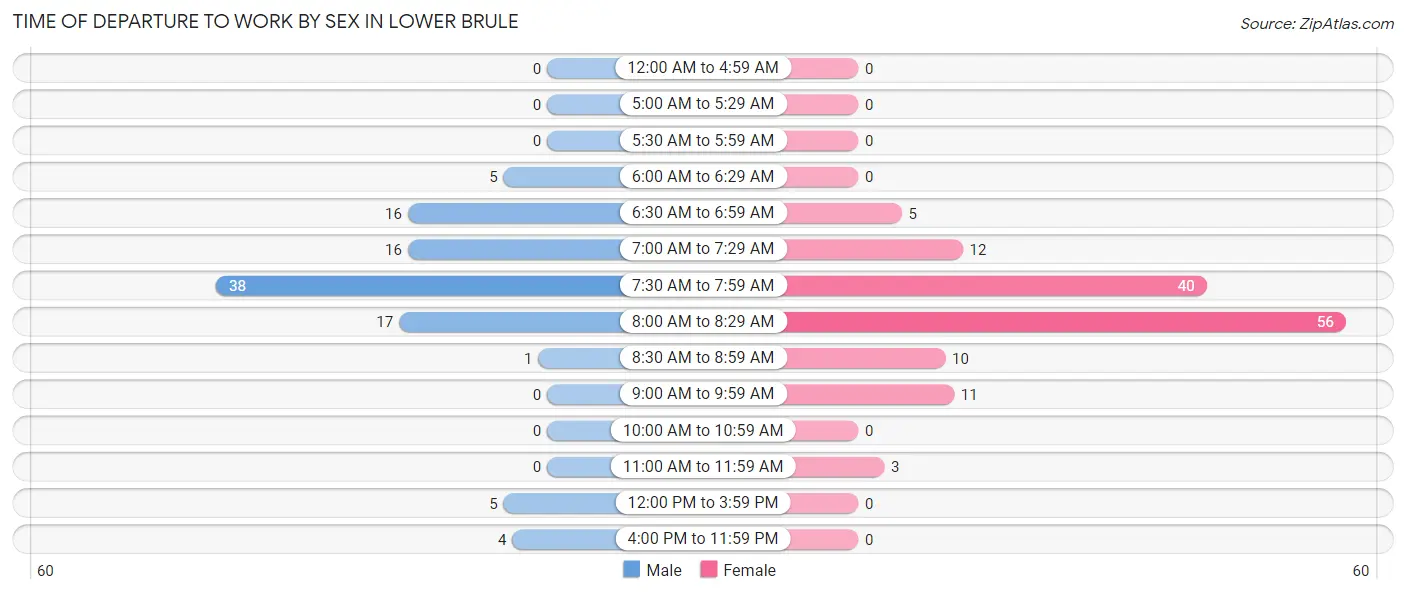
| Time of Departure | Male | Female |
| 12:00 AM to 4:59 AM | 0 (0.0%) | 0 (0.0%) |
| 5:00 AM to 5:29 AM | 0 (0.0%) | 0 (0.0%) |
| 5:30 AM to 5:59 AM | 0 (0.0%) | 0 (0.0%) |
| 6:00 AM to 6:29 AM | 5 (4.9%) | 0 (0.0%) |
| 6:30 AM to 6:59 AM | 16 (15.7%) | 5 (3.6%) |
| 7:00 AM to 7:29 AM | 16 (15.7%) | 12 (8.8%) |
| 7:30 AM to 7:59 AM | 38 (37.2%) | 40 (29.2%) |
| 8:00 AM to 8:29 AM | 17 (16.7%) | 56 (40.9%) |
| 8:30 AM to 8:59 AM | 1 (1.0%) | 10 (7.3%) |
| 9:00 AM to 9:59 AM | 0 (0.0%) | 11 (8.0%) |
| 10:00 AM to 10:59 AM | 0 (0.0%) | 0 (0.0%) |
| 11:00 AM to 11:59 AM | 0 (0.0%) | 3 (2.2%) |
| 12:00 PM to 3:59 PM | 5 (4.9%) | 0 (0.0%) |
| 4:00 PM to 11:59 PM | 4 (3.9%) | 0 (0.0%) |
| Total | 102 (100.0%) | 137 (100.0%) |
Housing Occupancy in Lower Brule
Occupancy by Ownership in Lower Brule
Of the total 202 dwellings in Lower Brule, owner-occupied units account for 34 (16.8%), while renter-occupied units make up 168 (83.2%).
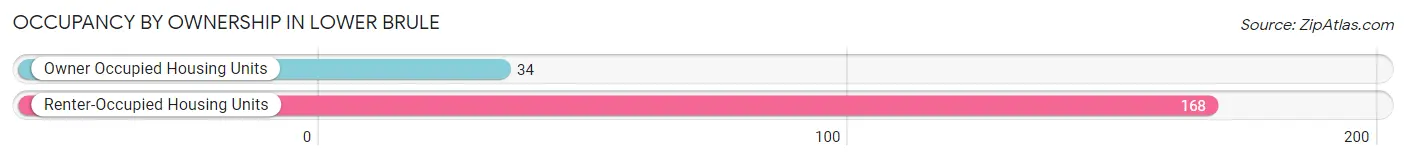
| Occupancy | # Housing Units | % Housing Units |
| Owner Occupied Housing Units | 34 | 16.8% |
| Renter-Occupied Housing Units | 168 | 83.2% |
| Total Occupied Housing Units | 202 | 100.0% |
Occupancy by Household Size in Lower Brule
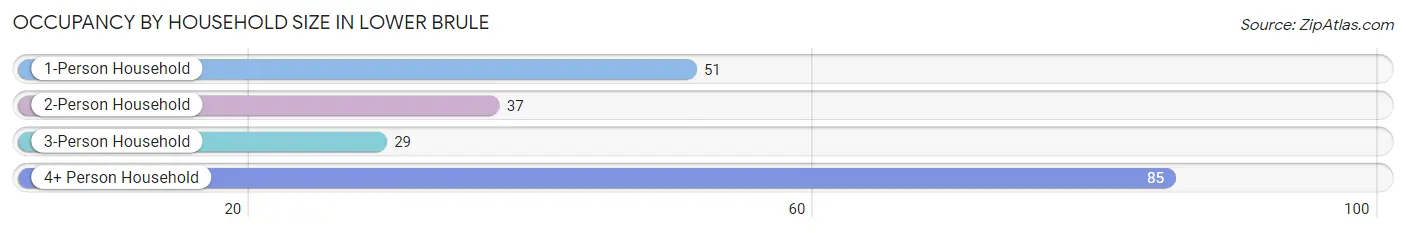
| Household Size | # Housing Units | % Housing Units |
| 1-Person Household | 51 | 25.3% |
| 2-Person Household | 37 | 18.3% |
| 3-Person Household | 29 | 14.4% |
| 4+ Person Household | 85 | 42.1% |
| Total Housing Units | 202 | 100.0% |
Occupancy by Ownership by Household Size in Lower Brule
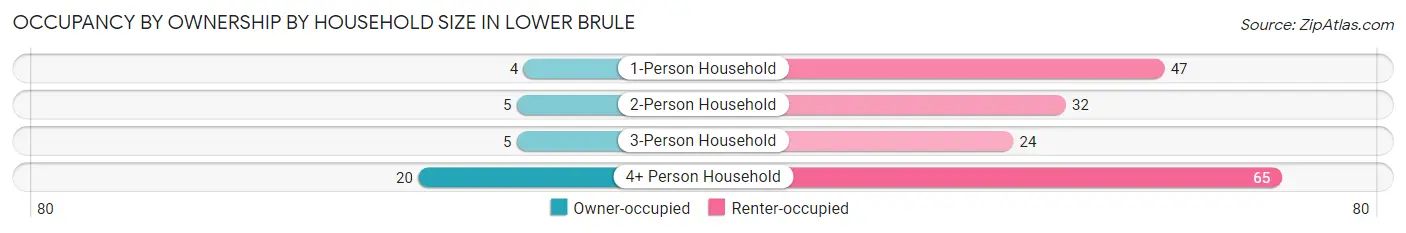
| Household Size | Owner-occupied | Renter-occupied |
| 1-Person Household | 4 (7.8%) | 47 (92.2%) |
| 2-Person Household | 5 (13.5%) | 32 (86.5%) |
| 3-Person Household | 5 (17.2%) | 24 (82.8%) |
| 4+ Person Household | 20 (23.5%) | 65 (76.5%) |
| Total Housing Units | 34 (16.8%) | 168 (83.2%) |
Occupancy by Educational Attainment in Lower Brule
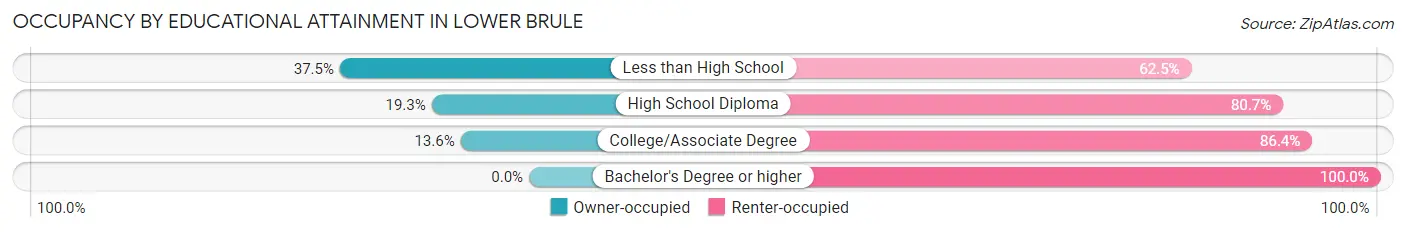
| Household Size | Owner-occupied | Renter-occupied |
| Less than High School | 6 (37.5%) | 10 (62.5%) |
| High School Diploma | 17 (19.3%) | 71 (80.7%) |
| College/Associate Degree | 11 (13.6%) | 70 (86.4%) |
| Bachelor's Degree or higher | 0 (0.0%) | 17 (100.0%) |
Occupancy by Age of Householder in Lower Brule
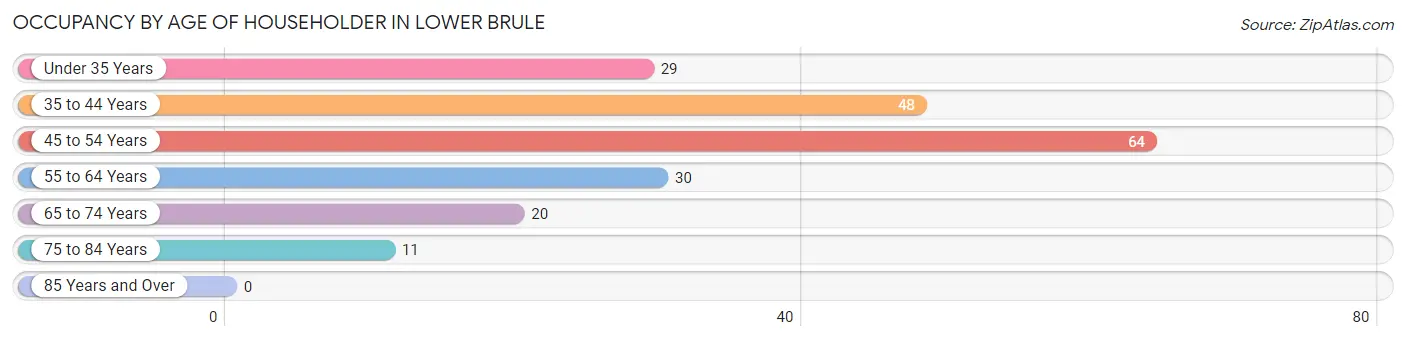
| Age Bracket | # Households | % Households |
| Under 35 Years | 29 | 14.4% |
| 35 to 44 Years | 48 | 23.8% |
| 45 to 54 Years | 64 | 31.7% |
| 55 to 64 Years | 30 | 14.8% |
| 65 to 74 Years | 20 | 9.9% |
| 75 to 84 Years | 11 | 5.4% |
| 85 Years and Over | 0 | 0.0% |
| Total | 202 | 100.0% |
Housing Finances in Lower Brule
Median Income by Occupancy in Lower Brule
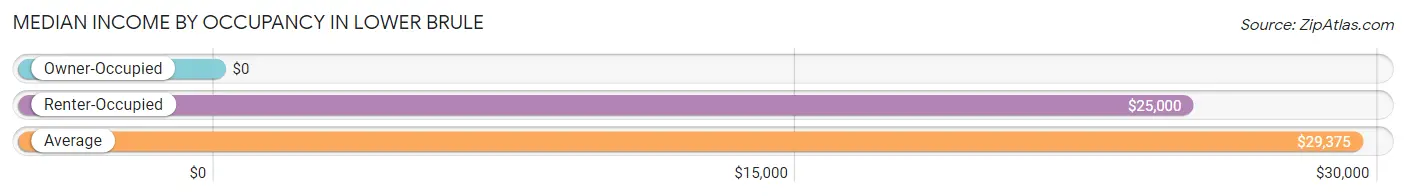
| Occupancy Type | # Households | Median Income |
| Owner-Occupied | 34 (16.8%) | $0 |
| Renter-Occupied | 168 (83.2%) | $25,000 |
| Average | 202 (100.0%) | $29,375 |
Occupancy by Householder Income Bracket in Lower Brule
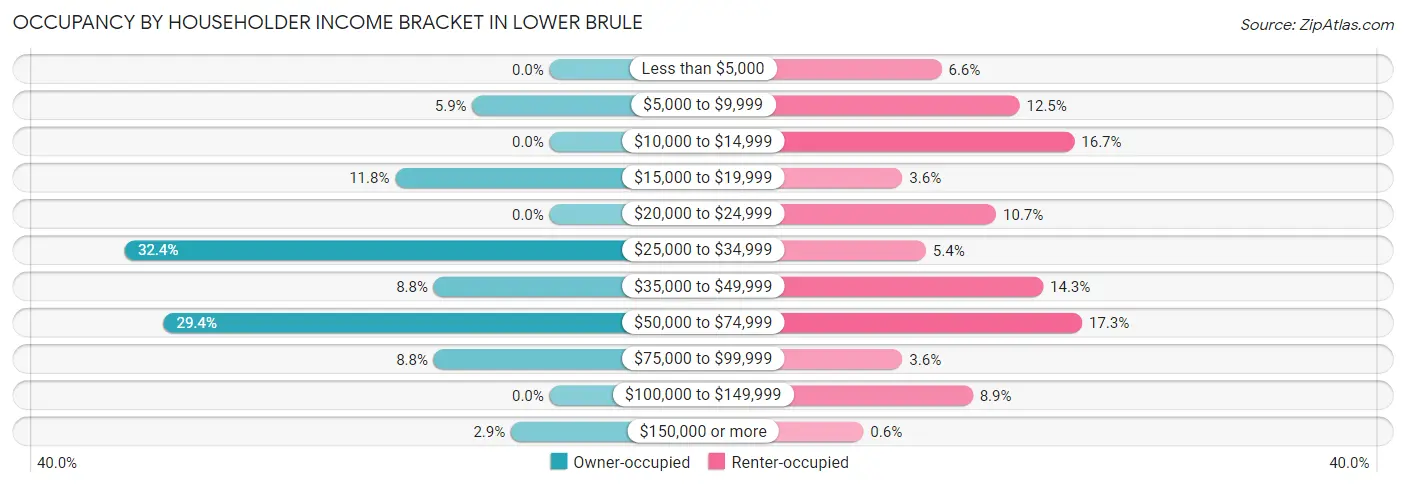
| Income Bracket | Owner-occupied | Renter-occupied |
| Less than $5,000 | 0 (0.0%) | 11 (6.6%) |
| $5,000 to $9,999 | 2 (5.9%) | 21 (12.5%) |
| $10,000 to $14,999 | 0 (0.0%) | 28 (16.7%) |
| $15,000 to $19,999 | 4 (11.8%) | 6 (3.6%) |
| $20,000 to $24,999 | 0 (0.0%) | 18 (10.7%) |
| $25,000 to $34,999 | 11 (32.4%) | 9 (5.4%) |
| $35,000 to $49,999 | 3 (8.8%) | 24 (14.3%) |
| $50,000 to $74,999 | 10 (29.4%) | 29 (17.3%) |
| $75,000 to $99,999 | 3 (8.8%) | 6 (3.6%) |
| $100,000 to $149,999 | 0 (0.0%) | 15 (8.9%) |
| $150,000 or more | 1 (2.9%) | 1 (0.6%) |
| Total | 34 (100.0%) | 168 (100.0%) |
Monthly Housing Cost Tiers in Lower Brule
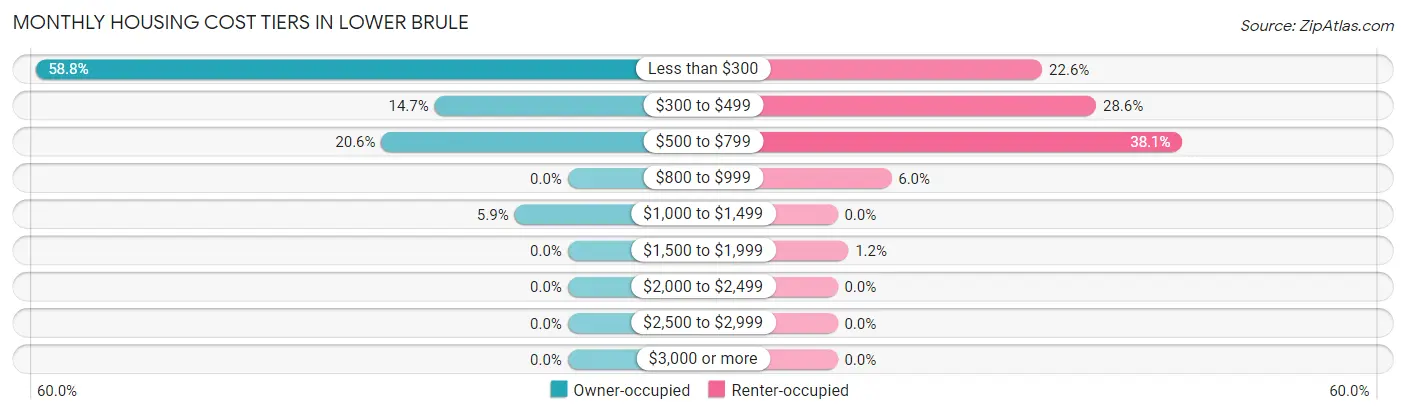
| Monthly Cost | Owner-occupied | Renter-occupied |
| Less than $300 | 20 (58.8%) | 38 (22.6%) |
| $300 to $499 | 5 (14.7%) | 48 (28.6%) |
| $500 to $799 | 7 (20.6%) | 64 (38.1%) |
| $800 to $999 | 0 (0.0%) | 10 (5.9%) |
| $1,000 to $1,499 | 2 (5.9%) | 0 (0.0%) |
| $1,500 to $1,999 | 0 (0.0%) | 2 (1.2%) |
| $2,000 to $2,499 | 0 (0.0%) | 0 (0.0%) |
| $2,500 to $2,999 | 0 (0.0%) | 0 (0.0%) |
| $3,000 or more | 0 (0.0%) | 0 (0.0%) |
| Total | 34 (100.0%) | 168 (100.0%) |
Physical Housing Characteristics in Lower Brule
Housing Structures in Lower Brule
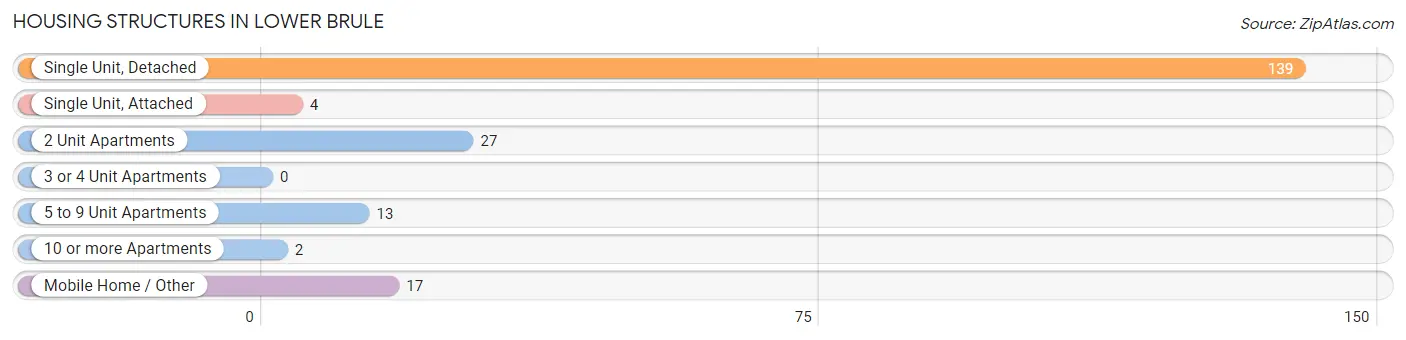
| Structure Type | # Housing Units | % Housing Units |
| Single Unit, Detached | 139 | 68.8% |
| Single Unit, Attached | 4 | 2.0% |
| 2 Unit Apartments | 27 | 13.4% |
| 3 or 4 Unit Apartments | 0 | 0.0% |
| 5 to 9 Unit Apartments | 13 | 6.4% |
| 10 or more Apartments | 2 | 1.0% |
| Mobile Home / Other | 17 | 8.4% |
| Total | 202 | 100.0% |
Housing Structures by Occupancy in Lower Brule
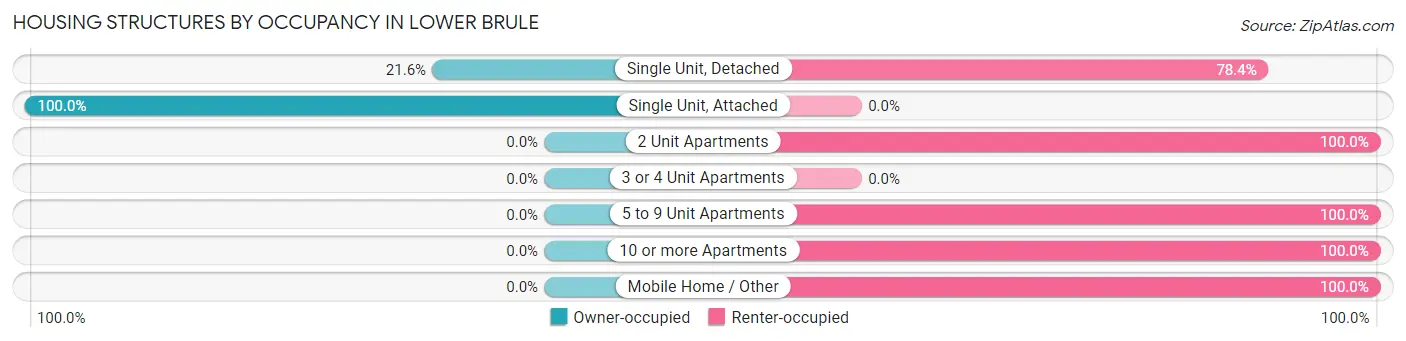
| Structure Type | Owner-occupied | Renter-occupied |
| Single Unit, Detached | 30 (21.6%) | 109 (78.4%) |
| Single Unit, Attached | 4 (100.0%) | 0 (0.0%) |
| 2 Unit Apartments | 0 (0.0%) | 27 (100.0%) |
| 3 or 4 Unit Apartments | 0 (0.0%) | 0 (0.0%) |
| 5 to 9 Unit Apartments | 0 (0.0%) | 13 (100.0%) |
| 10 or more Apartments | 0 (0.0%) | 2 (100.0%) |
| Mobile Home / Other | 0 (0.0%) | 17 (100.0%) |
| Total | 34 (16.8%) | 168 (83.2%) |
Housing Structures by Number of Rooms in Lower Brule
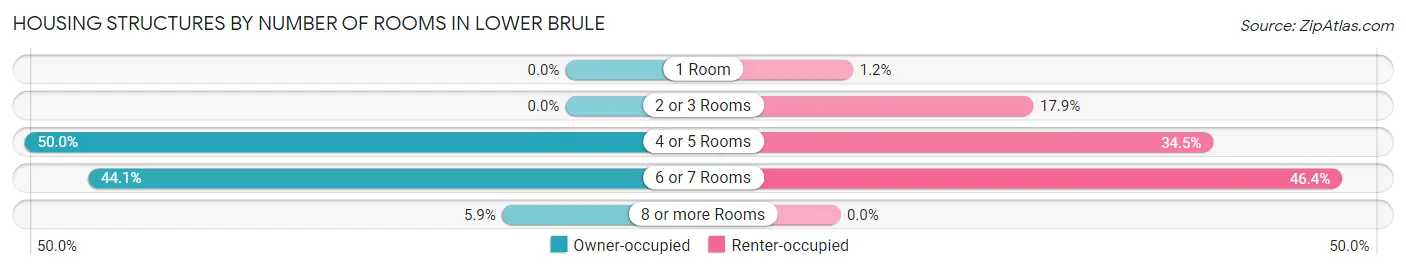
| Number of Rooms | Owner-occupied | Renter-occupied |
| 1 Room | 0 (0.0%) | 2 (1.2%) |
| 2 or 3 Rooms | 0 (0.0%) | 30 (17.9%) |
| 4 or 5 Rooms | 17 (50.0%) | 58 (34.5%) |
| 6 or 7 Rooms | 15 (44.1%) | 78 (46.4%) |
| 8 or more Rooms | 2 (5.9%) | 0 (0.0%) |
| Total | 34 (100.0%) | 168 (100.0%) |
Housing Structure by Heating Type in Lower Brule
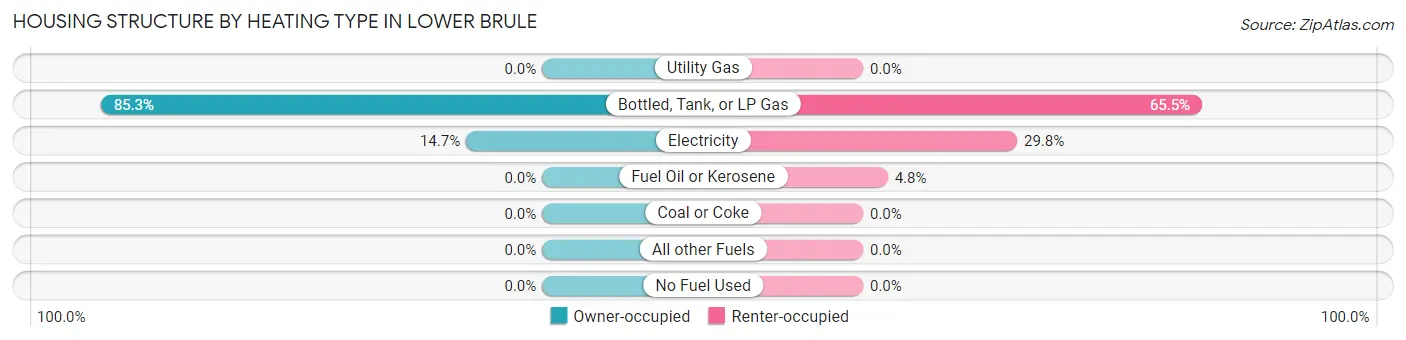
| Heating Type | Owner-occupied | Renter-occupied |
| Utility Gas | 0 (0.0%) | 0 (0.0%) |
| Bottled, Tank, or LP Gas | 29 (85.3%) | 110 (65.5%) |
| Electricity | 5 (14.7%) | 50 (29.8%) |
| Fuel Oil or Kerosene | 0 (0.0%) | 8 (4.8%) |
| Coal or Coke | 0 (0.0%) | 0 (0.0%) |
| All other Fuels | 0 (0.0%) | 0 (0.0%) |
| No Fuel Used | 0 (0.0%) | 0 (0.0%) |
| Total | 34 (100.0%) | 168 (100.0%) |
Household Vehicle Usage in Lower Brule
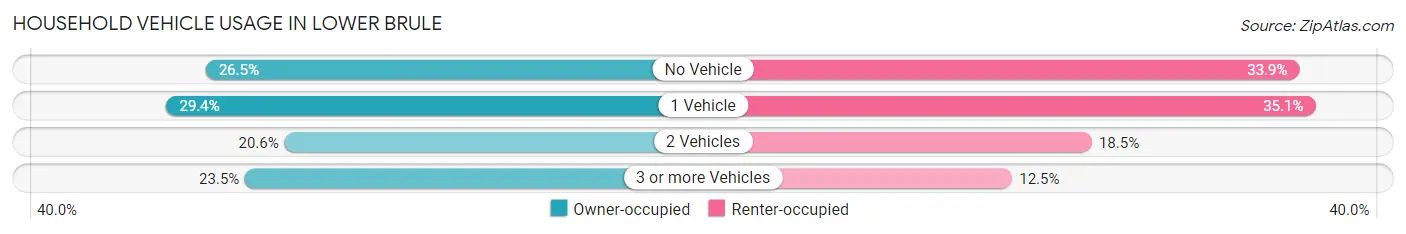
| Vehicles per Household | Owner-occupied | Renter-occupied |
| No Vehicle | 9 (26.5%) | 57 (33.9%) |
| 1 Vehicle | 10 (29.4%) | 59 (35.1%) |
| 2 Vehicles | 7 (20.6%) | 31 (18.4%) |
| 3 or more Vehicles | 8 (23.5%) | 21 (12.5%) |
| Total | 34 (100.0%) | 168 (100.0%) |
Real Estate & Mortgages in Lower Brule
Real Estate and Mortgage Overview in Lower Brule
| Characteristic | Without Mortgage | With Mortgage |
| Housing Units | 34 | 0 |
| Median Property Value | $37,500 | $0 |
| Median Household Income | - | - |
| Monthly Housing Costs | $288 | $0 |
| Real Estate Taxes | - | - |
Property Value by Mortgage Status in Lower Brule
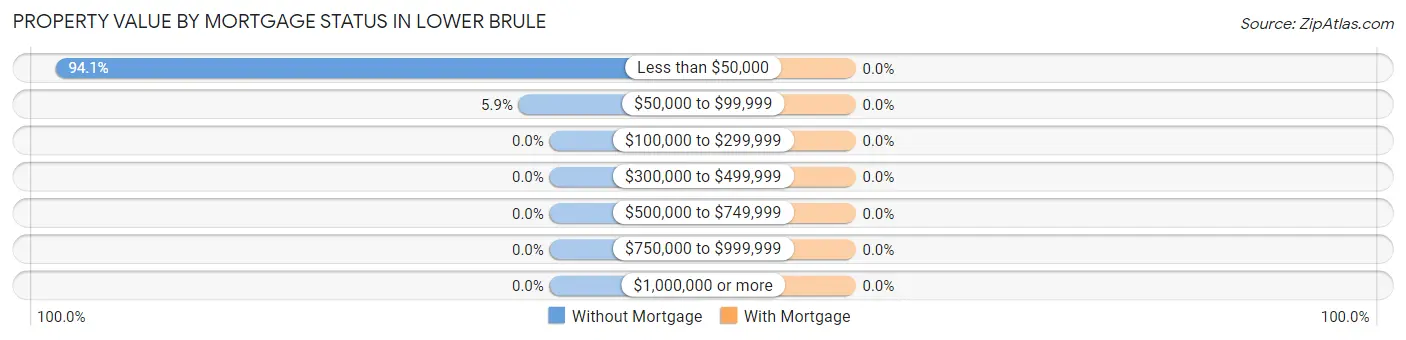
| Property Value | Without Mortgage | With Mortgage |
| Less than $50,000 | 32 (94.1%) | 0 (0.0%) |
| $50,000 to $99,999 | 2 (5.9%) | 0 (0.0%) |
| $100,000 to $299,999 | 0 (0.0%) | 0 (0.0%) |
| $300,000 to $499,999 | 0 (0.0%) | 0 (0.0%) |
| $500,000 to $749,999 | 0 (0.0%) | 0 (0.0%) |
| $750,000 to $999,999 | 0 (0.0%) | 0 (0.0%) |
| $1,000,000 or more | 0 (0.0%) | 0 (0.0%) |
| Total | 34 (100.0%) | 0 (0.0%) |
Household Income by Mortgage Status in Lower Brule
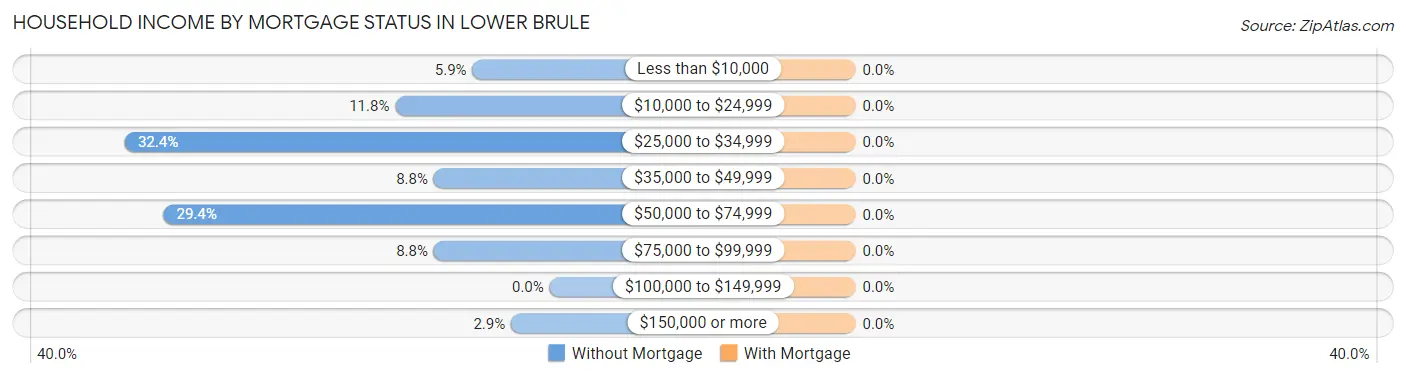
| Household Income | Without Mortgage | With Mortgage |
| Less than $10,000 | 2 (5.9%) | 0 (0.0%) |
| $10,000 to $24,999 | 4 (11.8%) | 0 (0.0%) |
| $25,000 to $34,999 | 11 (32.4%) | 0 (0.0%) |
| $35,000 to $49,999 | 3 (8.8%) | 0 (0.0%) |
| $50,000 to $74,999 | 10 (29.4%) | 0 (0.0%) |
| $75,000 to $99,999 | 3 (8.8%) | 0 (0.0%) |
| $100,000 to $149,999 | 0 (0.0%) | 0 (0.0%) |
| $150,000 or more | 1 (2.9%) | 0 (0.0%) |
| Total | 34 (100.0%) | 0 (0.0%) |
Property Value to Household Income Ratio in Lower Brule
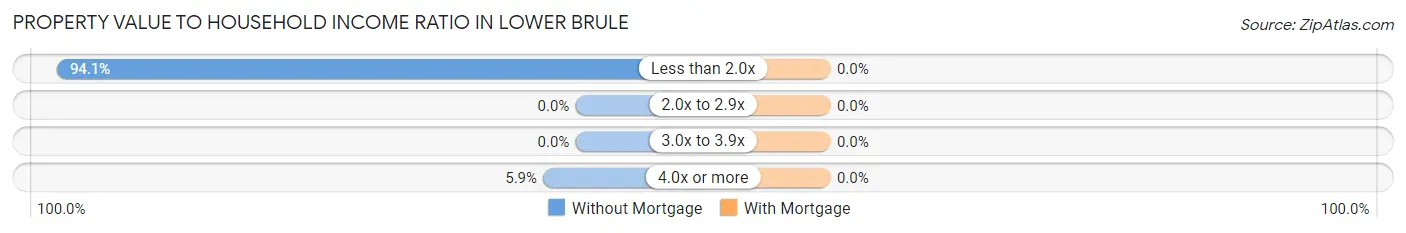
| Value-to-Income Ratio | Without Mortgage | With Mortgage |
| Less than 2.0x | 32 (94.1%) | 0 (0.0%) |
| 2.0x to 2.9x | 0 (0.0%) | 0 (0.0%) |
| 3.0x to 3.9x | 0 (0.0%) | 0 (0.0%) |
| 4.0x or more | 2 (5.9%) | 0 (0.0%) |
| Total | 34 (100.0%) | 0 (0.0%) |
Real Estate Taxes by Mortgage Status in Lower Brule
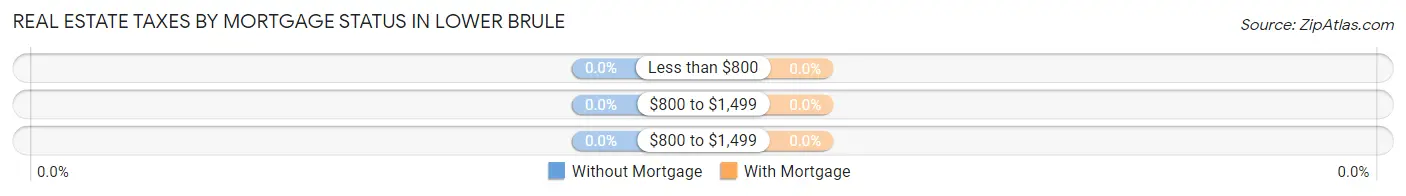
| Property Taxes | Without Mortgage | With Mortgage |
| Less than $800 | 0 (0.0%) | 0 (0.0%) |
| $800 to $1,499 | 0 (0.0%) | 0 (0.0%) |
| $800 to $1,499 | 0 (0.0%) | 0 (0.0%) |
| Total | 34 (100.0%) | 0 (0.0%) |
Health & Disability in Lower Brule
Health Insurance Coverage by Age in Lower Brule
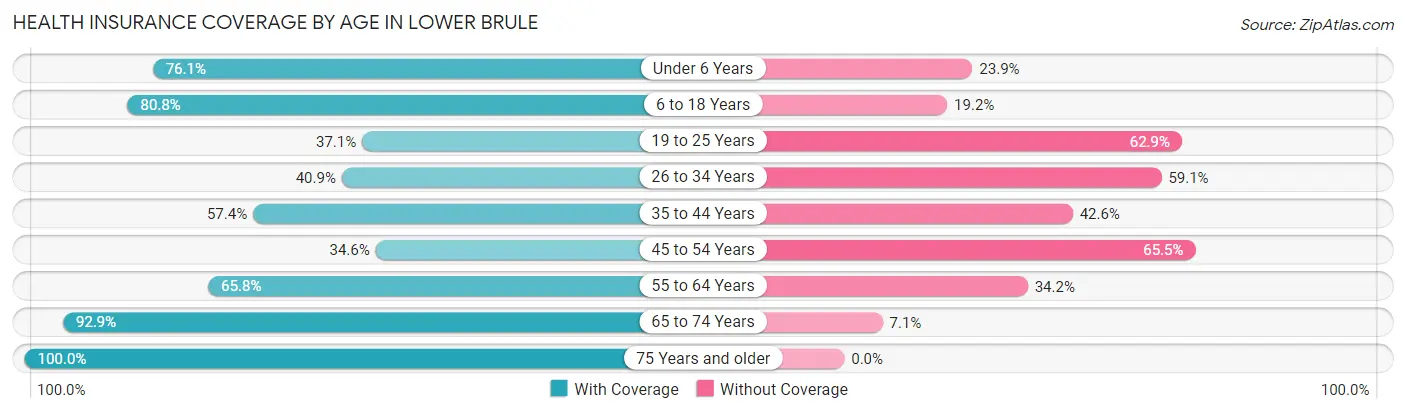
| Age Bracket | With Coverage | Without Coverage |
| Under 6 Years | 86 (76.1%) | 27 (23.9%) |
| 6 to 18 Years | 177 (80.8%) | 42 (19.2%) |
| 19 to 25 Years | 43 (37.1%) | 73 (62.9%) |
| 26 to 34 Years | 38 (40.9%) | 55 (59.1%) |
| 35 to 44 Years | 62 (57.4%) | 46 (42.6%) |
| 45 to 54 Years | 38 (34.5%) | 72 (65.4%) |
| 55 to 64 Years | 25 (65.8%) | 13 (34.2%) |
| 65 to 74 Years | 39 (92.9%) | 3 (7.1%) |
| 75 Years and older | 53 (100.0%) | 0 (0.0%) |
| Total | 561 (62.9%) | 331 (37.1%) |
Health Insurance Coverage by Citizenship Status in Lower Brule
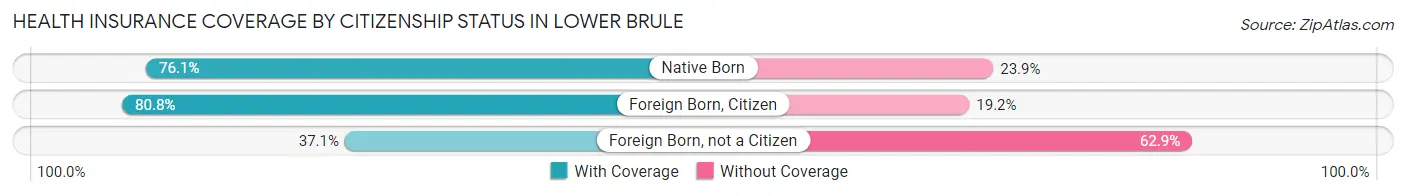
| Citizenship Status | With Coverage | Without Coverage |
| Native Born | 86 (76.1%) | 27 (23.9%) |
| Foreign Born, Citizen | 177 (80.8%) | 42 (19.2%) |
| Foreign Born, not a Citizen | 43 (37.1%) | 73 (62.9%) |
Health Insurance Coverage by Household Income in Lower Brule
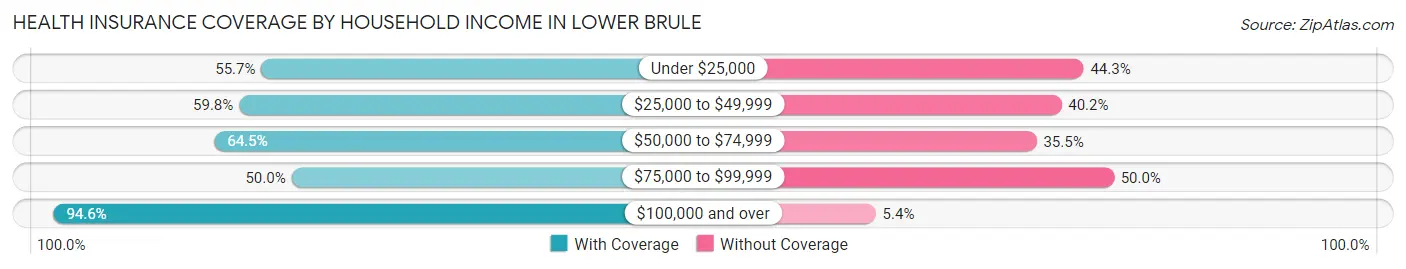
| Household Income | With Coverage | Without Coverage |
| Under $25,000 | 177 (55.7%) | 141 (44.3%) |
| $25,000 to $49,999 | 125 (59.8%) | 84 (40.2%) |
| $50,000 to $74,999 | 107 (64.5%) | 59 (35.5%) |
| $75,000 to $99,999 | 28 (50.0%) | 28 (50.0%) |
| $100,000 and over | 70 (94.6%) | 4 (5.4%) |
Public vs Private Health Insurance Coverage by Age in Lower Brule
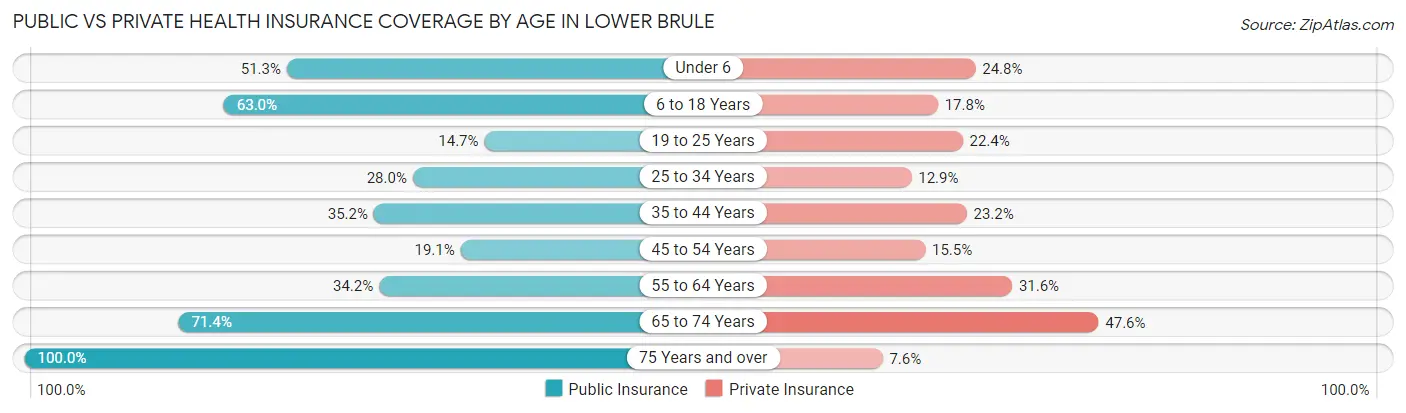
| Age Bracket | Public Insurance | Private Insurance |
| Under 6 | 58 (51.3%) | 28 (24.8%) |
| 6 to 18 Years | 138 (63.0%) | 39 (17.8%) |
| 19 to 25 Years | 17 (14.7%) | 26 (22.4%) |
| 25 to 34 Years | 26 (28.0%) | 12 (12.9%) |
| 35 to 44 Years | 38 (35.2%) | 25 (23.2%) |
| 45 to 54 Years | 21 (19.1%) | 17 (15.4%) |
| 55 to 64 Years | 13 (34.2%) | 12 (31.6%) |
| 65 to 74 Years | 30 (71.4%) | 20 (47.6%) |
| 75 Years and over | 53 (100.0%) | 4 (7.5%) |
| Total | 394 (44.2%) | 183 (20.5%) |
Disability Status by Sex by Age in Lower Brule
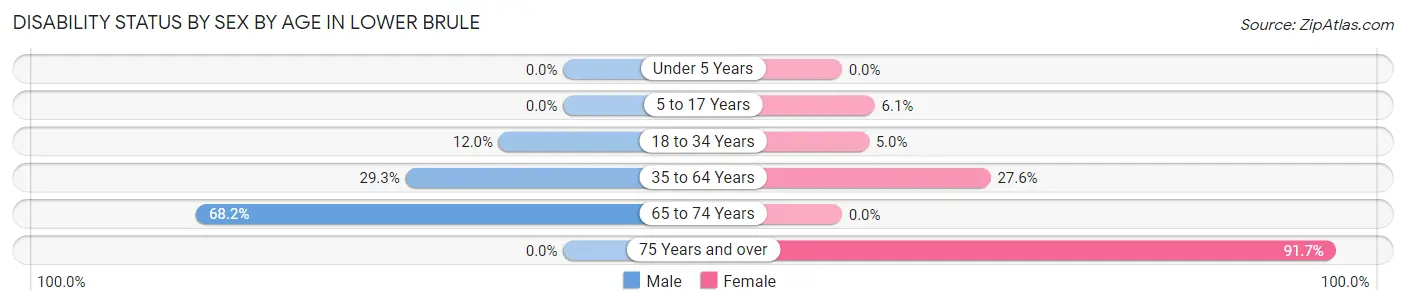
| Age Bracket | Male | Female |
| Under 5 Years | 0 (0.0%) | 0 (0.0%) |
| 5 to 17 Years | 0 (0.0%) | 7 (6.1%) |
| 18 to 34 Years | 14 (12.0%) | 5 (5.0%) |
| 35 to 64 Years | 41 (29.3%) | 32 (27.6%) |
| 65 to 74 Years | 15 (68.2%) | 0 (0.0%) |
| 75 Years and over | 0 (0.0%) | 44 (91.7%) |
Disability Class by Sex by Age in Lower Brule
Disability Class: Hearing Difficulty
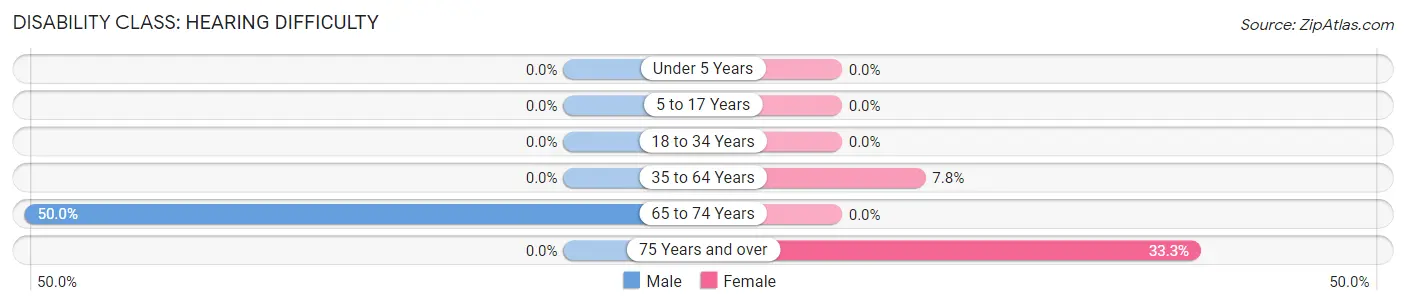
| Age Bracket | Male | Female |
| Under 5 Years | 0 (0.0%) | 0 (0.0%) |
| 5 to 17 Years | 0 (0.0%) | 0 (0.0%) |
| 18 to 34 Years | 0 (0.0%) | 0 (0.0%) |
| 35 to 64 Years | 0 (0.0%) | 9 (7.8%) |
| 65 to 74 Years | 11 (50.0%) | 0 (0.0%) |
| 75 Years and over | 0 (0.0%) | 16 (33.3%) |
Disability Class: Vision Difficulty
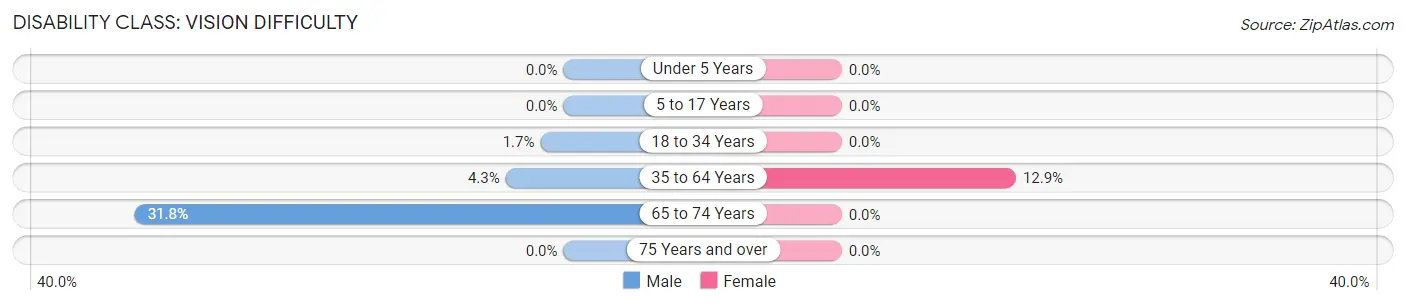
| Age Bracket | Male | Female |
| Under 5 Years | 0 (0.0%) | 0 (0.0%) |
| 5 to 17 Years | 0 (0.0%) | 0 (0.0%) |
| 18 to 34 Years | 2 (1.7%) | 0 (0.0%) |
| 35 to 64 Years | 6 (4.3%) | 15 (12.9%) |
| 65 to 74 Years | 7 (31.8%) | 0 (0.0%) |
| 75 Years and over | 0 (0.0%) | 0 (0.0%) |
Disability Class: Cognitive Difficulty
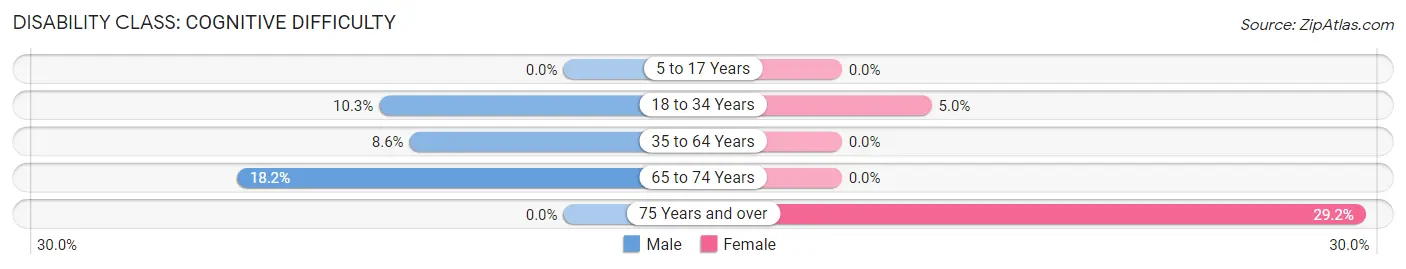
| Age Bracket | Male | Female |
| 5 to 17 Years | 0 (0.0%) | 0 (0.0%) |
| 18 to 34 Years | 12 (10.3%) | 5 (5.0%) |
| 35 to 64 Years | 12 (8.6%) | 0 (0.0%) |
| 65 to 74 Years | 4 (18.2%) | 0 (0.0%) |
| 75 Years and over | 0 (0.0%) | 14 (29.2%) |
Disability Class: Ambulatory Difficulty
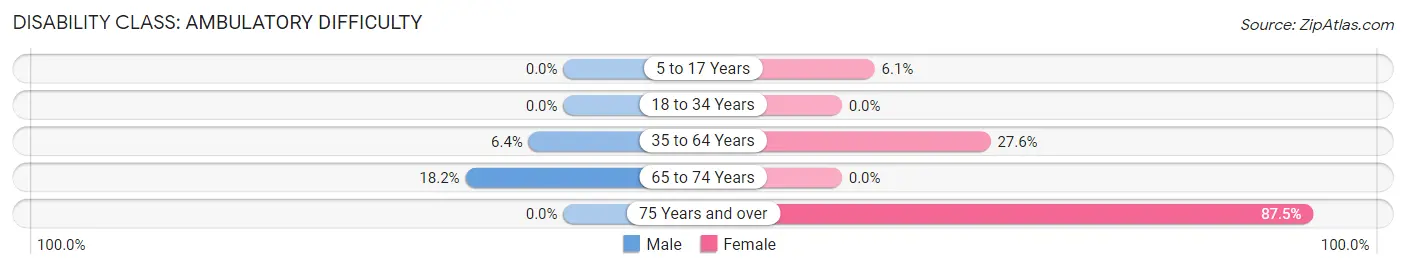
| Age Bracket | Male | Female |
| 5 to 17 Years | 0 (0.0%) | 7 (6.1%) |
| 18 to 34 Years | 0 (0.0%) | 0 (0.0%) |
| 35 to 64 Years | 9 (6.4%) | 32 (27.6%) |
| 65 to 74 Years | 4 (18.2%) | 0 (0.0%) |
| 75 Years and over | 0 (0.0%) | 42 (87.5%) |
Disability Class: Self-Care Difficulty
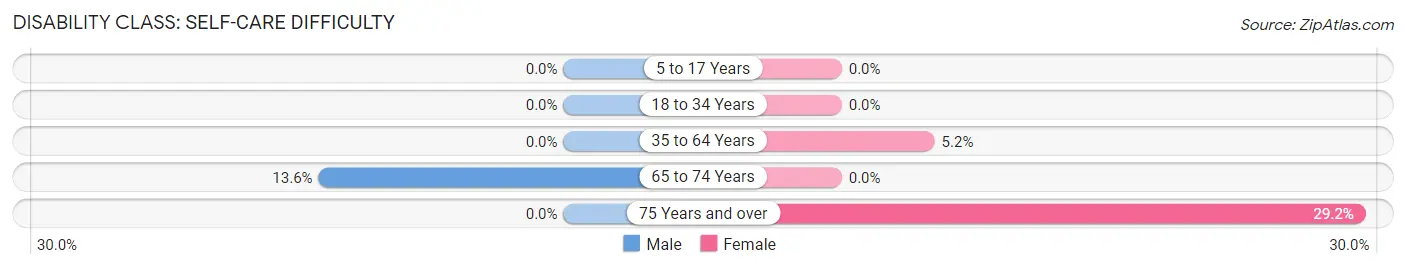
| Age Bracket | Male | Female |
| 5 to 17 Years | 0 (0.0%) | 0 (0.0%) |
| 18 to 34 Years | 0 (0.0%) | 0 (0.0%) |
| 35 to 64 Years | 0 (0.0%) | 6 (5.2%) |
| 65 to 74 Years | 3 (13.6%) | 0 (0.0%) |
| 75 Years and over | 0 (0.0%) | 14 (29.2%) |
Technology Access in Lower Brule
Computing Device Access in Lower Brule
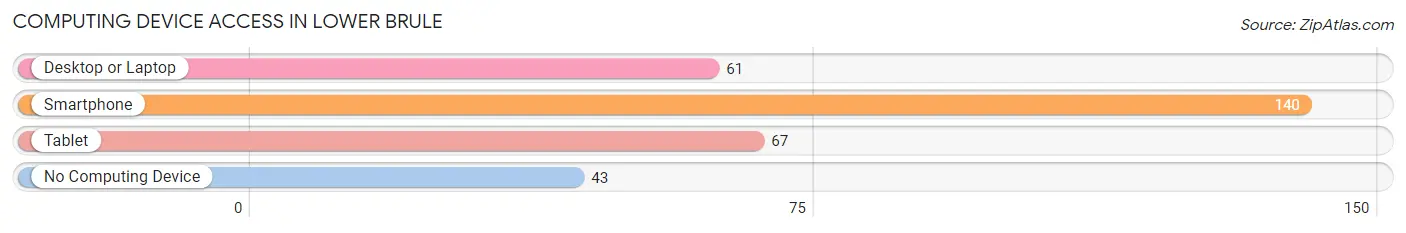
| Device Type | # Households | % Households |
| Desktop or Laptop | 61 | 30.2% |
| Smartphone | 140 | 69.3% |
| Tablet | 67 | 33.2% |
| No Computing Device | 43 | 21.3% |
| Total | 202 | 100.0% |
Internet Access in Lower Brule
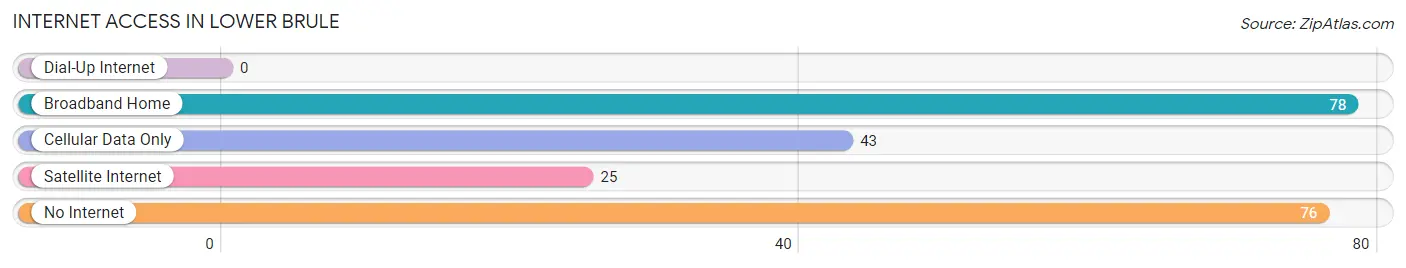
| Internet Type | # Households | % Households |
| Dial-Up Internet | 0 | 0.0% |
| Broadband Home | 78 | 38.6% |
| Cellular Data Only | 43 | 21.3% |
| Satellite Internet | 25 | 12.4% |
| No Internet | 76 | 37.6% |
| Total | 202 | 100.0% |
Lower Brule Summary
Introduction
Lower Brule is a small town located in Lyman County, South Dakota, United States. It is situated on the banks of the Missouri River, and is home to the Lower Brule Sioux Tribe. The town has a population of approximately 1,000 people, and is the administrative center of the Lower Brule Sioux Reservation. The town is known for its rich history, diverse geography, and vibrant economy.
History
The Lower Brule Sioux Tribe has a long and rich history in the area. The tribe has been living in the area since the late 1700s, when they were forced to move from their traditional homelands in Minnesota and Wisconsin. The tribe was originally part of the Great Sioux Nation, and was part of the Treaty of Fort Laramie in 1868. This treaty established the Great Sioux Reservation, which included the Lower Brule Sioux Reservation.
The town of Lower Brule was established in 1881, when the Lower Brule Sioux Tribe was granted a reservation by the United States government. The town was named after Chief Brule, a leader of the tribe. The town was originally a trading post, and was used as a base for the tribe’s buffalo hunts.
In the early 1900s, the town began to grow and develop. The first school was built in 1910, and the first post office was established in 1911. The town was incorporated in 1912, and the first newspaper was published in 1913.
Geography
Lower Brule is located in Lyman County, South Dakota, United States. It is situated on the banks of the Missouri River, and is surrounded by rolling hills and prairies. The town is located in the Central Plains region of the United States, and is part of the Great Plains region.
The town is located in the Central Time Zone, and has a humid continental climate. The average temperature in the summer is around 75°F, and the average temperature in the winter is around 25°F. The town receives an average of 25 inches of precipitation per year.
Economy
The economy of Lower Brule is largely based on agriculture and tourism. The town is home to several farms, which produce a variety of crops, including corn, soybeans, wheat, and hay. The town is also home to several tourist attractions, including the Lower Brule Sioux Reservation, the Lower Brule Wildlife Refuge, and the Lower Brule State Park.
The town is also home to several businesses, including a grocery store, a gas station, a hardware store, and a restaurant. The town is also home to several government offices, including the Lower Brule Sioux Tribe, the Lower Brule Sioux Tribal Council, and the Lower Brule Sioux Tribal Court.
Demographics
As of the 2010 census, the population of Lower Brule was 1,099. The town is predominantly Native American, with the majority of the population being members of the Lower Brule Sioux Tribe. The town also has a small population of non-Native Americans, including African Americans, Hispanics, and Asians.
The median household income in Lower Brule is $25,000, and the median family income is $30,000. The town has a poverty rate of 28.3%, and the unemployment rate is 8.3%.
Conclusion
Lower Brule is a small town located in Lyman County, South Dakota, United States. It is situated on the banks of the Missouri River, and is home to the Lower Brule Sioux Tribe. The town has a rich history, diverse geography, and vibrant economy. The town is predominantly Native American, and is home to several businesses, farms, and tourist attractions. The town has a median household income of $25,000, and a poverty rate of 28.3%.
Common Questions
What is the Total Population of Lower Brule?
Total Population of Lower Brule is 892.
What is the Total Male Population of Lower Brule?
Total Male Population of Lower Brule is 470.
What is the Total Female Population of Lower Brule?
Total Female Population of Lower Brule is 422.
What is the Ratio of Males per 100 Females in Lower Brule?
There are 111.37 Males per 100 Females in Lower Brule.
What is the Ratio of Females per 100 Males in Lower Brule?
There are 89.79 Females per 100 Males in Lower Brule.
What is the Median Population Age in Lower Brule?
Median Population Age in Lower Brule is 25.7 Years.
What is the Average Family Size in Lower Brule
Average Family Size in Lower Brule is 5.0 People.
What is the Average Household Size in Lower Brule
Average Household Size in Lower Brule is 4.1 People.
What is Per Capita Income in Lower Brule?
Per Capita income in Lower Brule is $12,035.
What is the Median Family Income in Lower Brule?
Median Family Income in Lower Brule is $30,500.
What is the Median Household income in Lower Brule?
Median Household Income in Lower Brule is $29,375.
What is Income or Wage Gap in Lower Brule?
Income or Wage Gap in Lower Brule is 31.6%.
Women in Lower Brule earn 68.4 cents for every dollar earned by a man.
What is Inequality or Gini Index in Lower Brule?
Inequality or Gini Index in Lower Brule is 0.46.
How Large is the Labor Force in Lower Brule?
There are 270 People in the Labor Forcein in Lower Brule.
What is the Percentage of People in the Labor Force in Lower Brule?
46.5% of People are in the Labor Force in Lower Brule.
What is the Unemployment Rate in Lower Brule?
Unemployment Rate in Lower Brule is 8.9%.