Chamberlain, SD
Chamberlain Map
Chamberlain Overview
2,538
TOTAL POPULATION
1,302
MALE POPULATION
1,236
FEMALE POPULATION
105.34
MALES / 100 FEMALES
94.93
FEMALES / 100 MALES
40.6
MEDIAN AGE
3.5
AVG FAMILY SIZE
2.6
AVG HOUSEHOLD SIZE
$34,814
PER CAPITA INCOME
$98,750
AVG FAMILY INCOME
$59,375
AVG HOUSEHOLD INCOME
26.7%
WAGE / INCOME GAP [ % ]
73.3¢/ $1
WAGE / INCOME GAP [ $ ]
0.49
INEQUALITY / GINI INDEX
1,348
LABOR FORCE [ PEOPLE ]
66.5%
PERCENT IN LABOR FORCE
3.5%
UNEMPLOYMENT RATE
Chamberlain Zip Codes
Chamberlain Area Codes
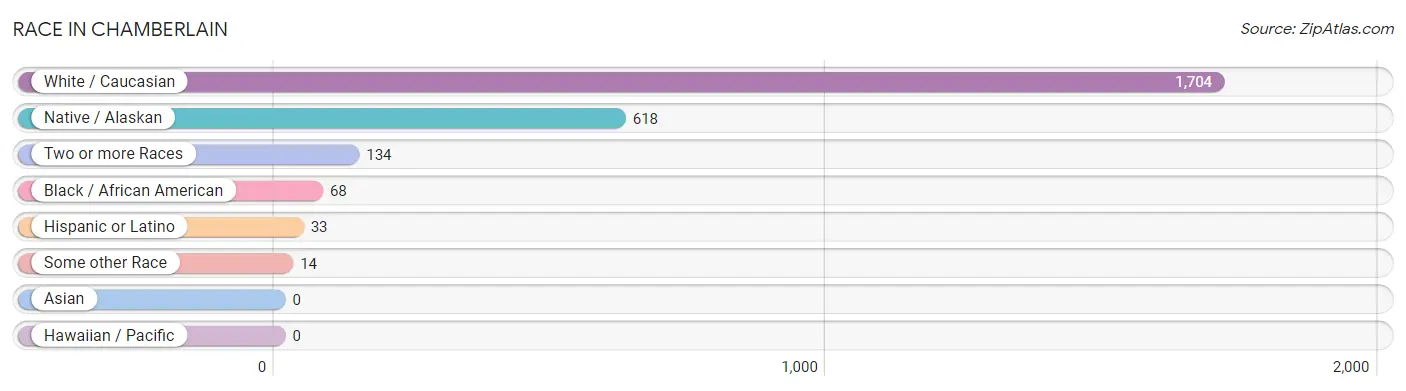
Race in Chamberlain
The most populous races in Chamberlain are White / Caucasian (1,704 | 67.1%), Native / Alaskan (618 | 24.3%), and Two or more Races (134 | 5.3%).
| Race | # Population | % Population |
| Asian | 0 | 0.0% |
| Black / African American | 68 | 2.7% |
| Hawaiian / Pacific | 0 | 0.0% |
| Hispanic or Latino | 33 | 1.3% |
| Native / Alaskan | 618 | 24.3% |
| White / Caucasian | 1,704 | 67.1% |
| Two or more Races | 134 | 5.3% |
| Some other Race | 14 | 0.5% |
| Total | 2,538 | 100.0% |
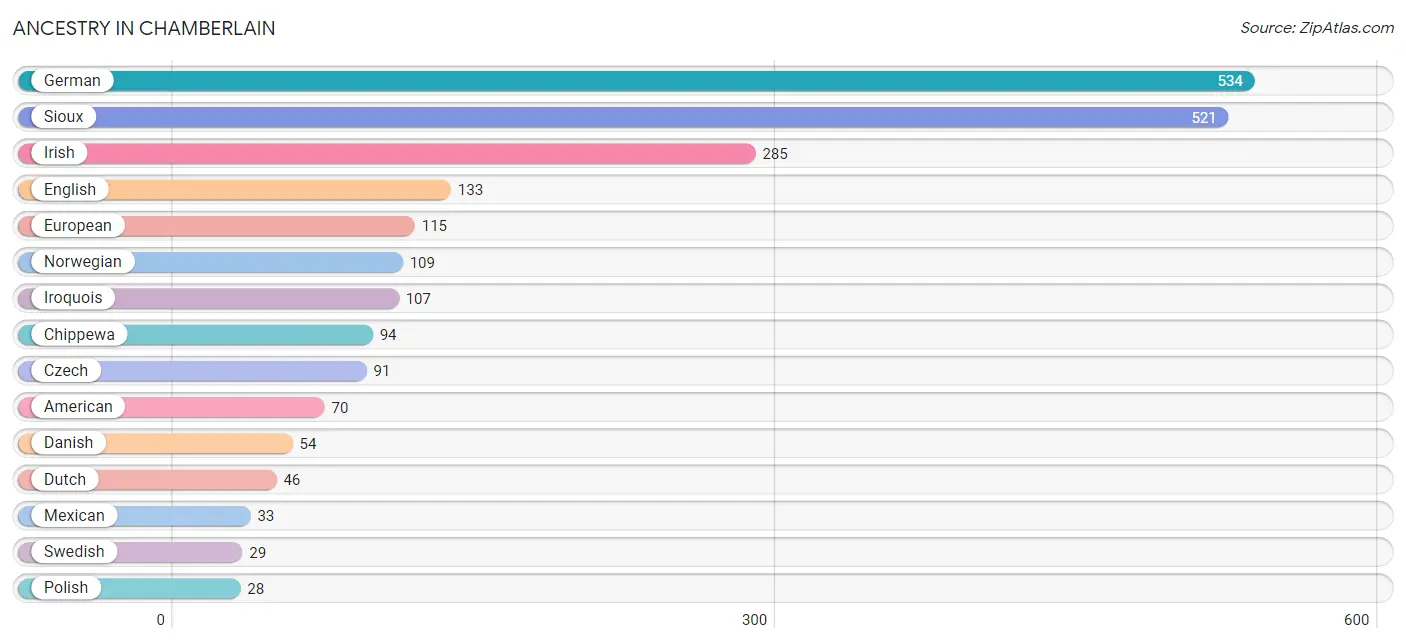
Ancestry in Chamberlain
The most populous ancestries reported in Chamberlain are German (534 | 21.0%), Sioux (521 | 20.5%), Irish (285 | 11.2%), English (133 | 5.2%), and European (115 | 4.5%), together accounting for 62.6% of all Chamberlain residents.
| Ancestry | # Population | % Population |
| American | 70 | 2.8% |
| British | 2 | 0.1% |
| Celtic | 3 | 0.1% |
| Cherokee | 6 | 0.2% |
| Chippewa | 94 | 3.7% |
| Crow | 21 | 0.8% |
| Czech | 91 | 3.6% |
| Danish | 54 | 2.1% |
| Dutch | 46 | 1.8% |
| Eastern European | 4 | 0.2% |
| English | 133 | 5.2% |
| European | 115 | 4.5% |
| Finnish | 6 | 0.2% |
| French | 17 | 0.7% |
| French Canadian | 20 | 0.8% |
| German | 534 | 21.0% |
| Greek | 4 | 0.2% |
| Irish | 285 | 11.2% |
| Iroquois | 107 | 4.2% |
| Italian | 23 | 0.9% |
| Mexican | 33 | 1.3% |
| Norwegian | 109 | 4.3% |
| Polish | 28 | 1.1% |
| Russian | 12 | 0.5% |
| Scandinavian | 4 | 0.2% |
| Scotch-Irish | 7 | 0.3% |
| Scottish | 26 | 1.0% |
| Sioux | 521 | 20.5% |
| Swedish | 29 | 1.1% |
| Swiss | 11 | 0.4% |
| Welsh | 6 | 0.2% | View All 31 Rows |
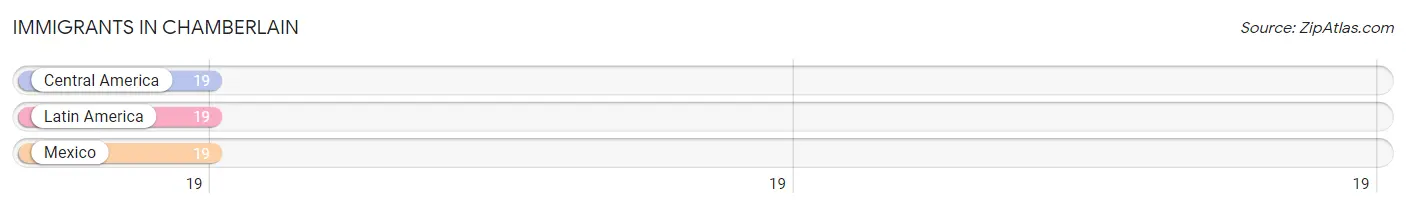
Immigrants in Chamberlain
The most numerous immigrant groups reported in Chamberlain came from Central America (19 | 0.7%), Latin America (19 | 0.7%), and Mexico (19 | 0.7%), together accounting for 2.2% of all Chamberlain residents.
| Immigration Origin | # Population | % Population |
| Central America | 19 | 0.7% |
| Latin America | 19 | 0.7% |
| Mexico | 19 | 0.7% | View All 3 Rows |
Sex and Age in Chamberlain
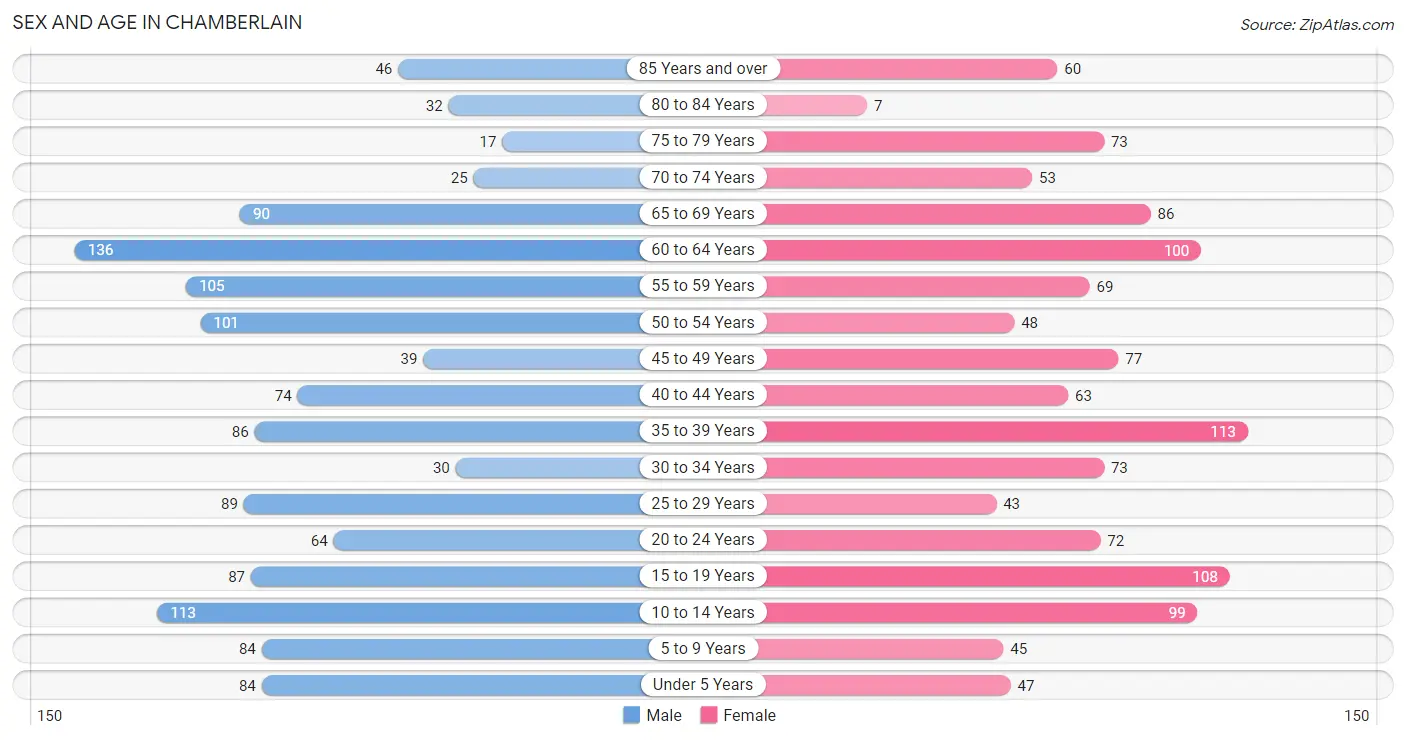
Sex and Age in Chamberlain
The most populous age groups in Chamberlain are 60 to 64 Years (136 | 10.4%) for men and 35 to 39 Years (113 | 9.1%) for women.
| Age Bracket | Male | Female |
| Under 5 Years | 84 (6.5%) | 47 (3.8%) |
| 5 to 9 Years | 84 (6.5%) | 45 (3.6%) |
| 10 to 14 Years | 113 (8.7%) | 99 (8.0%) |
| 15 to 19 Years | 87 (6.7%) | 108 (8.7%) |
| 20 to 24 Years | 64 (4.9%) | 72 (5.8%) |
| 25 to 29 Years | 89 (6.8%) | 43 (3.5%) |
| 30 to 34 Years | 30 (2.3%) | 73 (5.9%) |
| 35 to 39 Years | 86 (6.6%) | 113 (9.1%) |
| 40 to 44 Years | 74 (5.7%) | 63 (5.1%) |
| 45 to 49 Years | 39 (3.0%) | 77 (6.2%) |
| 50 to 54 Years | 101 (7.8%) | 48 (3.9%) |
| 55 to 59 Years | 105 (8.1%) | 69 (5.6%) |
| 60 to 64 Years | 136 (10.4%) | 100 (8.1%) |
| 65 to 69 Years | 90 (6.9%) | 86 (7.0%) |
| 70 to 74 Years | 25 (1.9%) | 53 (4.3%) |
| 75 to 79 Years | 17 (1.3%) | 73 (5.9%) |
| 80 to 84 Years | 32 (2.5%) | 7 (0.6%) |
| 85 Years and over | 46 (3.5%) | 60 (4.9%) |
| Total | 1,302 (100.0%) | 1,236 (100.0%) |
Families and Households in Chamberlain
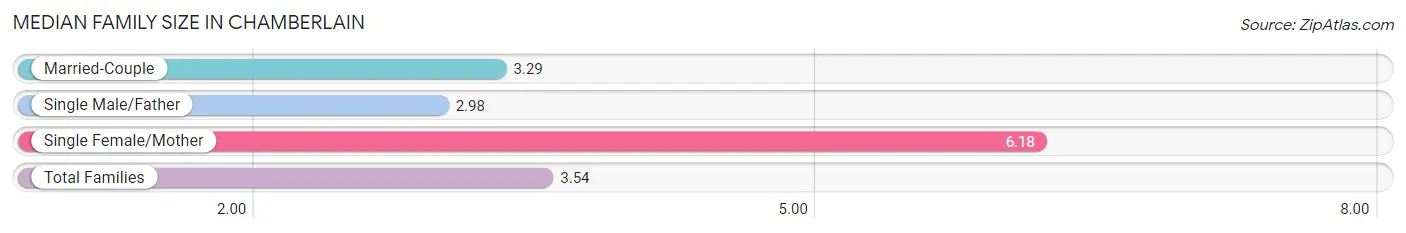
Median Family Size in Chamberlain
The median family size in Chamberlain is 3.54 persons per family, with single female/mother families (49 | 9.6%) accounting for the largest median family size of 6.18 persons per family. On the other hand, single male/father families (57 | 11.1%) represent the smallest median family size with 2.98 persons per family.
| Family Type | # Families | Family Size |
| Married-Couple | 407 (79.3%) | 3.29 |
| Single Male/Father | 57 (11.1%) | 2.98 |
| Single Female/Mother | 49 (9.6%) | 6.18 |
| Total Families | 513 (100.0%) | 3.54 |
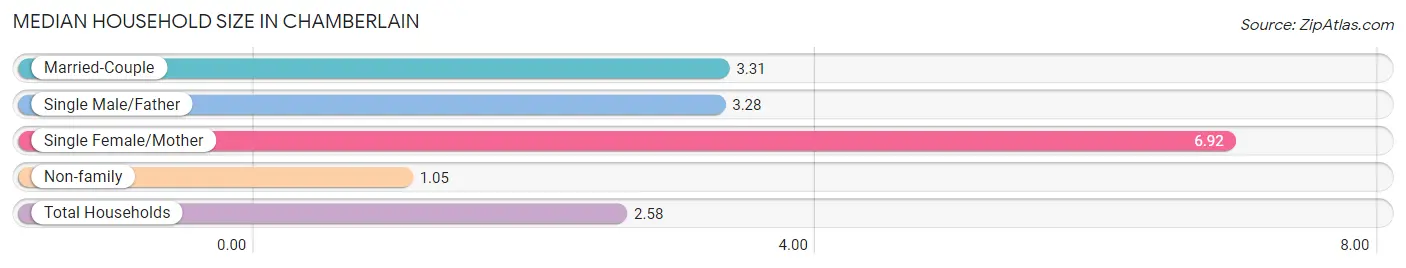
Median Household Size in Chamberlain
The median household size in Chamberlain is 2.58 persons per household, with single female/mother households (49 | 5.6%) accounting for the largest median household size of 6.92 persons per household. non-family households (358 | 41.1%) represent the smallest median household size with 1.05 persons per household.
| Household Type | # Households | Household Size |
| Married-Couple | 407 (46.7%) | 3.31 |
| Single Male/Father | 57 (6.5%) | 3.28 |
| Single Female/Mother | 49 (5.6%) | 6.92 |
| Non-family | 358 (41.1%) | 1.05 |
| Total Households | 871 (100.0%) | 2.58 |
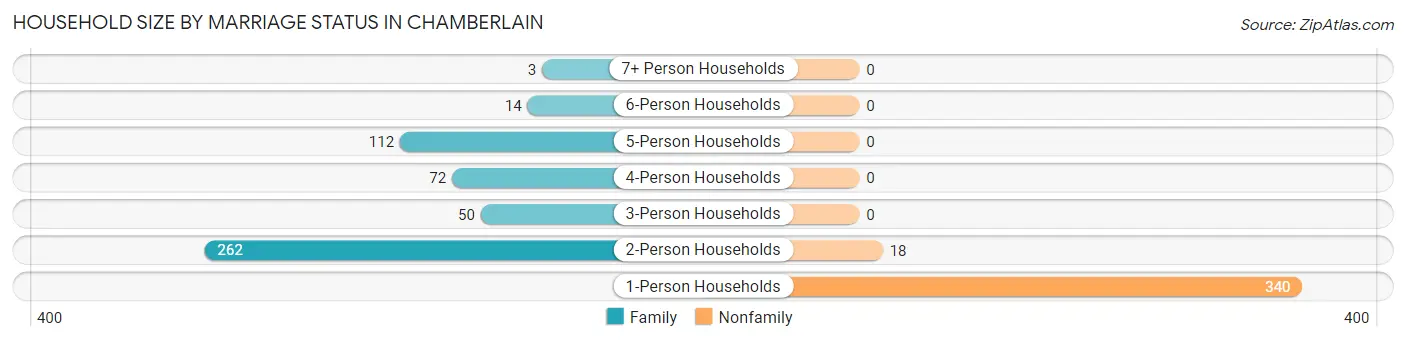
Household Size by Marriage Status in Chamberlain
Out of a total of 871 households in Chamberlain, 513 (58.9%) are family households, while 358 (41.1%) are nonfamily households. The most numerous type of family households are 2-person households, comprising 262, and the most common type of nonfamily households are 1-person households, comprising 340.
| Household Size | Family Households | Nonfamily Households |
| 1-Person Households | - | 340 (39.0%) |
| 2-Person Households | 262 (30.1%) | 18 (2.1%) |
| 3-Person Households | 50 (5.7%) | 0 (0.0%) |
| 4-Person Households | 72 (8.3%) | 0 (0.0%) |
| 5-Person Households | 112 (12.9%) | 0 (0.0%) |
| 6-Person Households | 14 (1.6%) | 0 (0.0%) |
| 7+ Person Households | 3 (0.3%) | 0 (0.0%) |
| Total | 513 (58.9%) | 358 (41.1%) |
Female Fertility in Chamberlain
Fertility by Age in Chamberlain
Average fertility rate in Chamberlain is 63.0 births per 1,000 women. Women in the age bracket of 20 to 34 years have the highest fertility rate with 149.0 births per 1,000 women. Women in the age bracket of 20 to 34 years acount for 80.0% of all women with births.
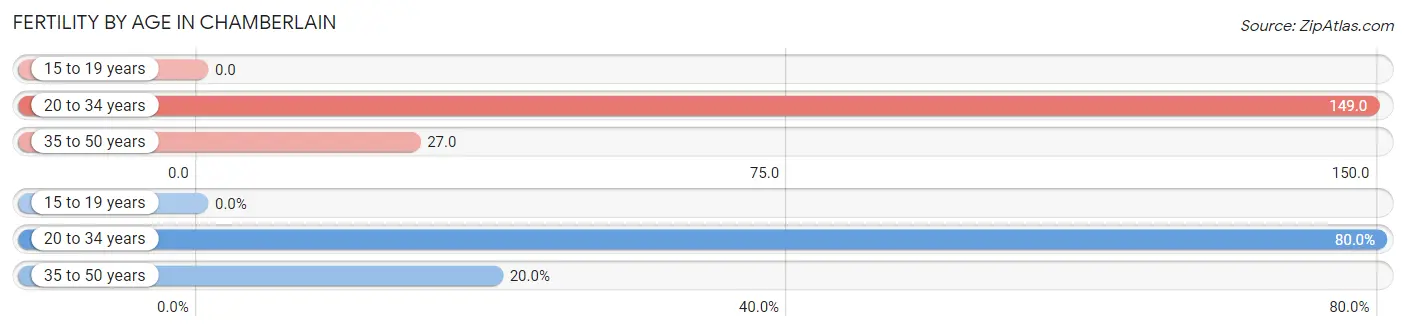
| Age Bracket | Women with Births | Births / 1,000 Women |
| 15 to 19 years | 0 (0.0%) | 0.0 |
| 20 to 34 years | 28 (80.0%) | 149.0 |
| 35 to 50 years | 7 (20.0%) | 27.0 |
| Total | 35 (100.0%) | 63.0 |
Fertility by Age by Marriage Status in Chamberlain
48.6% of women with births (35) in Chamberlain are married. The highest percentage of unmarried women with births falls into 20 to 34 years age bracket with 64.3% of them unmarried at the time of birth, while the lowest percentage of unmarried women with births belong to 35 to 50 years age bracket with 0.0% of them unmarried.
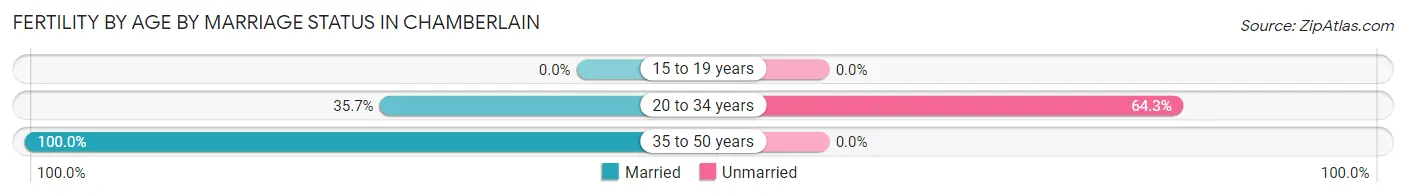
| Age Bracket | Married | Unmarried |
| 15 to 19 years | 0 (0.0%) | 0 (0.0%) |
| 20 to 34 years | 10 (35.7%) | 18 (64.3%) |
| 35 to 50 years | 7 (100.0%) | 0 (0.0%) |
| Total | 17 (48.6%) | 18 (51.4%) |
Fertility by Education in Chamberlain
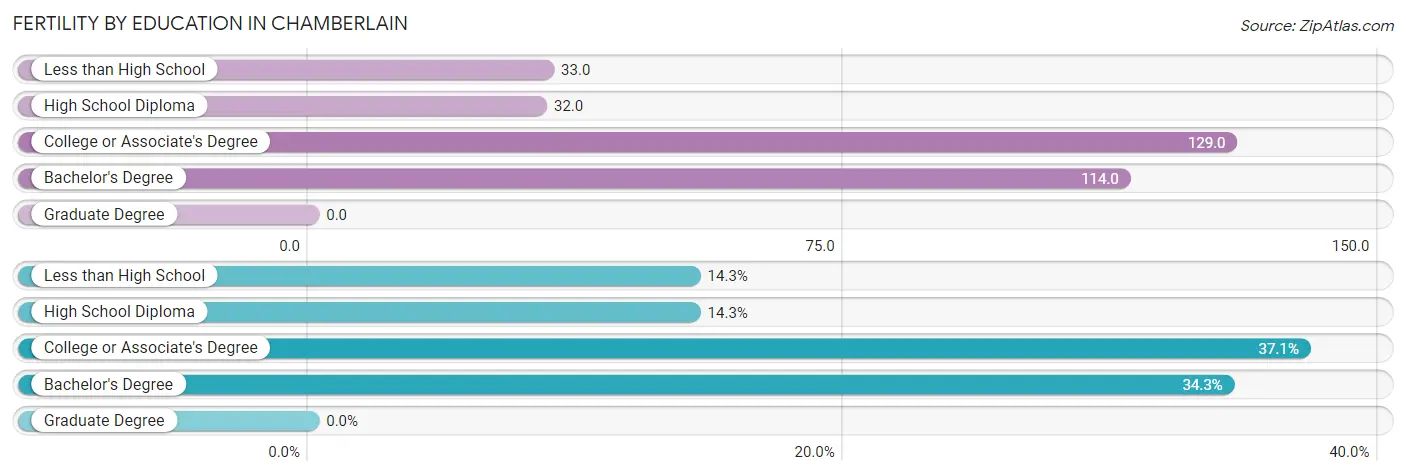
| Educational Attainment | Women with Births | Births / 1,000 Women |
| Less than High School | 5 (14.3%) | 33.0 |
| High School Diploma | 5 (14.3%) | 32.0 |
| College or Associate's Degree | 13 (37.1%) | 129.0 |
| Bachelor's Degree | 12 (34.3%) | 114.0 |
| Graduate Degree | 0 (0.0%) | 0.0 |
| Total | 35 (100.0%) | 63.0 |
Fertility by Education by Marriage Status in Chamberlain
51.4% of women with births in Chamberlain are unmarried. Women with the educational attainment of less than high school are most likely to be married with 100.0% of them married at childbirth, while women with the educational attainment of high school diploma are least likely to be married with 100.0% of them unmarried at childbirth.
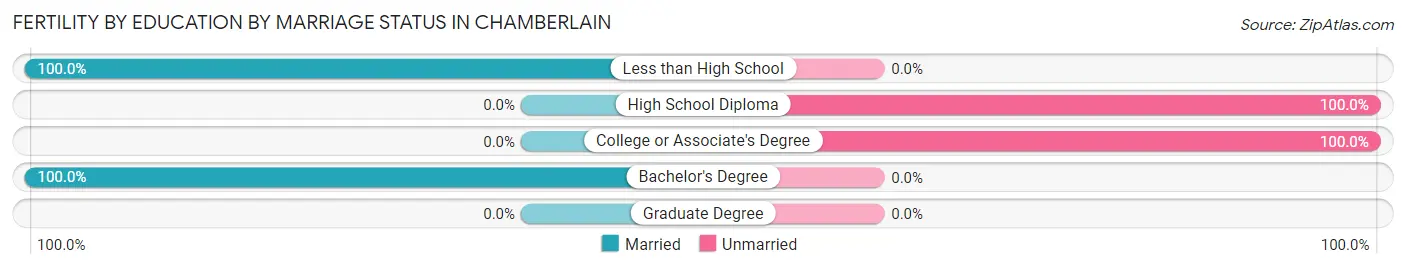
| Educational Attainment | Married | Unmarried |
| Less than High School | 5 (100.0%) | 0 (0.0%) |
| High School Diploma | 0 (0.0%) | 5 (100.0%) |
| College or Associate's Degree | 0 (0.0%) | 13 (100.0%) |
| Bachelor's Degree | 12 (100.0%) | 0 (0.0%) |
| Graduate Degree | 0 (0.0%) | 0 (0.0%) |
| Total | 17 (48.6%) | 18 (51.4%) |
Income in Chamberlain
Income Overview in Chamberlain
Per Capita Income in Chamberlain is $34,814, while median incomes of families and households are $98,750 and $59,375 respectively.
| Characteristic | Number | Measure |
| Per Capita Income | 2,538 | $34,814 |
| Median Family Income | 513 | $98,750 |
| Mean Family Income | 513 | $117,849 |
| Median Household Income | 871 | $59,375 |
| Mean Household Income | 871 | $85,439 |
| Income Deficit | 513 | $0 |
| Wage / Income Gap (%) | 2,538 | 26.70% |
| Wage / Income Gap ($) | 2,538 | 73.30¢ per $1 |
| Gini / Inequality Index | 2,538 | 0.49 |
Earnings by Sex in Chamberlain
Average Earnings in Chamberlain are $33,852, $39,844 for men and $29,205 for women, a difference of 26.7%.
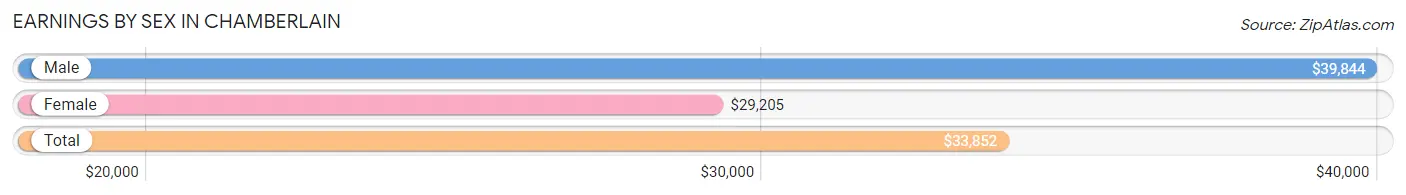
| Sex | Number | Average Earnings |
| Male | 733 (51.0%) | $39,844 |
| Female | 703 (49.0%) | $29,205 |
| Total | 1,436 (100.0%) | $33,852 |
Earnings by Sex by Income Bracket in Chamberlain
The most common earnings brackets in Chamberlain are $100,000+ for men (134 | 18.3%) and $2,500 to $4,999 for women (71 | 10.1%).
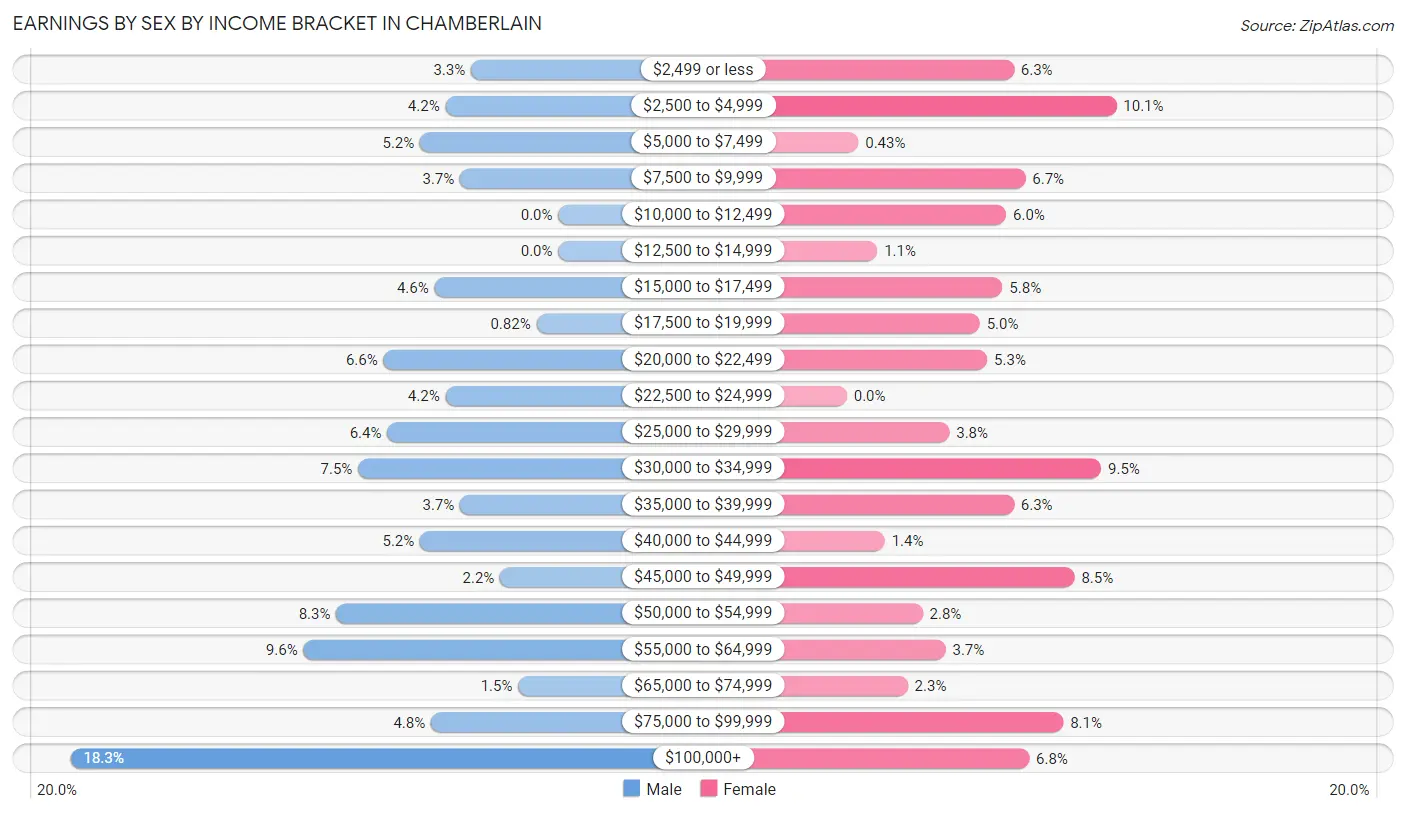
| Income | Male | Female |
| $2,499 or less | 24 (3.3%) | 44 (6.3%) |
| $2,500 to $4,999 | 31 (4.2%) | 71 (10.1%) |
| $5,000 to $7,499 | 38 (5.2%) | 3 (0.4%) |
| $7,500 to $9,999 | 27 (3.7%) | 47 (6.7%) |
| $10,000 to $12,499 | 0 (0.0%) | 42 (6.0%) |
| $12,500 to $14,999 | 0 (0.0%) | 8 (1.1%) |
| $15,000 to $17,499 | 34 (4.6%) | 41 (5.8%) |
| $17,500 to $19,999 | 6 (0.8%) | 35 (5.0%) |
| $20,000 to $22,499 | 48 (6.6%) | 37 (5.3%) |
| $22,500 to $24,999 | 31 (4.2%) | 0 (0.0%) |
| $25,000 to $29,999 | 47 (6.4%) | 27 (3.8%) |
| $30,000 to $34,999 | 55 (7.5%) | 67 (9.5%) |
| $35,000 to $39,999 | 27 (3.7%) | 44 (6.3%) |
| $40,000 to $44,999 | 38 (5.2%) | 10 (1.4%) |
| $45,000 to $49,999 | 16 (2.2%) | 60 (8.5%) |
| $50,000 to $54,999 | 61 (8.3%) | 20 (2.8%) |
| $55,000 to $64,999 | 70 (9.6%) | 26 (3.7%) |
| $65,000 to $74,999 | 11 (1.5%) | 16 (2.3%) |
| $75,000 to $99,999 | 35 (4.8%) | 57 (8.1%) |
| $100,000+ | 134 (18.3%) | 48 (6.8%) |
| Total | 733 (100.0%) | 703 (100.0%) |
Earnings by Sex by Educational Attainment in Chamberlain
Average earnings in Chamberlain are $50,179 for men and $35,370 for women, a difference of 29.5%. Men with an educational attainment of graduate degree enjoy the highest average annual earnings of $84,306, while those with high school diploma education earn the least with $39,219. Women with an educational attainment of graduate degree earn the most with the average annual earnings of $83,365, while those with high school diploma education have the smallest earnings of $26,875.
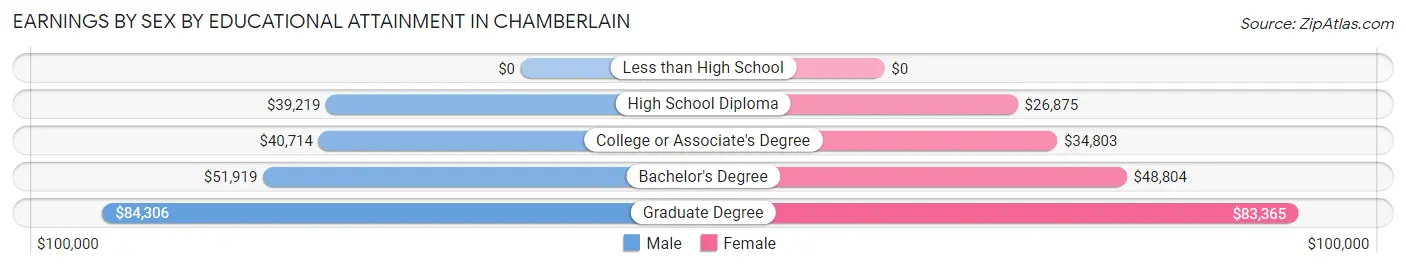
| Educational Attainment | Male Income | Female Income |
| Less than High School | - | - |
| High School Diploma | $39,219 | $26,875 |
| College or Associate's Degree | $40,714 | $34,803 |
| Bachelor's Degree | $51,919 | $48,804 |
| Graduate Degree | $84,306 | $83,365 |
| Total | $50,179 | $35,370 |
Family Income in Chamberlain
Family Income Brackets in Chamberlain
According to the Chamberlain family income data, there are 111 families falling into the $100,000 to $149,999 income range, which is the most common income bracket and makes up 21.6% of all families.
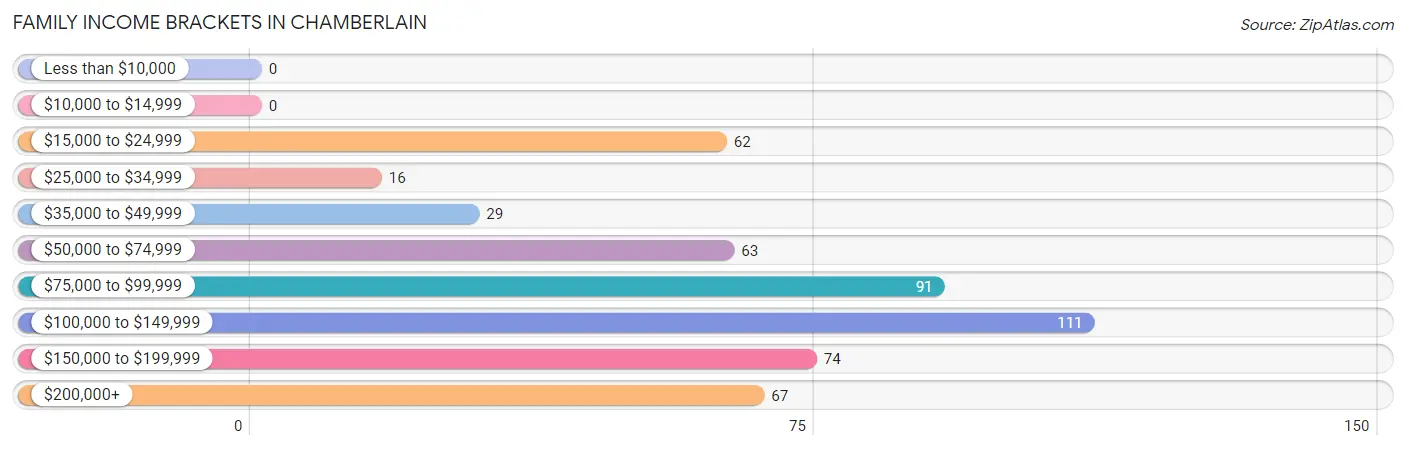
| Income Bracket | # Families | % Families |
| Less than $10,000 | 0 | 0.0% |
| $10,000 to $14,999 | 0 | 0.0% |
| $15,000 to $24,999 | 62 | 12.1% |
| $25,000 to $34,999 | 16 | 3.1% |
| $35,000 to $49,999 | 29 | 5.7% |
| $50,000 to $74,999 | 63 | 12.3% |
| $75,000 to $99,999 | 91 | 17.7% |
| $100,000 to $149,999 | 111 | 21.6% |
| $150,000 to $199,999 | 74 | 14.4% |
| $200,000+ | 67 | 13.1% |
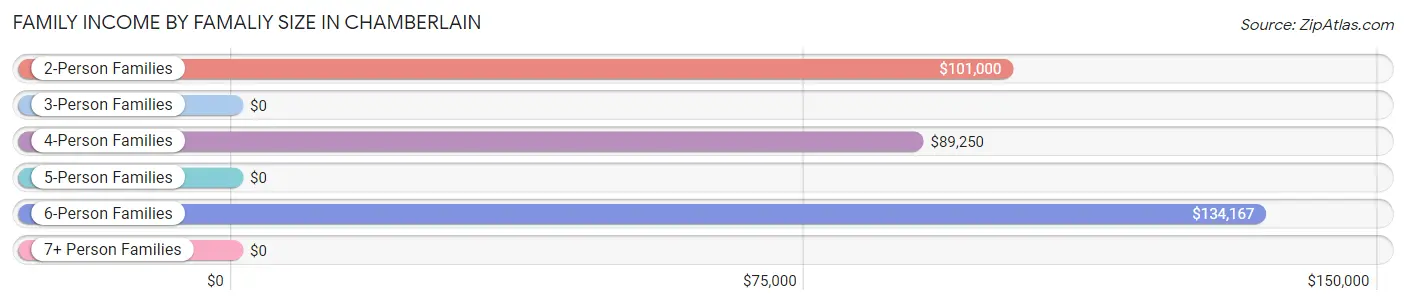
Family Income by Famaliy Size in Chamberlain
6-person families (14 | 2.7%) account for the highest median family income in Chamberlain with $134,167 per family, while 2-person families (278 | 54.2%) have the highest median income of $50,500 per family member.
| Income Bracket | # Families | Median Income |
| 2-Person Families | 278 (54.2%) | $101,000 |
| 3-Person Families | 55 (10.7%) | $0 |
| 4-Person Families | 64 (12.5%) | $89,250 |
| 5-Person Families | 99 (19.3%) | $0 |
| 6-Person Families | 14 (2.7%) | $134,167 |
| 7+ Person Families | 3 (0.6%) | $0 |
| Total | 513 (100.0%) | $98,750 |
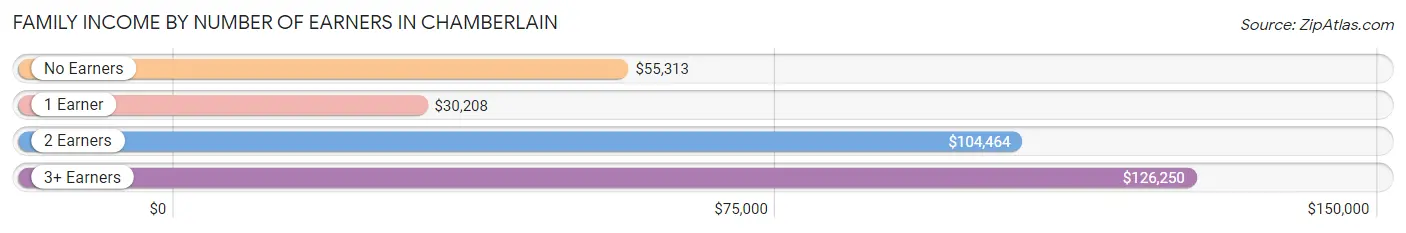
Family Income by Number of Earners in Chamberlain
The median family income in Chamberlain is $98,750, with families comprising 3+ earners (98) having the highest median family income of $126,250, while families with 1 earner (105) have the lowest median family income of $30,208, accounting for 19.1% and 20.5% of families, respectively.
| Number of Earners | # Families | Median Income |
| No Earners | 29 (5.7%) | $55,313 |
| 1 Earner | 105 (20.5%) | $30,208 |
| 2 Earners | 281 (54.8%) | $104,464 |
| 3+ Earners | 98 (19.1%) | $126,250 |
| Total | 513 (100.0%) | $98,750 |
Household Income in Chamberlain
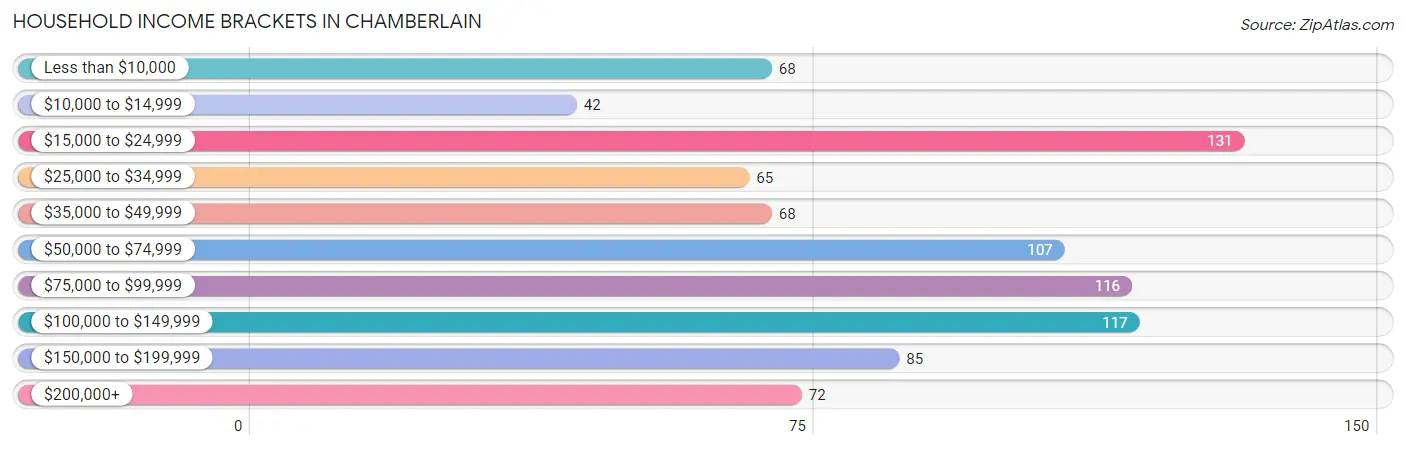
Household Income Brackets in Chamberlain
With 131 households falling in the category, the $15,000 to $24,999 income range is the most frequent in Chamberlain, accounting for 15.0% of all households. In contrast, only 42 households (4.8%) fall into the $10,000 to $14,999 income bracket, making it the least populous group.
| Income Bracket | # Households | % Households |
| Less than $10,000 | 68 | 7.8% |
| $10,000 to $14,999 | 42 | 4.8% |
| $15,000 to $24,999 | 131 | 15.0% |
| $25,000 to $34,999 | 65 | 7.5% |
| $35,000 to $49,999 | 68 | 7.8% |
| $50,000 to $74,999 | 107 | 12.3% |
| $75,000 to $99,999 | 116 | 13.3% |
| $100,000 to $149,999 | 117 | 13.4% |
| $150,000 to $199,999 | 85 | 9.8% |
| $200,000+ | 72 | 8.3% |
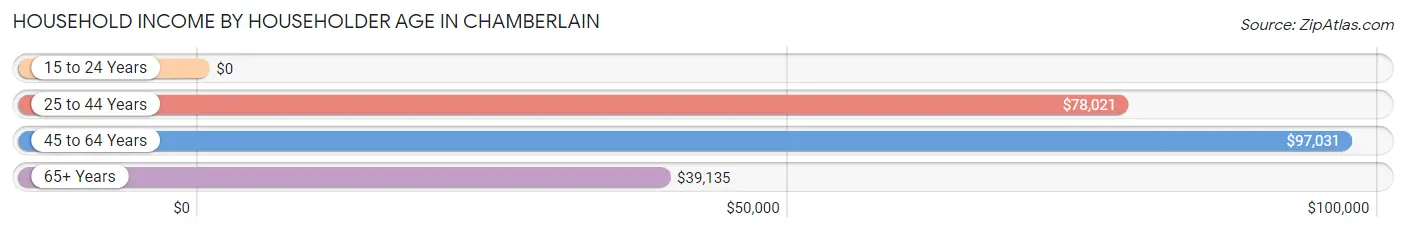
Household Income by Householder Age in Chamberlain
The median household income in Chamberlain is $59,375, with the highest median household income of $97,031 found in the 45 to 64 years age bracket for the primary householder. A total of 299 households (34.3%) fall into this category. Meanwhile, the 15 to 24 years age bracket for the primary householder has the lowest median household income of $0, with 18 households (2.1%) in this group.
| Income Bracket | # Households | Median Income |
| 15 to 24 Years | 18 (2.1%) | $0 |
| 25 to 44 Years | 255 (29.3%) | $78,021 |
| 45 to 64 Years | 299 (34.3%) | $97,031 |
| 65+ Years | 299 (34.3%) | $39,135 |
| Total | 871 (100.0%) | $59,375 |
Poverty in Chamberlain
Income Below Poverty by Sex and Age in Chamberlain
With 13.2% poverty level for males and 15.5% for females among the residents of Chamberlain, 5 year old males and 6 to 11 year old females are the most vulnerable to poverty, with 9 males (100.0%) and 23 females (33.3%) in their respective age groups living below the poverty level.
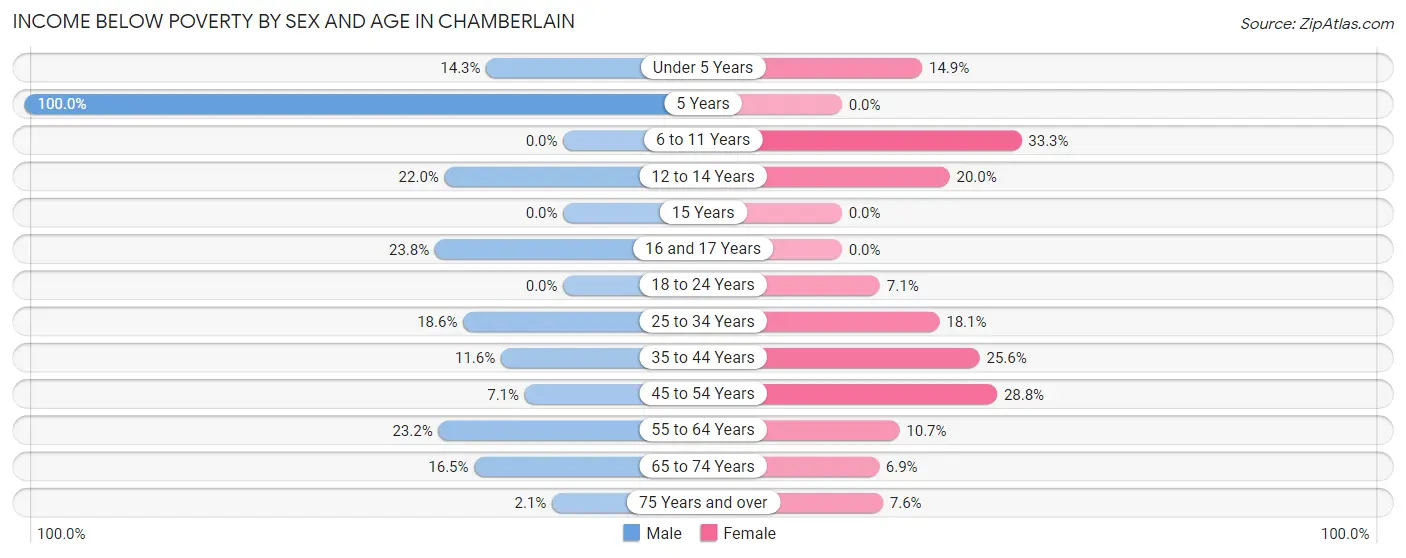
| Age Bracket | Male | Female |
| Under 5 Years | 12 (14.3%) | 7 (14.9%) |
| 5 Years | 9 (100.0%) | 0 (0.0%) |
| 6 to 11 Years | 0 (0.0%) | 23 (33.3%) |
| 12 to 14 Years | 13 (22.0%) | 8 (20.0%) |
| 15 Years | 0 (0.0%) | 0 (0.0%) |
| 16 and 17 Years | 5 (23.8%) | 0 (0.0%) |
| 18 to 24 Years | 0 (0.0%) | 7 (7.1%) |
| 25 to 34 Years | 21 (18.6%) | 21 (18.1%) |
| 35 to 44 Years | 17 (11.6%) | 45 (25.6%) |
| 45 to 54 Years | 10 (7.1%) | 36 (28.8%) |
| 55 to 64 Years | 54 (23.2%) | 17 (10.7%) |
| 65 to 74 Years | 19 (16.5%) | 9 (6.9%) |
| 75 Years and over | 1 (2.1%) | 8 (7.6%) |
| Total | 161 (13.2%) | 181 (15.5%) |
Income Above Poverty by Sex and Age in Chamberlain
According to the poverty statistics in Chamberlain, males aged 6 to 11 years and females aged 5 years are the age groups that are most secure financially, with 100.0% of males and 100.0% of females in these age groups living above the poverty line.
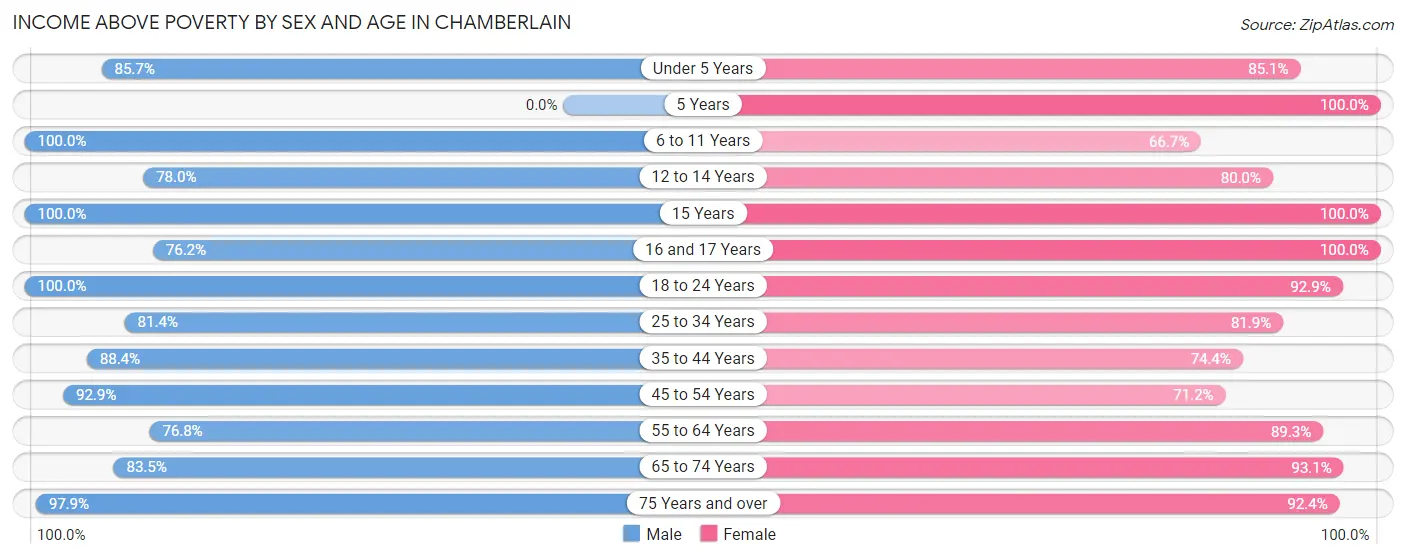
| Age Bracket | Male | Female |
| Under 5 Years | 72 (85.7%) | 40 (85.1%) |
| 5 Years | 0 (0.0%) | 25 (100.0%) |
| 6 to 11 Years | 118 (100.0%) | 46 (66.7%) |
| 12 to 14 Years | 46 (78.0%) | 32 (80.0%) |
| 15 Years | 33 (100.0%) | 6 (100.0%) |
| 16 and 17 Years | 16 (76.2%) | 70 (100.0%) |
| 18 to 24 Years | 97 (100.0%) | 92 (92.9%) |
| 25 to 34 Years | 92 (81.4%) | 95 (81.9%) |
| 35 to 44 Years | 130 (88.4%) | 131 (74.4%) |
| 45 to 54 Years | 130 (92.9%) | 89 (71.2%) |
| 55 to 64 Years | 179 (76.8%) | 142 (89.3%) |
| 65 to 74 Years | 96 (83.5%) | 122 (93.1%) |
| 75 Years and over | 47 (97.9%) | 97 (92.4%) |
| Total | 1,056 (86.8%) | 987 (84.5%) |
Income Below Poverty Among Married-Couple Families in Chamberlain
The poverty statistics for married-couple families in Chamberlain show that 4.2% or 17 of the total 407 families live below the poverty line. Families with 3 or 4 children have the highest poverty rate of 11.6%, comprising of 10 families. On the other hand, families with no children have the lowest poverty rate of 0.0%, which includes 0 families.
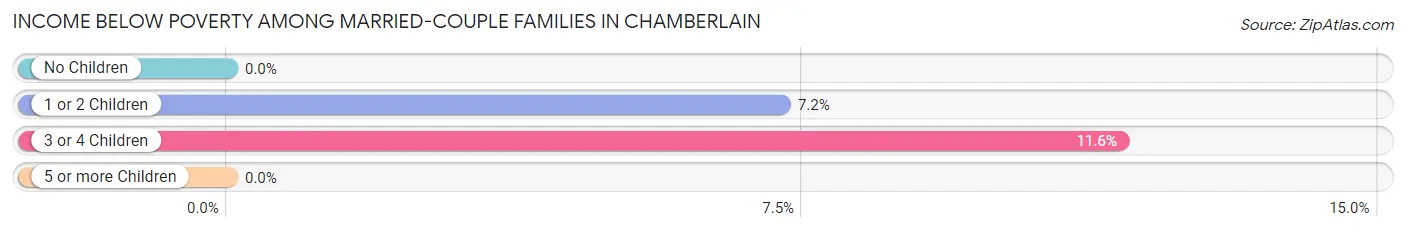
| Children | Above Poverty | Below Poverty |
| No Children | 224 (100.0%) | 0 (0.0%) |
| 1 or 2 Children | 90 (92.8%) | 7 (7.2%) |
| 3 or 4 Children | 76 (88.4%) | 10 (11.6%) |
| 5 or more Children | 0 (0.0%) | 0 (0.0%) |
| Total | 390 (95.8%) | 17 (4.2%) |
Income Below Poverty Among Single-Parent Households in Chamberlain
According to the poverty data in Chamberlain, 10.5% or 6 single-father households and 42.9% or 21 single-mother households are living below the poverty line. Among single-father households, those with 1 or 2 children have the highest poverty rate, with 6 households (14.3%) experiencing poverty. Likewise, among single-mother households, those with 1 or 2 children have the highest poverty rate, with 21 households (60.0%) falling below the poverty line.
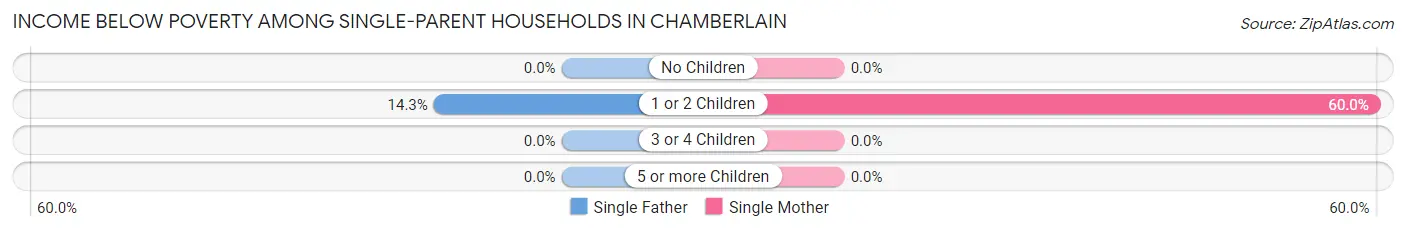
| Children | Single Father | Single Mother |
| No Children | 0 (0.0%) | 0 (0.0%) |
| 1 or 2 Children | 6 (14.3%) | 21 (60.0%) |
| 3 or 4 Children | 0 (0.0%) | 0 (0.0%) |
| 5 or more Children | 0 (0.0%) | 0 (0.0%) |
| Total | 6 (10.5%) | 21 (42.9%) |
Income Below Poverty Among Married-Couple vs Single-Parent Households in Chamberlain
The poverty data for Chamberlain shows that 17 of the married-couple family households (4.2%) and 27 of the single-parent households (25.5%) are living below the poverty level. Within the married-couple family households, those with 3 or 4 children have the highest poverty rate, with 10 households (11.6%) falling below the poverty line. Among the single-parent households, those with 1 or 2 children have the highest poverty rate, with 27 household (35.1%) living below poverty.
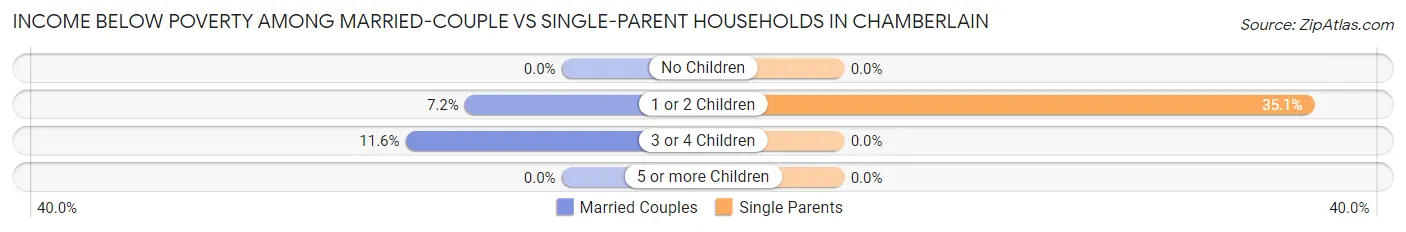
| Children | Married-Couple Families | Single-Parent Households |
| No Children | 0 (0.0%) | 0 (0.0%) |
| 1 or 2 Children | 7 (7.2%) | 27 (35.1%) |
| 3 or 4 Children | 10 (11.6%) | 0 (0.0%) |
| 5 or more Children | 0 (0.0%) | 0 (0.0%) |
| Total | 17 (4.2%) | 27 (25.5%) |
Employment Characteristics in Chamberlain
Employment by Class of Employer in Chamberlain
Among the 1,284 employed individuals in Chamberlain, private company employees (579 | 45.1%), not-for-profit organizations (344 | 26.8%), and local government employees (114 | 8.9%) make up the most common classes of employment.
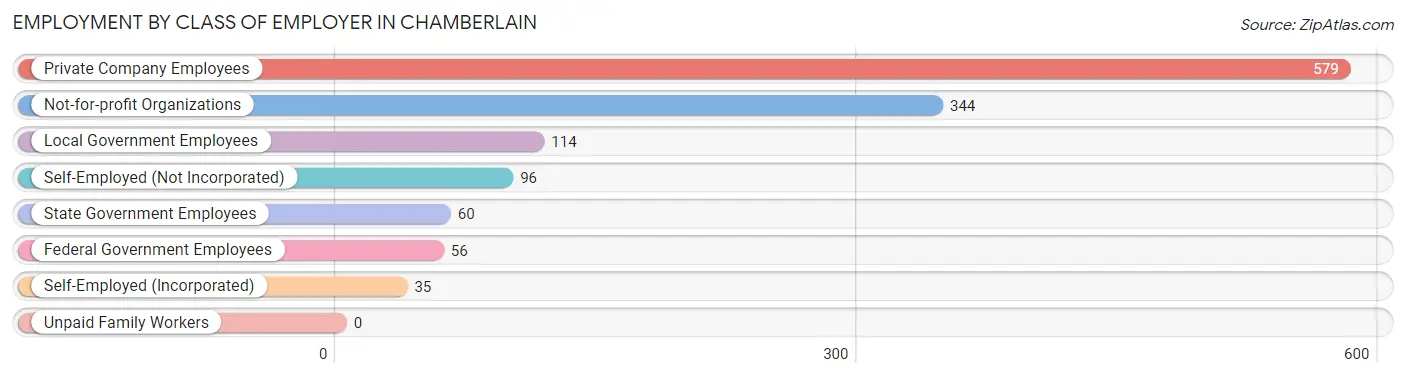
| Employer Class | # Employees | % Employees |
| Private Company Employees | 579 | 45.1% |
| Self-Employed (Incorporated) | 35 | 2.7% |
| Self-Employed (Not Incorporated) | 96 | 7.5% |
| Not-for-profit Organizations | 344 | 26.8% |
| Local Government Employees | 114 | 8.9% |
| State Government Employees | 60 | 4.7% |
| Federal Government Employees | 56 | 4.4% |
| Unpaid Family Workers | 0 | 0.0% |
| Total | 1,284 | 100.0% |
Employment Status by Age in Chamberlain
According to the labor force statistics for Chamberlain, out of the total population over 16 years of age (2,027), 66.5% or 1,348 individuals are in the labor force, with 3.5% or 47 of them unemployed. The age group with the highest labor force participation rate is 25 to 29 years, with 100.0% or 132 individuals in the labor force. Within the labor force, the 16 to 19 years age range has the highest percentage of unemployed individuals, with 16.5% or 16 of them being unemployed.
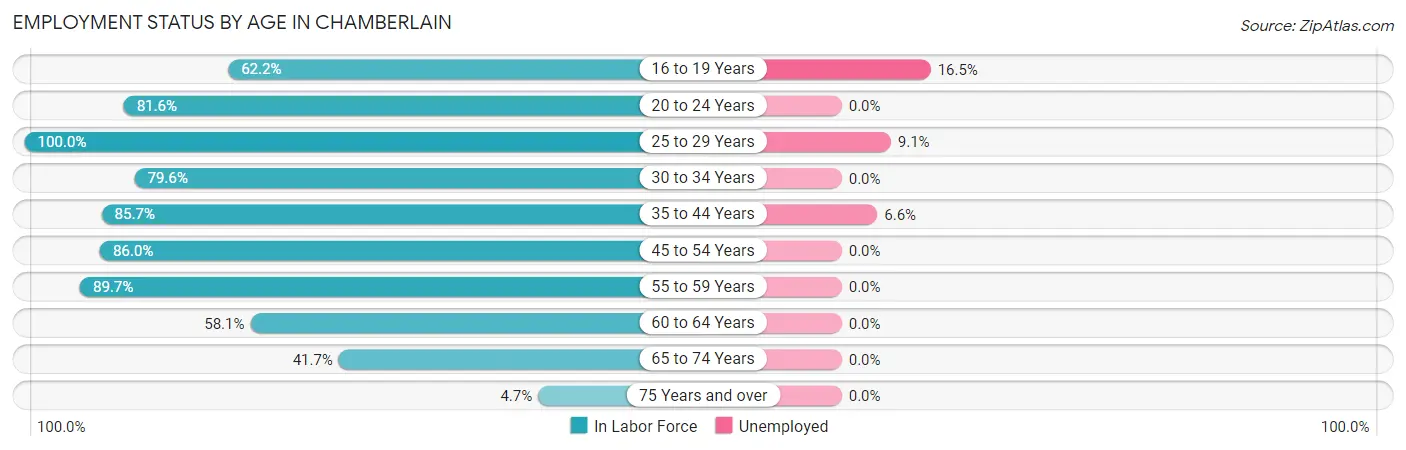
| Age Bracket | In Labor Force | Unemployed |
| 16 to 19 Years | 97 (62.2%) | 16 (16.5%) |
| 20 to 24 Years | 111 (81.6%) | 0 (0.0%) |
| 25 to 29 Years | 132 (100.0%) | 12 (9.1%) |
| 30 to 34 Years | 82 (79.6%) | 0 (0.0%) |
| 35 to 44 Years | 288 (85.7%) | 19 (6.6%) |
| 45 to 54 Years | 228 (86.0%) | 0 (0.0%) |
| 55 to 59 Years | 156 (89.7%) | 0 (0.0%) |
| 60 to 64 Years | 137 (58.1%) | 0 (0.0%) |
| 65 to 74 Years | 106 (41.7%) | 0 (0.0%) |
| 75 Years and over | 11 (4.7%) | 0 (0.0%) |
| Total | 1,348 (66.5%) | 47 (3.5%) |
Employment Status by Educational Attainment in Chamberlain
According to labor force statistics for Chamberlain, 82.1% of individuals (1,023) out of the total population between 25 and 64 years of age (1,246) are in the labor force, with 3.1% or 32 of them being unemployed. The group with the highest labor force participation rate are those with the educational attainment of bachelor's degree or higher, with 100.0% or 359 individuals in the labor force. Within the labor force, individuals with college / associate degree education have the highest percentage of unemployment, with 12.3% or 32 of them being unemployed.
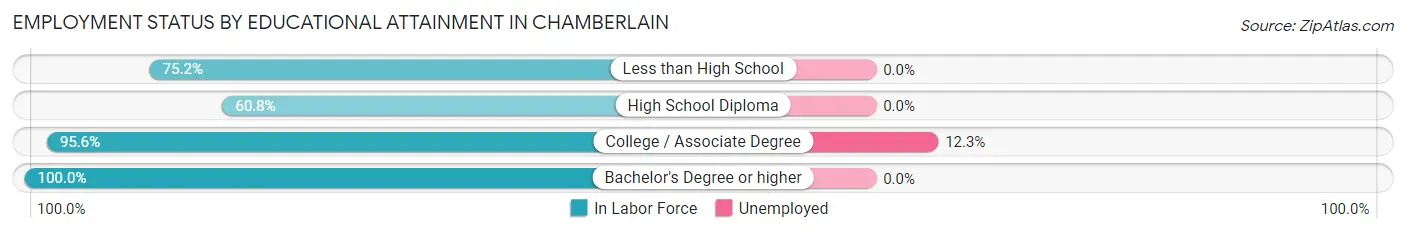
| Educational Attainment | In Labor Force | Unemployed |
| Less than High School | 152 (75.2%) | 0 (0.0%) |
| High School Diploma | 250 (60.8%) | 0 (0.0%) |
| College / Associate Degree | 262 (95.6%) | 34 (12.3%) |
| Bachelor's Degree or higher | 359 (100.0%) | 0 (0.0%) |
| Total | 1,023 (82.1%) | 39 (3.1%) |
Employment Occupations by Sex in Chamberlain
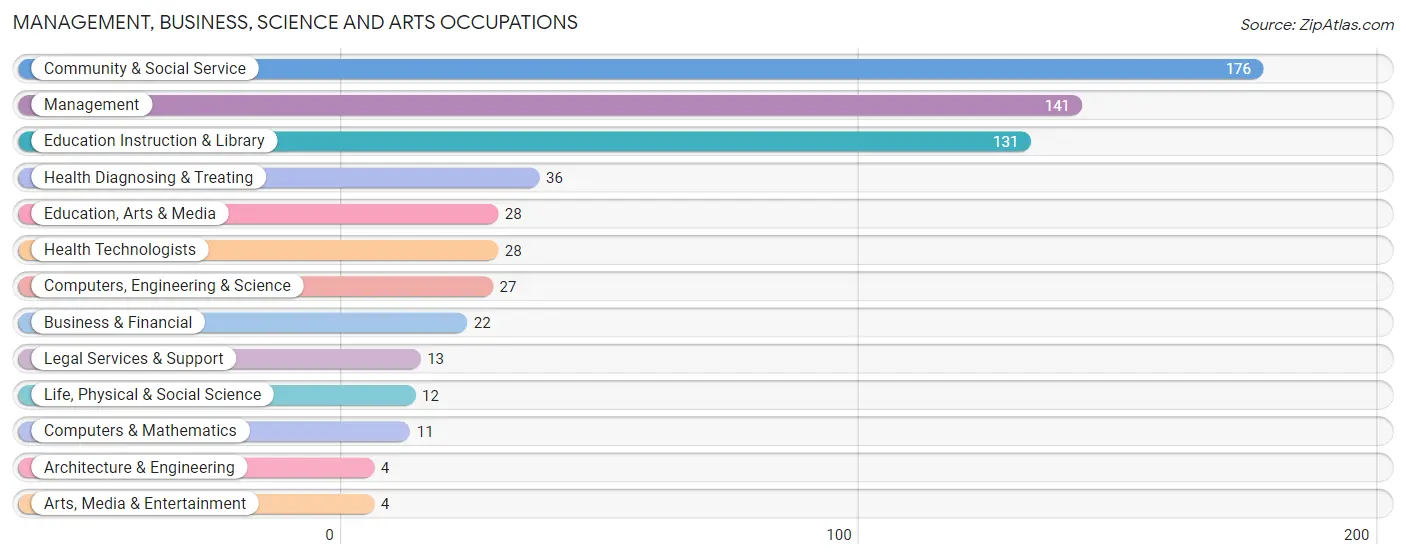
Management, Business, Science and Arts Occupations
The most common Management, Business, Science and Arts occupations in Chamberlain are Community & Social Service (176 | 13.6%), Management (141 | 10.9%), Education Instruction & Library (131 | 10.1%), Health Diagnosing & Treating (36 | 2.8%), and Education, Arts & Media (28 | 2.2%).
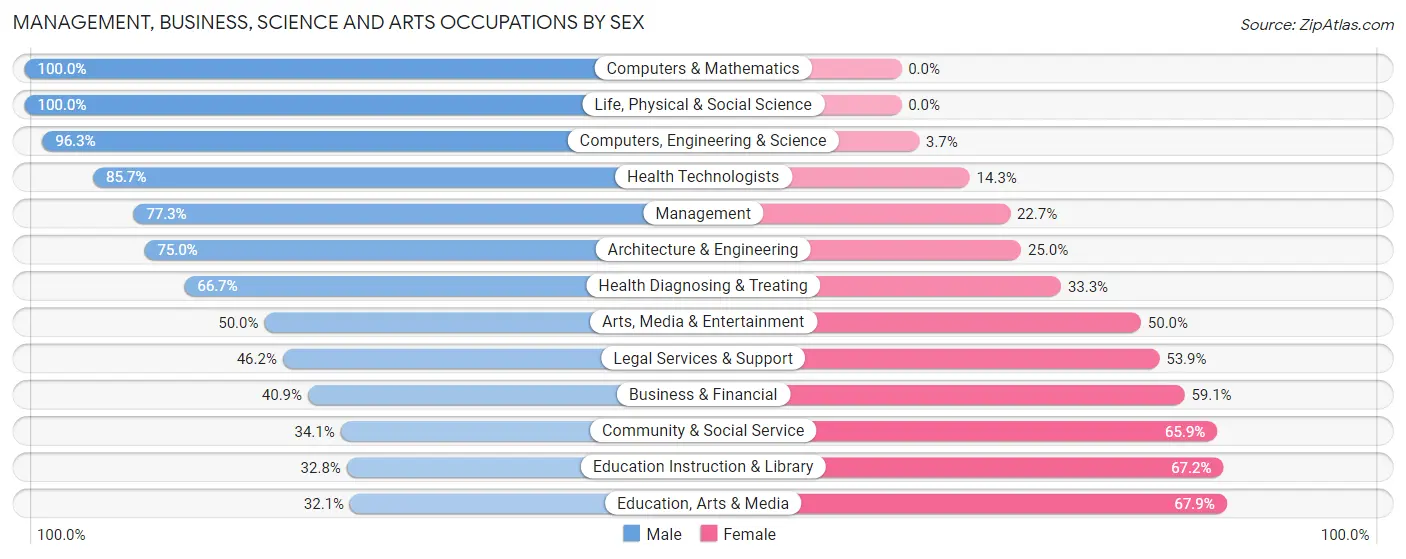
Management, Business, Science and Arts Occupations by Sex
Within the Management, Business, Science and Arts occupations in Chamberlain, the most male-oriented occupations are Computers & Mathematics (100.0%), Life, Physical & Social Science (100.0%), and Computers, Engineering & Science (96.3%), while the most female-oriented occupations are Education, Arts & Media (67.9%), Education Instruction & Library (67.2%), and Community & Social Service (65.9%).
| Occupation | Male | Female |
| Management | 109 (77.3%) | 32 (22.7%) |
| Business & Financial | 9 (40.9%) | 13 (59.1%) |
| Computers, Engineering & Science | 26 (96.3%) | 1 (3.7%) |
| Computers & Mathematics | 11 (100.0%) | 0 (0.0%) |
| Architecture & Engineering | 3 (75.0%) | 1 (25.0%) |
| Life, Physical & Social Science | 12 (100.0%) | 0 (0.0%) |
| Community & Social Service | 60 (34.1%) | 116 (65.9%) |
| Education, Arts & Media | 9 (32.1%) | 19 (67.9%) |
| Legal Services & Support | 6 (46.2%) | 7 (53.8%) |
| Education Instruction & Library | 43 (32.8%) | 88 (67.2%) |
| Arts, Media & Entertainment | 2 (50.0%) | 2 (50.0%) |
| Health Diagnosing & Treating | 24 (66.7%) | 12 (33.3%) |
| Health Technologists | 24 (85.7%) | 4 (14.3%) |
| Total (Category) | 228 (56.7%) | 174 (43.3%) |
| Total (Overall) | 644 (49.8%) | 648 (50.1%) |
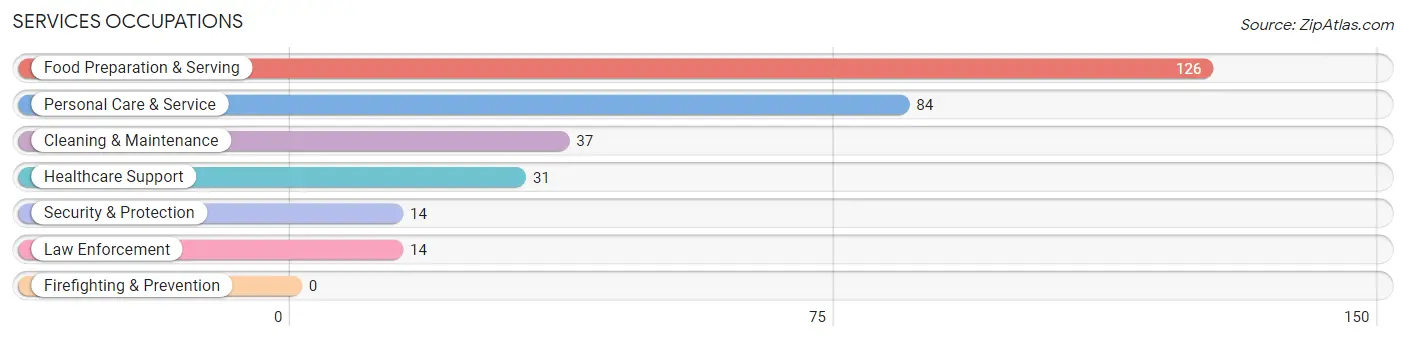
Services Occupations
The most common Services occupations in Chamberlain are Food Preparation & Serving (126 | 9.8%), Personal Care & Service (84 | 6.5%), Cleaning & Maintenance (37 | 2.9%), Healthcare Support (31 | 2.4%), and Security & Protection (14 | 1.1%).
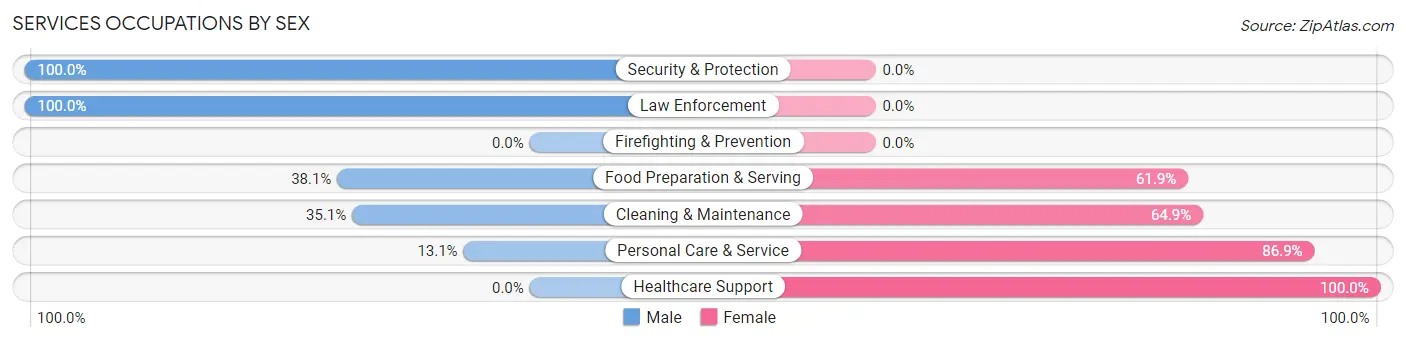
Services Occupations by Sex
Within the Services occupations in Chamberlain, the most male-oriented occupations are Security & Protection (100.0%), Law Enforcement (100.0%), and Food Preparation & Serving (38.1%), while the most female-oriented occupations are Healthcare Support (100.0%), Personal Care & Service (86.9%), and Cleaning & Maintenance (64.9%).
| Occupation | Male | Female |
| Healthcare Support | 0 (0.0%) | 31 (100.0%) |
| Security & Protection | 14 (100.0%) | 0 (0.0%) |
| Firefighting & Prevention | 0 (0.0%) | 0 (0.0%) |
| Law Enforcement | 14 (100.0%) | 0 (0.0%) |
| Food Preparation & Serving | 48 (38.1%) | 78 (61.9%) |
| Cleaning & Maintenance | 13 (35.1%) | 24 (64.9%) |
| Personal Care & Service | 11 (13.1%) | 73 (86.9%) |
| Total (Category) | 86 (29.4%) | 206 (70.6%) |
| Total (Overall) | 644 (49.8%) | 648 (50.1%) |
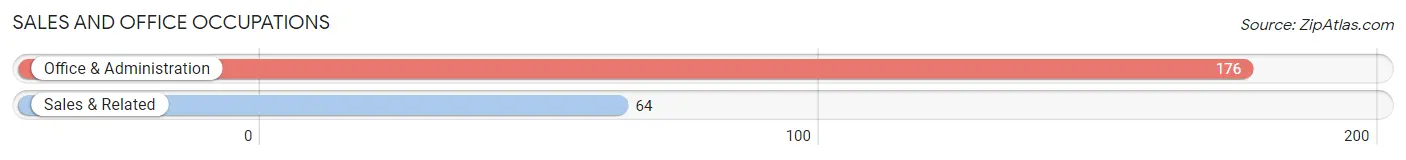
Sales and Office Occupations
The most common Sales and Office occupations in Chamberlain are Office & Administration (176 | 13.6%), and Sales & Related (64 | 5.0%).
Sales and Office Occupations by Sex
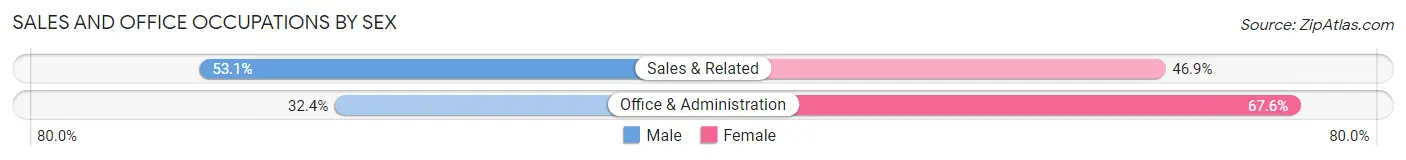
| Occupation | Male | Female |
| Sales & Related | 34 (53.1%) | 30 (46.9%) |
| Office & Administration | 57 (32.4%) | 119 (67.6%) |
| Total (Category) | 91 (37.9%) | 149 (62.1%) |
| Total (Overall) | 644 (49.8%) | 648 (50.1%) |
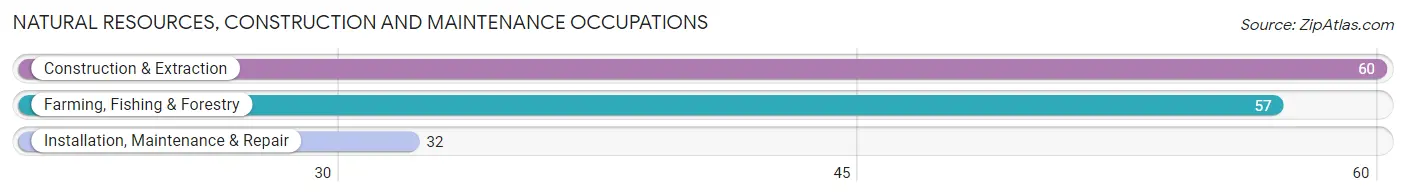
Natural Resources, Construction and Maintenance Occupations
The most common Natural Resources, Construction and Maintenance occupations in Chamberlain are Construction & Extraction (60 | 4.6%), Farming, Fishing & Forestry (57 | 4.4%), and Installation, Maintenance & Repair (32 | 2.5%).
Natural Resources, Construction and Maintenance Occupations by Sex
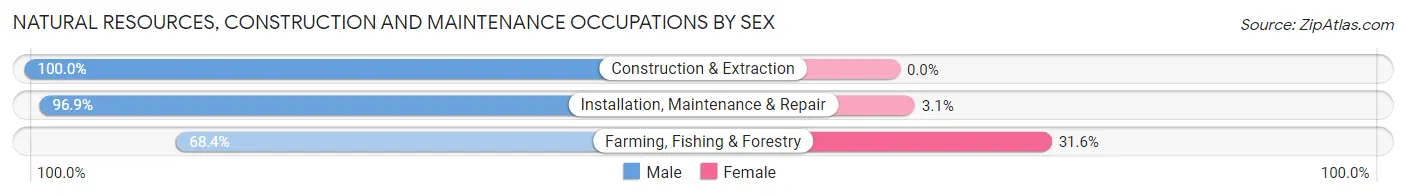
| Occupation | Male | Female |
| Farming, Fishing & Forestry | 39 (68.4%) | 18 (31.6%) |
| Construction & Extraction | 60 (100.0%) | 0 (0.0%) |
| Installation, Maintenance & Repair | 31 (96.9%) | 1 (3.1%) |
| Total (Category) | 130 (87.3%) | 19 (12.8%) |
| Total (Overall) | 644 (49.8%) | 648 (50.1%) |
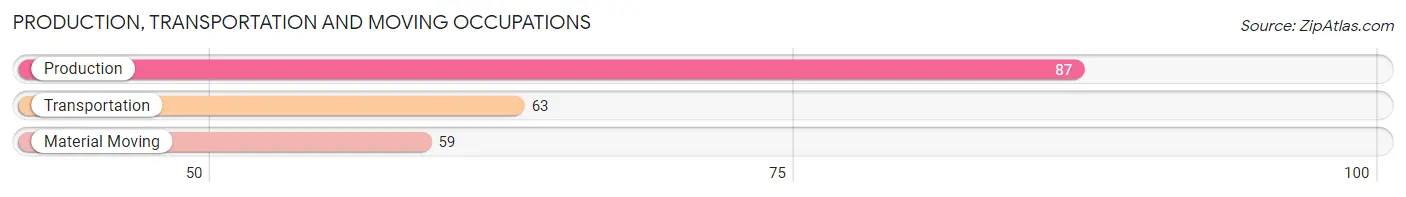
Production, Transportation and Moving Occupations
The most common Production, Transportation and Moving occupations in Chamberlain are Production (87 | 6.7%), Transportation (63 | 4.9%), and Material Moving (59 | 4.6%).
Production, Transportation and Moving Occupations by Sex
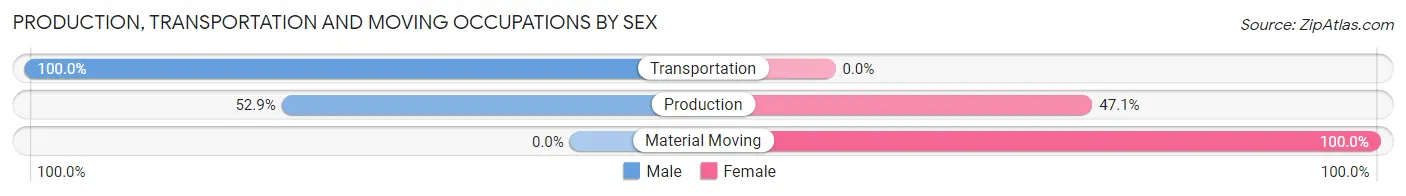
| Occupation | Male | Female |
| Production | 46 (52.9%) | 41 (47.1%) |
| Transportation | 63 (100.0%) | 0 (0.0%) |
| Material Moving | 0 (0.0%) | 59 (100.0%) |
| Total (Category) | 109 (52.1%) | 100 (47.8%) |
| Total (Overall) | 644 (49.8%) | 648 (50.1%) |
Employment Industries by Sex in Chamberlain
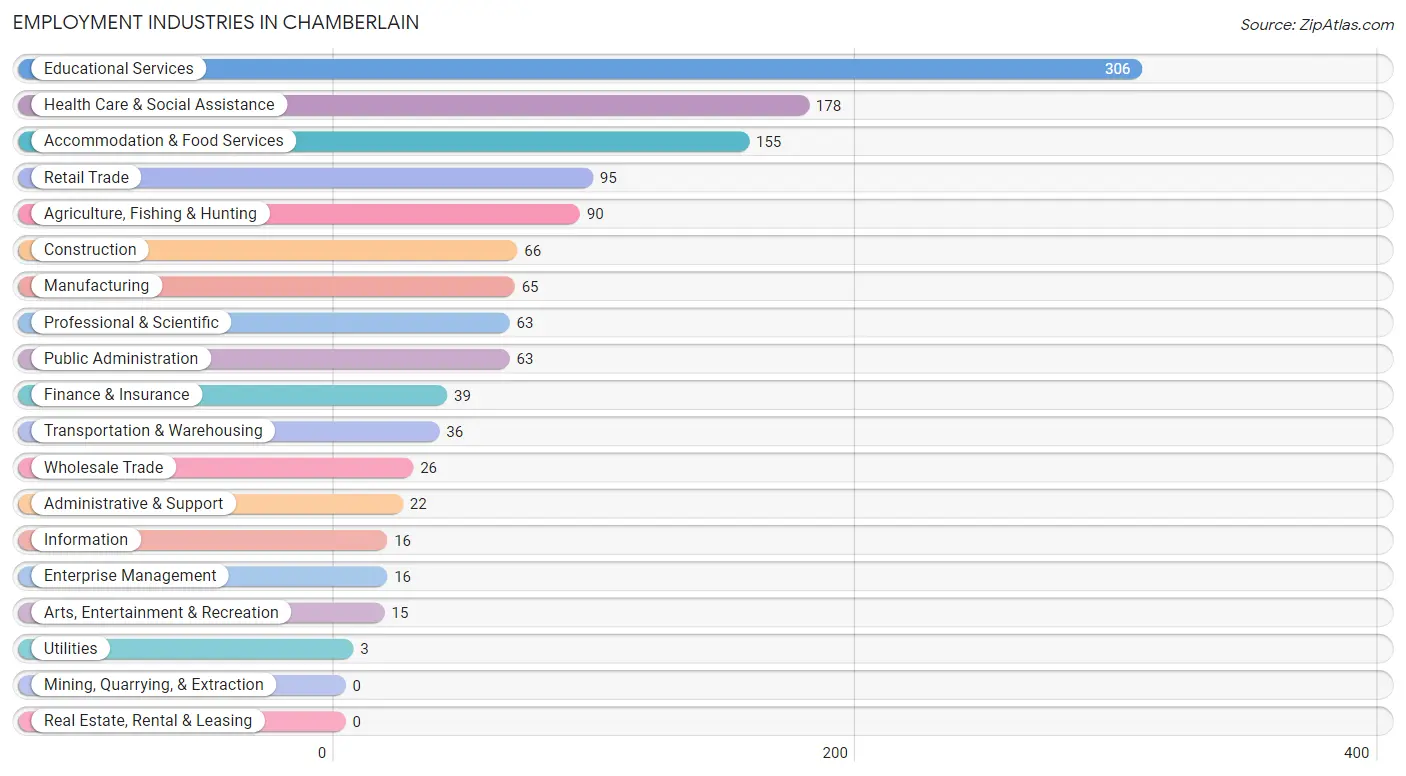
Employment Industries in Chamberlain
The major employment industries in Chamberlain include Educational Services (306 | 23.7%), Health Care & Social Assistance (178 | 13.8%), Accommodation & Food Services (155 | 12.0%), Retail Trade (95 | 7.3%), and Agriculture, Fishing & Hunting (90 | 7.0%).
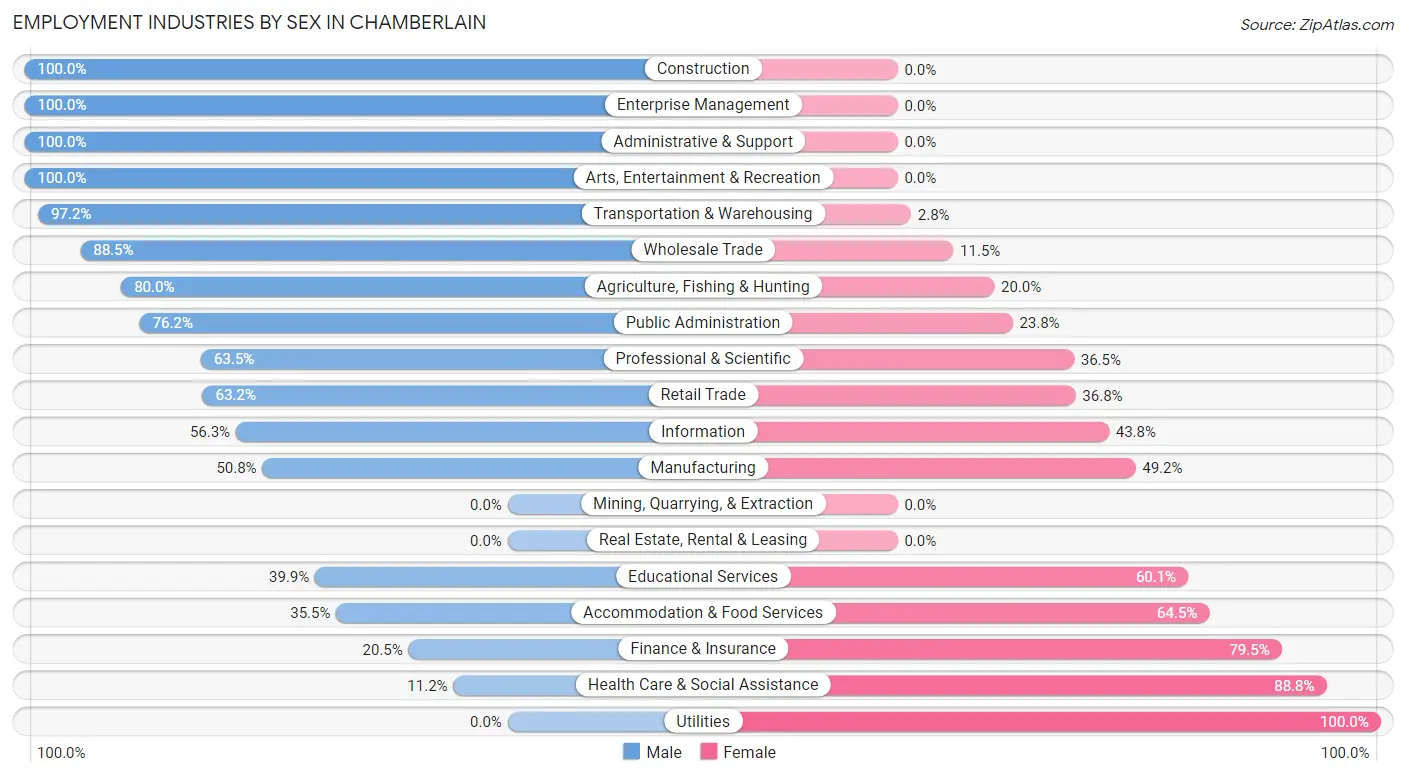
Employment Industries by Sex in Chamberlain
The Chamberlain industries that see more men than women are Construction (100.0%), Enterprise Management (100.0%), and Administrative & Support (100.0%), whereas the industries that tend to have a higher number of women are Utilities (100.0%), Health Care & Social Assistance (88.8%), and Finance & Insurance (79.5%).
| Industry | Male | Female |
| Agriculture, Fishing & Hunting | 72 (80.0%) | 18 (20.0%) |
| Mining, Quarrying, & Extraction | 0 (0.0%) | 0 (0.0%) |
| Construction | 66 (100.0%) | 0 (0.0%) |
| Manufacturing | 33 (50.8%) | 32 (49.2%) |
| Wholesale Trade | 23 (88.5%) | 3 (11.5%) |
| Retail Trade | 60 (63.2%) | 35 (36.8%) |
| Transportation & Warehousing | 35 (97.2%) | 1 (2.8%) |
| Utilities | 0 (0.0%) | 3 (100.0%) |
| Information | 9 (56.2%) | 7 (43.8%) |
| Finance & Insurance | 8 (20.5%) | 31 (79.5%) |
| Real Estate, Rental & Leasing | 0 (0.0%) | 0 (0.0%) |
| Professional & Scientific | 40 (63.5%) | 23 (36.5%) |
| Enterprise Management | 16 (100.0%) | 0 (0.0%) |
| Administrative & Support | 22 (100.0%) | 0 (0.0%) |
| Educational Services | 122 (39.9%) | 184 (60.1%) |
| Health Care & Social Assistance | 20 (11.2%) | 158 (88.8%) |
| Arts, Entertainment & Recreation | 15 (100.0%) | 0 (0.0%) |
| Accommodation & Food Services | 55 (35.5%) | 100 (64.5%) |
| Public Administration | 48 (76.2%) | 15 (23.8%) |
| Total | 644 (49.8%) | 648 (50.1%) |
Education in Chamberlain
School Enrollment in Chamberlain
The most common levels of schooling among the 530 students in Chamberlain are high school (179 | 33.8%), middle school (169 | 31.9%), and elementary school (102 | 19.3%).
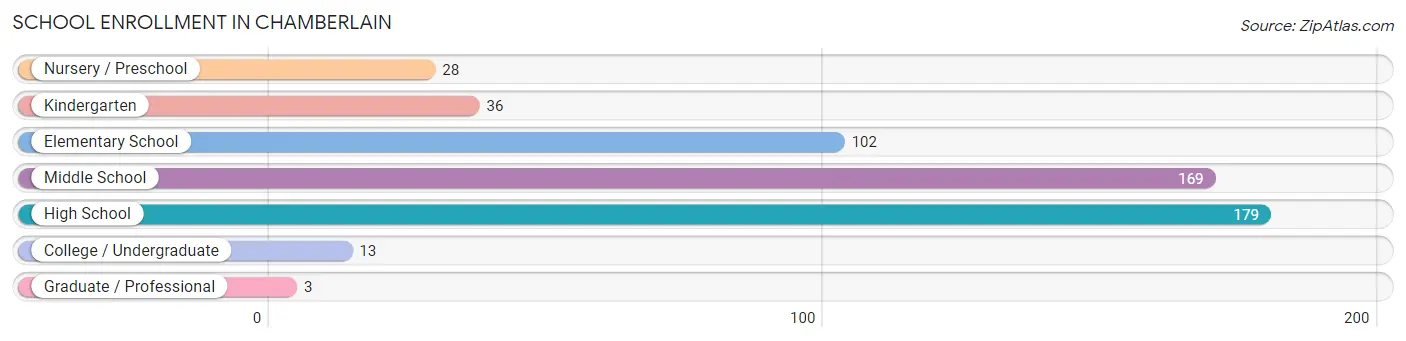
| School Level | # Students | % Students |
| Nursery / Preschool | 28 | 5.3% |
| Kindergarten | 36 | 6.8% |
| Elementary School | 102 | 19.3% |
| Middle School | 169 | 31.9% |
| High School | 179 | 33.8% |
| College / Undergraduate | 13 | 2.5% |
| Graduate / Professional | 3 | 0.6% |
| Total | 530 | 100.0% |
School Enrollment by Age by Funding Source in Chamberlain
Out of a total of 530 students who are enrolled in schools in Chamberlain, 17 (3.2%) attend a private institution, while the remaining 513 (96.8%) are enrolled in public schools. The age group of 3 to 4 year olds has the highest likelihood of being enrolled in private schools, with 11 (68.8% in the age bracket) enrolled. Conversely, the age group of 15 to 17 year olds has the lowest likelihood of being enrolled in a private school, with 130 (100.0% in the age bracket) attending a public institution.
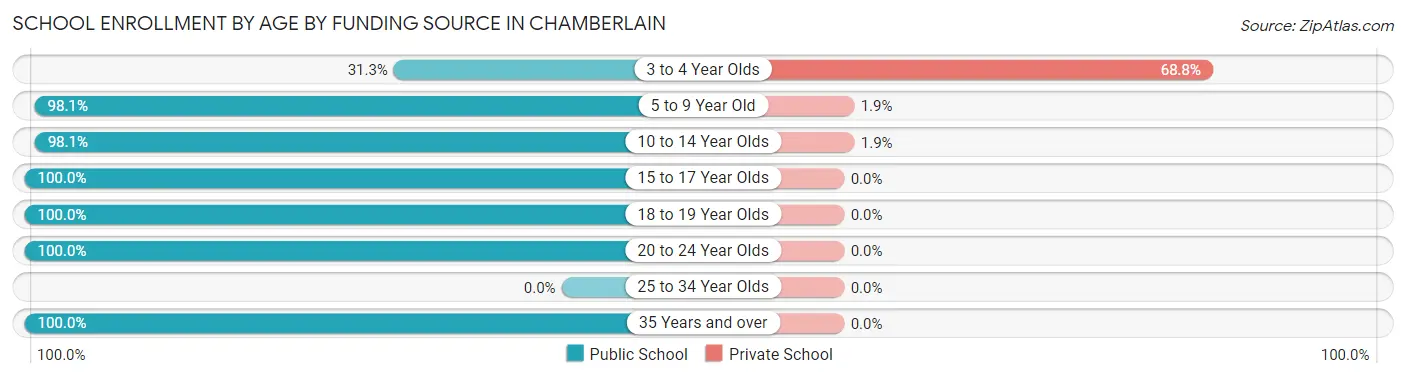
| Age Bracket | Public School | Private School |
| 3 to 4 Year Olds | 5 (31.2%) | 11 (68.8%) |
| 5 to 9 Year Old | 105 (98.1%) | 2 (1.9%) |
| 10 to 14 Year Olds | 208 (98.1%) | 4 (1.9%) |
| 15 to 17 Year Olds | 130 (100.0%) | 0 (0.0%) |
| 18 to 19 Year Olds | 49 (100.0%) | 0 (0.0%) |
| 20 to 24 Year Olds | 7 (100.0%) | 0 (0.0%) |
| 25 to 34 Year Olds | 0 (0.0%) | 0 (0.0%) |
| 35 Years and over | 9 (100.0%) | 0 (0.0%) |
| Total | 513 (96.8%) | 17 (3.2%) |
Educational Attainment by Field of Study in Chamberlain
Education (168 | 28.3%), arts & humanities (93 | 15.7%), business (66 | 11.1%), science & technology (58 | 9.8%), and bio, nature & agricultural (57 | 9.6%) are the most common fields of study among 593 individuals in Chamberlain who have obtained a bachelor's degree or higher.
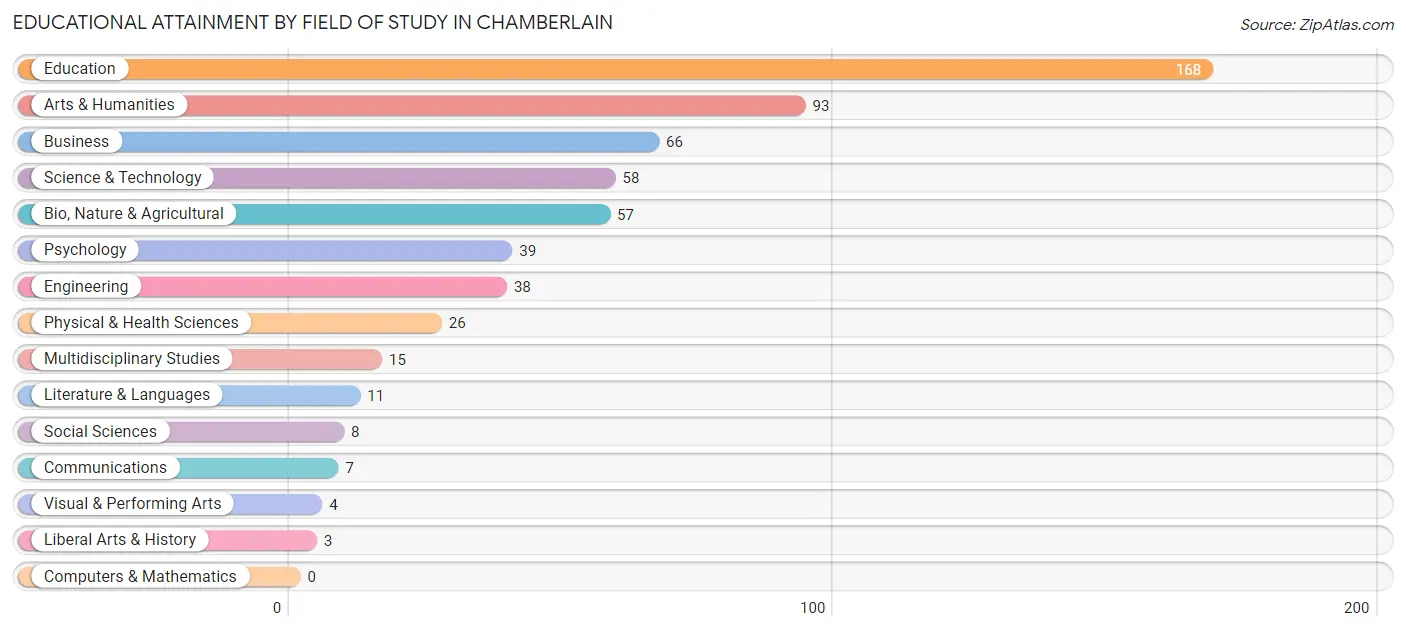
| Field of Study | # Graduates | % Graduates |
| Computers & Mathematics | 0 | 0.0% |
| Bio, Nature & Agricultural | 57 | 9.6% |
| Physical & Health Sciences | 26 | 4.4% |
| Psychology | 39 | 6.6% |
| Social Sciences | 8 | 1.3% |
| Engineering | 38 | 6.4% |
| Multidisciplinary Studies | 15 | 2.5% |
| Science & Technology | 58 | 9.8% |
| Business | 66 | 11.1% |
| Education | 168 | 28.3% |
| Literature & Languages | 11 | 1.8% |
| Liberal Arts & History | 3 | 0.5% |
| Visual & Performing Arts | 4 | 0.7% |
| Communications | 7 | 1.2% |
| Arts & Humanities | 93 | 15.7% |
| Total | 593 | 100.0% |
Transportation & Commute in Chamberlain
Vehicle Availability by Sex in Chamberlain
The most prevalent vehicle ownership categories in Chamberlain are males with 2 vehicles (252, accounting for 40.5%) and females with 2 vehicles (269, making up 42.2%).
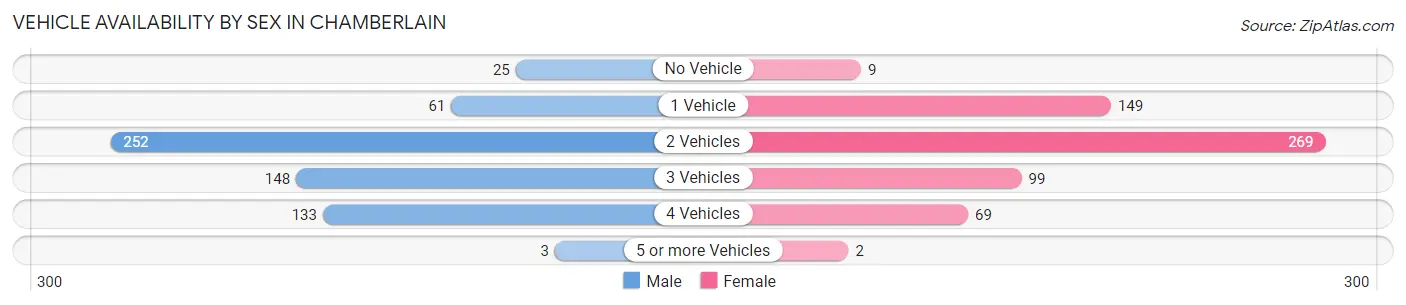
| Vehicles Available | Male | Female |
| No Vehicle | 25 (4.0%) | 9 (1.5%) |
| 1 Vehicle | 61 (9.8%) | 149 (25.0%) |
| 2 Vehicles | 252 (40.5%) | 269 (45.1%) |
| 3 Vehicles | 148 (23.8%) | 99 (16.6%) |
| 4 Vehicles | 133 (21.4%) | 69 (11.6%) |
| 5 or more Vehicles | 3 (0.5%) | 2 (0.3%) |
| Total | 622 (100.0%) | 597 (100.0%) |
Commute Time in Chamberlain
The most frequently occuring commute durations in Chamberlain are 5 to 9 minutes (423 commuters, 34.9%), 10 to 14 minutes (316 commuters, 26.1%), and less than 5 minutes (253 commuters, 20.9%).
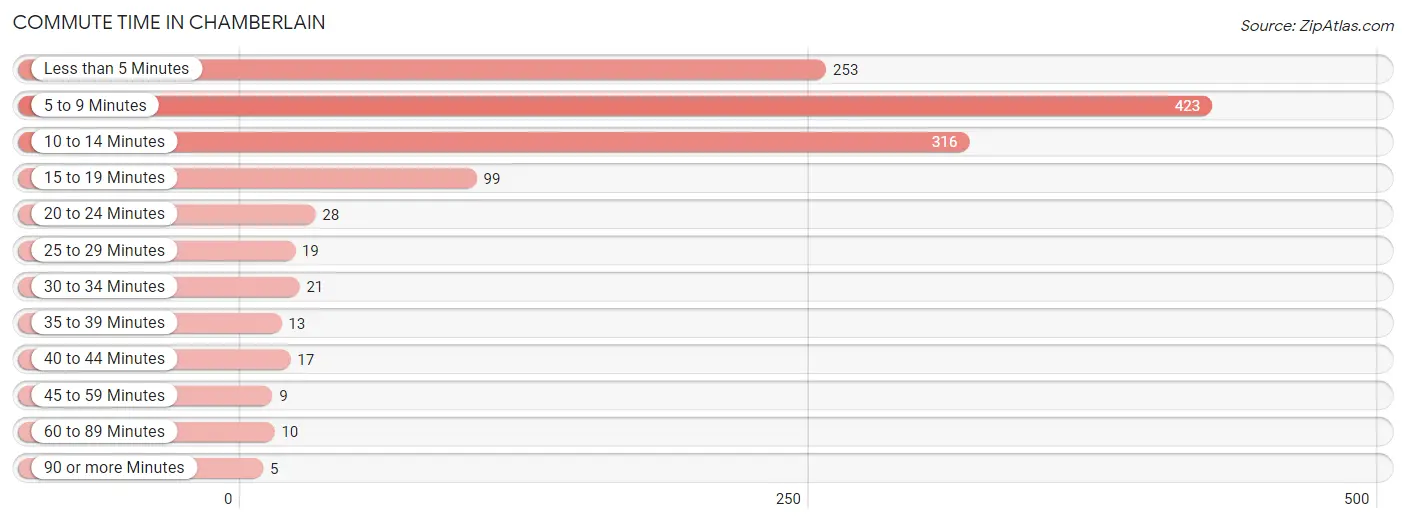
| Commute Time | # Commuters | % Commuters |
| Less than 5 Minutes | 253 | 20.9% |
| 5 to 9 Minutes | 423 | 34.9% |
| 10 to 14 Minutes | 316 | 26.1% |
| 15 to 19 Minutes | 99 | 8.2% |
| 20 to 24 Minutes | 28 | 2.3% |
| 25 to 29 Minutes | 19 | 1.6% |
| 30 to 34 Minutes | 21 | 1.7% |
| 35 to 39 Minutes | 13 | 1.1% |
| 40 to 44 Minutes | 17 | 1.4% |
| 45 to 59 Minutes | 9 | 0.7% |
| 60 to 89 Minutes | 10 | 0.8% |
| 90 or more Minutes | 5 | 0.4% |
Commute Time by Sex in Chamberlain
The most common commute times in Chamberlain are 10 to 14 minutes (204 commuters, 32.9%) for males and 5 to 9 minutes (235 commuters, 39.7%) for females.
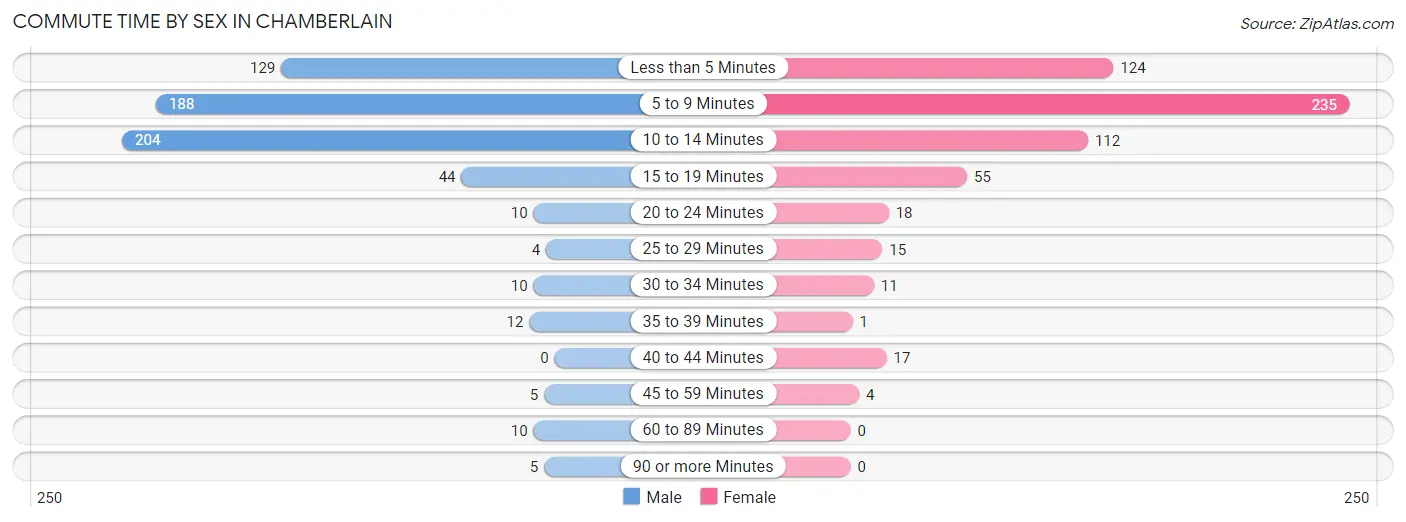
| Commute Time | Male | Female |
| Less than 5 Minutes | 129 (20.8%) | 124 (20.9%) |
| 5 to 9 Minutes | 188 (30.3%) | 235 (39.7%) |
| 10 to 14 Minutes | 204 (32.9%) | 112 (18.9%) |
| 15 to 19 Minutes | 44 (7.1%) | 55 (9.3%) |
| 20 to 24 Minutes | 10 (1.6%) | 18 (3.0%) |
| 25 to 29 Minutes | 4 (0.6%) | 15 (2.5%) |
| 30 to 34 Minutes | 10 (1.6%) | 11 (1.9%) |
| 35 to 39 Minutes | 12 (1.9%) | 1 (0.2%) |
| 40 to 44 Minutes | 0 (0.0%) | 17 (2.9%) |
| 45 to 59 Minutes | 5 (0.8%) | 4 (0.7%) |
| 60 to 89 Minutes | 10 (1.6%) | 0 (0.0%) |
| 90 or more Minutes | 5 (0.8%) | 0 (0.0%) |
Time of Departure to Work by Sex in Chamberlain
The most frequent times of departure to work in Chamberlain are 7:00 AM to 7:29 AM (119, 19.2%) for males and 7:30 AM to 7:59 AM (177, 29.9%) for females.
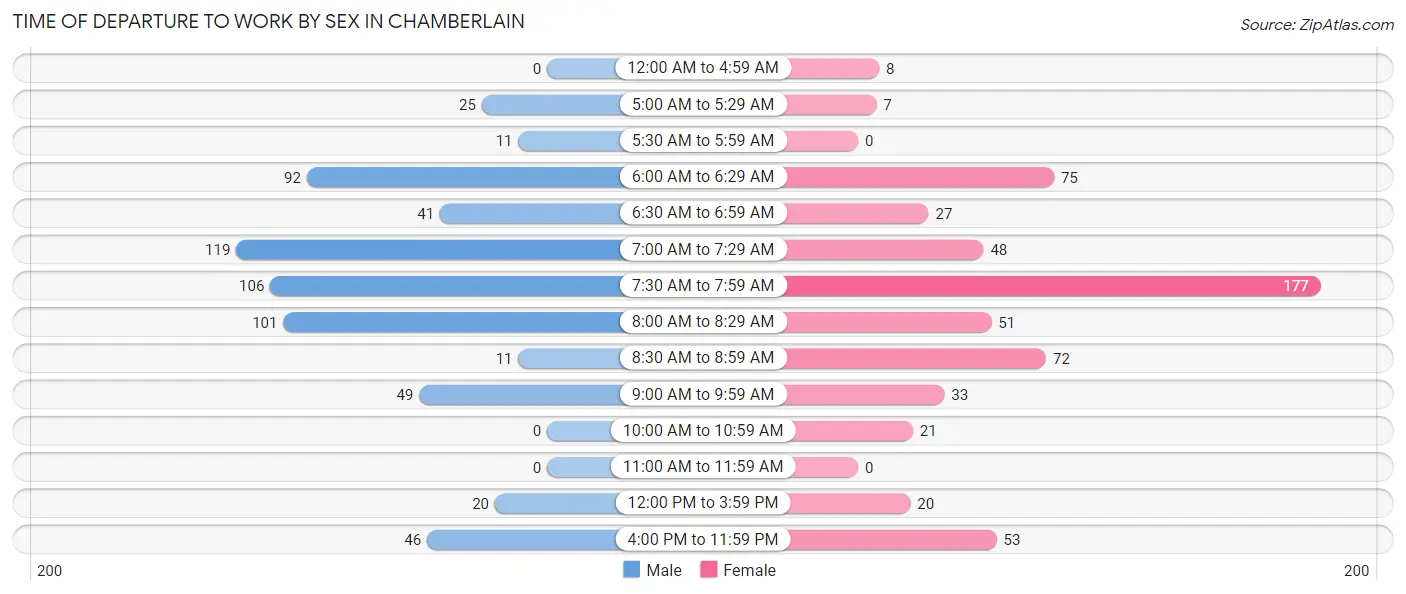
| Time of Departure | Male | Female |
| 12:00 AM to 4:59 AM | 0 (0.0%) | 8 (1.3%) |
| 5:00 AM to 5:29 AM | 25 (4.0%) | 7 (1.2%) |
| 5:30 AM to 5:59 AM | 11 (1.8%) | 0 (0.0%) |
| 6:00 AM to 6:29 AM | 92 (14.8%) | 75 (12.7%) |
| 6:30 AM to 6:59 AM | 41 (6.6%) | 27 (4.6%) |
| 7:00 AM to 7:29 AM | 119 (19.2%) | 48 (8.1%) |
| 7:30 AM to 7:59 AM | 106 (17.1%) | 177 (29.9%) |
| 8:00 AM to 8:29 AM | 101 (16.3%) | 51 (8.6%) |
| 8:30 AM to 8:59 AM | 11 (1.8%) | 72 (12.2%) |
| 9:00 AM to 9:59 AM | 49 (7.9%) | 33 (5.6%) |
| 10:00 AM to 10:59 AM | 0 (0.0%) | 21 (3.5%) |
| 11:00 AM to 11:59 AM | 0 (0.0%) | 0 (0.0%) |
| 12:00 PM to 3:59 PM | 20 (3.2%) | 20 (3.4%) |
| 4:00 PM to 11:59 PM | 46 (7.4%) | 53 (8.9%) |
| Total | 621 (100.0%) | 592 (100.0%) |
Housing Occupancy in Chamberlain
Occupancy by Ownership in Chamberlain
Of the total 871 dwellings in Chamberlain, owner-occupied units account for 480 (55.1%), while renter-occupied units make up 391 (44.9%).
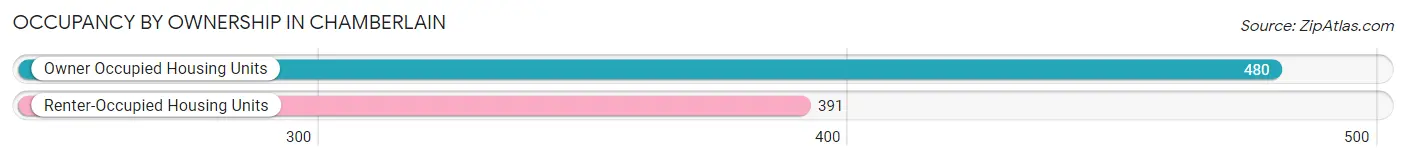
| Occupancy | # Housing Units | % Housing Units |
| Owner Occupied Housing Units | 480 | 55.1% |
| Renter-Occupied Housing Units | 391 | 44.9% |
| Total Occupied Housing Units | 871 | 100.0% |
Occupancy by Household Size in Chamberlain
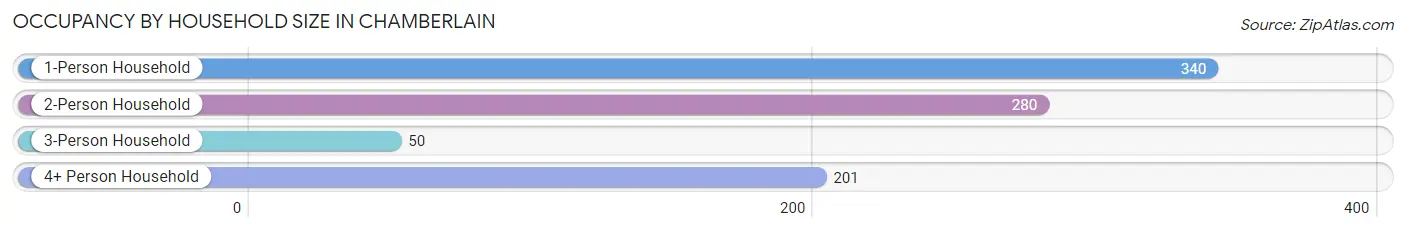
| Household Size | # Housing Units | % Housing Units |
| 1-Person Household | 340 | 39.0% |
| 2-Person Household | 280 | 32.2% |
| 3-Person Household | 50 | 5.7% |
| 4+ Person Household | 201 | 23.1% |
| Total Housing Units | 871 | 100.0% |
Occupancy by Ownership by Household Size in Chamberlain
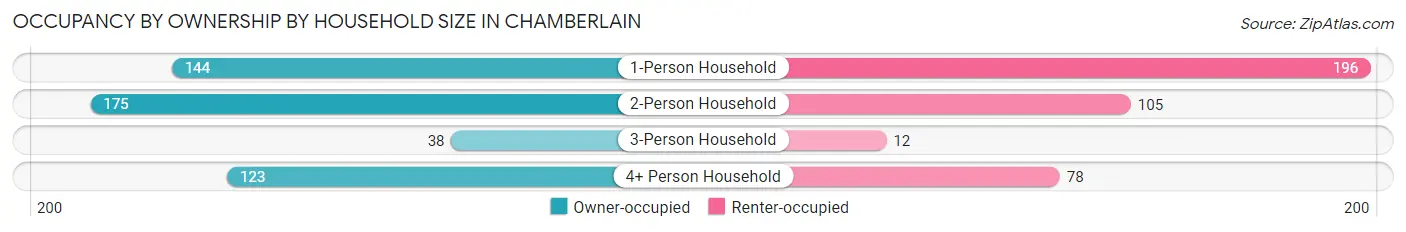
| Household Size | Owner-occupied | Renter-occupied |
| 1-Person Household | 144 (42.3%) | 196 (57.7%) |
| 2-Person Household | 175 (62.5%) | 105 (37.5%) |
| 3-Person Household | 38 (76.0%) | 12 (24.0%) |
| 4+ Person Household | 123 (61.2%) | 78 (38.8%) |
| Total Housing Units | 480 (55.1%) | 391 (44.9%) |
Occupancy by Educational Attainment in Chamberlain
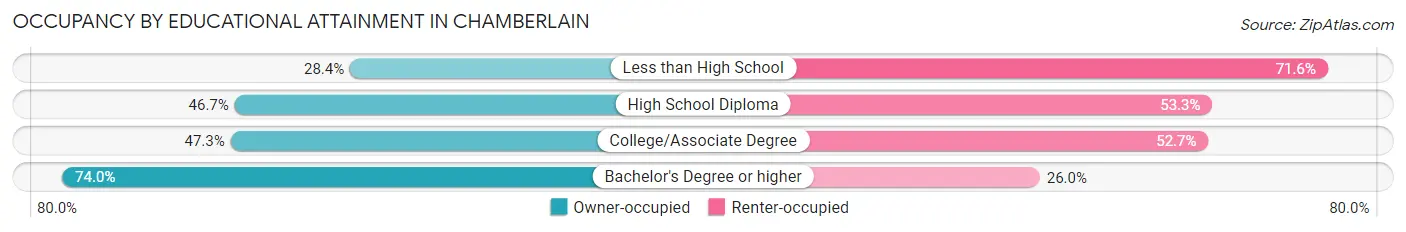
| Household Size | Owner-occupied | Renter-occupied |
| Less than High School | 21 (28.4%) | 53 (71.6%) |
| High School Diploma | 113 (46.7%) | 129 (53.3%) |
| College/Associate Degree | 115 (47.3%) | 128 (52.7%) |
| Bachelor's Degree or higher | 231 (74.0%) | 81 (26.0%) |
Occupancy by Age of Householder in Chamberlain
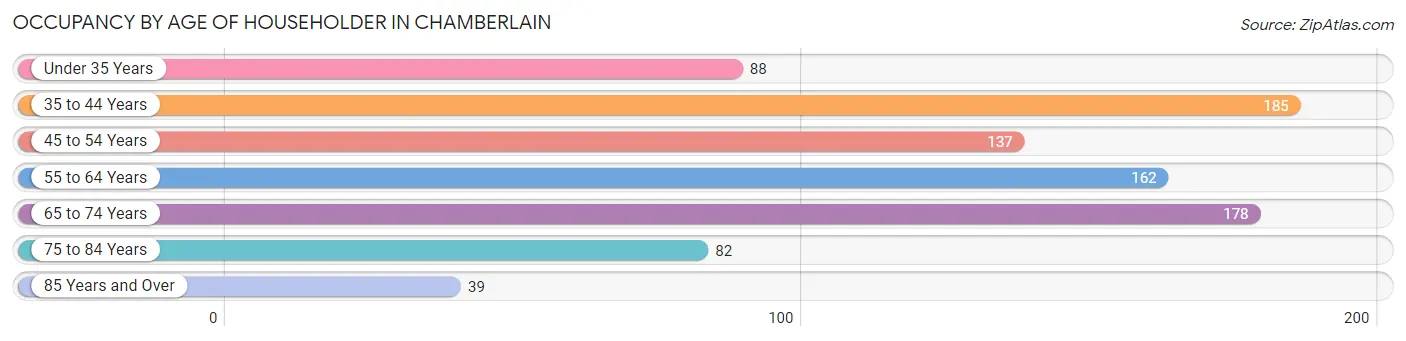
| Age Bracket | # Households | % Households |
| Under 35 Years | 88 | 10.1% |
| 35 to 44 Years | 185 | 21.2% |
| 45 to 54 Years | 137 | 15.7% |
| 55 to 64 Years | 162 | 18.6% |
| 65 to 74 Years | 178 | 20.4% |
| 75 to 84 Years | 82 | 9.4% |
| 85 Years and Over | 39 | 4.5% |
| Total | 871 | 100.0% |
Housing Finances in Chamberlain
Median Income by Occupancy in Chamberlain
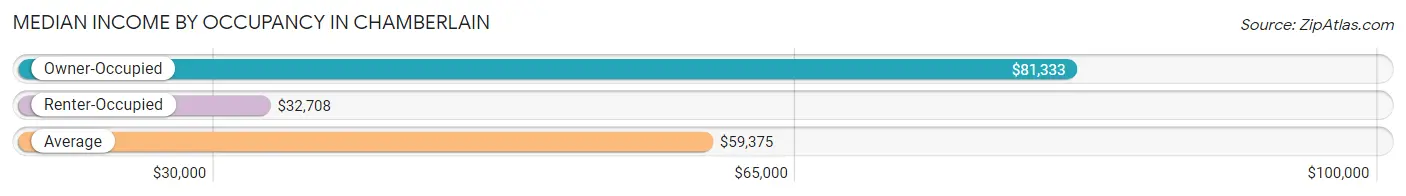
| Occupancy Type | # Households | Median Income |
| Owner-Occupied | 480 (55.1%) | $81,333 |
| Renter-Occupied | 391 (44.9%) | $32,708 |
| Average | 871 (100.0%) | $59,375 |
Occupancy by Householder Income Bracket in Chamberlain
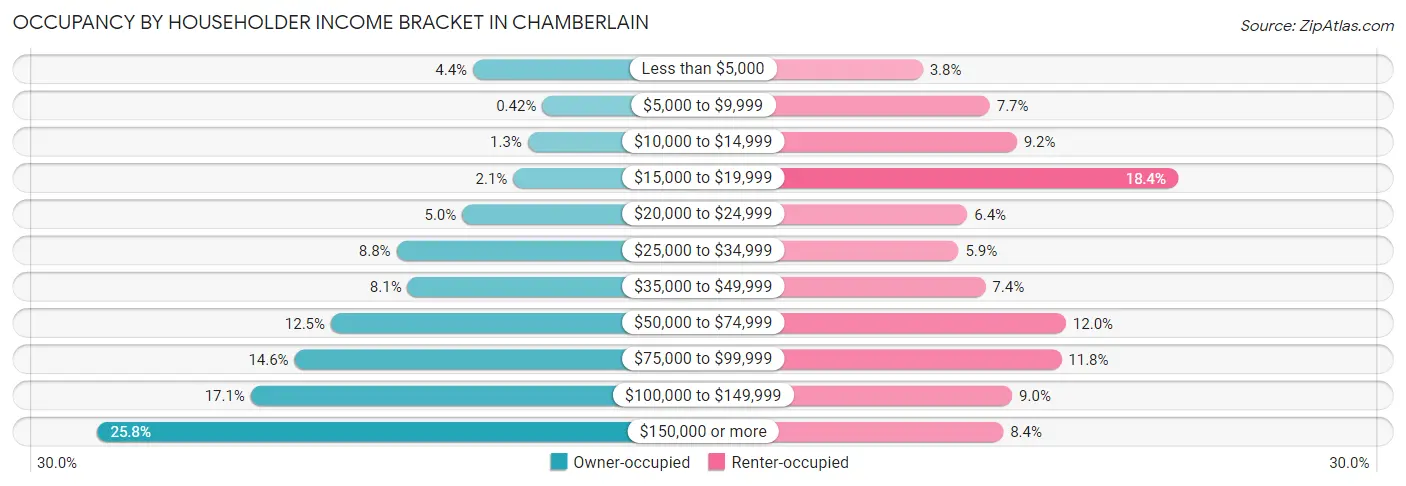
| Income Bracket | Owner-occupied | Renter-occupied |
| Less than $5,000 | 21 (4.4%) | 15 (3.8%) |
| $5,000 to $9,999 | 2 (0.4%) | 30 (7.7%) |
| $10,000 to $14,999 | 6 (1.3%) | 36 (9.2%) |
| $15,000 to $19,999 | 10 (2.1%) | 72 (18.4%) |
| $20,000 to $24,999 | 24 (5.0%) | 25 (6.4%) |
| $25,000 to $34,999 | 42 (8.7%) | 23 (5.9%) |
| $35,000 to $49,999 | 39 (8.1%) | 29 (7.4%) |
| $50,000 to $74,999 | 60 (12.5%) | 47 (12.0%) |
| $75,000 to $99,999 | 70 (14.6%) | 46 (11.8%) |
| $100,000 to $149,999 | 82 (17.1%) | 35 (8.9%) |
| $150,000 or more | 124 (25.8%) | 33 (8.4%) |
| Total | 480 (100.0%) | 391 (100.0%) |
Monthly Housing Cost Tiers in Chamberlain
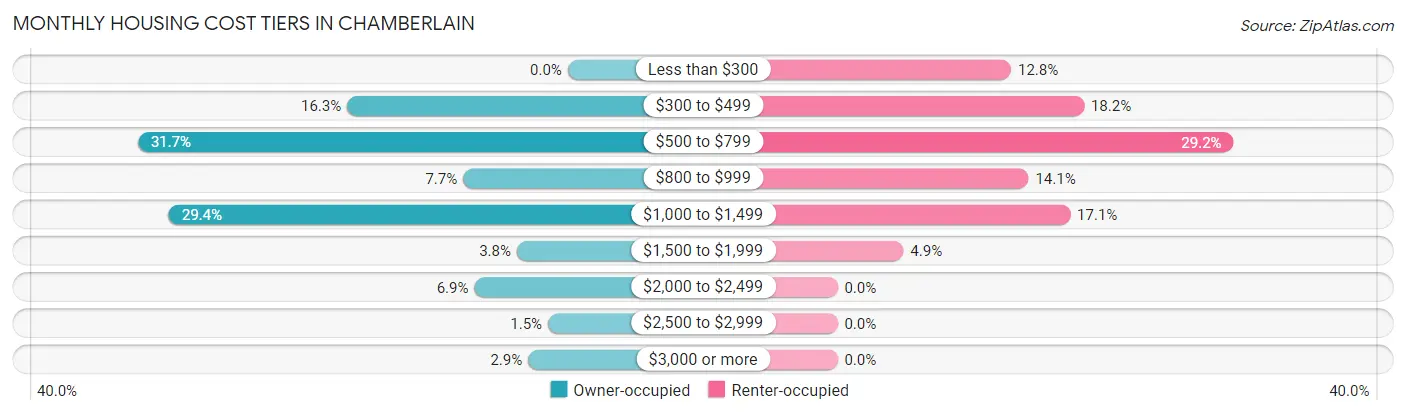
| Monthly Cost | Owner-occupied | Renter-occupied |
| Less than $300 | 0 (0.0%) | 50 (12.8%) |
| $300 to $499 | 78 (16.3%) | 71 (18.2%) |
| $500 to $799 | 152 (31.7%) | 114 (29.2%) |
| $800 to $999 | 37 (7.7%) | 55 (14.1%) |
| $1,000 to $1,499 | 141 (29.4%) | 67 (17.1%) |
| $1,500 to $1,999 | 18 (3.7%) | 19 (4.9%) |
| $2,000 to $2,499 | 33 (6.9%) | 0 (0.0%) |
| $2,500 to $2,999 | 7 (1.5%) | 0 (0.0%) |
| $3,000 or more | 14 (2.9%) | 0 (0.0%) |
| Total | 480 (100.0%) | 391 (100.0%) |
Physical Housing Characteristics in Chamberlain
Housing Structures in Chamberlain
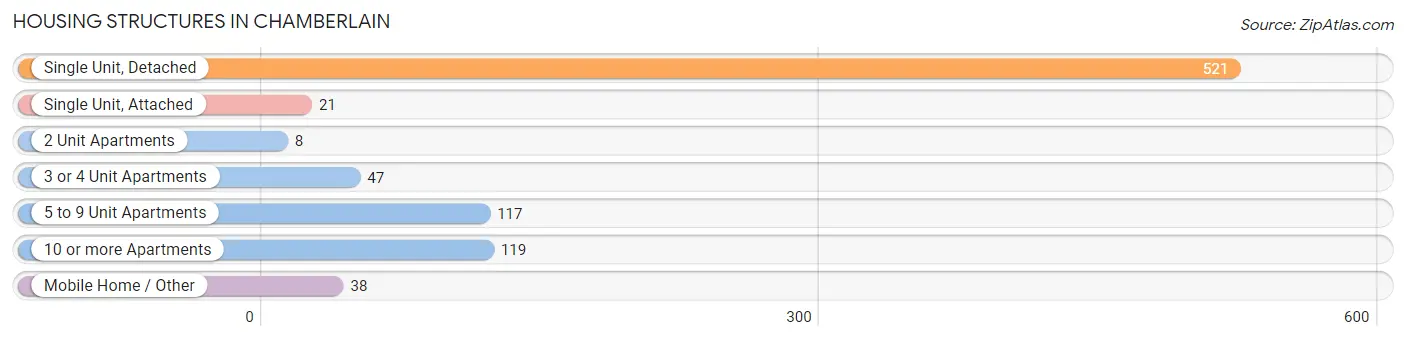
| Structure Type | # Housing Units | % Housing Units |
| Single Unit, Detached | 521 | 59.8% |
| Single Unit, Attached | 21 | 2.4% |
| 2 Unit Apartments | 8 | 0.9% |
| 3 or 4 Unit Apartments | 47 | 5.4% |
| 5 to 9 Unit Apartments | 117 | 13.4% |
| 10 or more Apartments | 119 | 13.7% |
| Mobile Home / Other | 38 | 4.4% |
| Total | 871 | 100.0% |
Housing Structures by Occupancy in Chamberlain
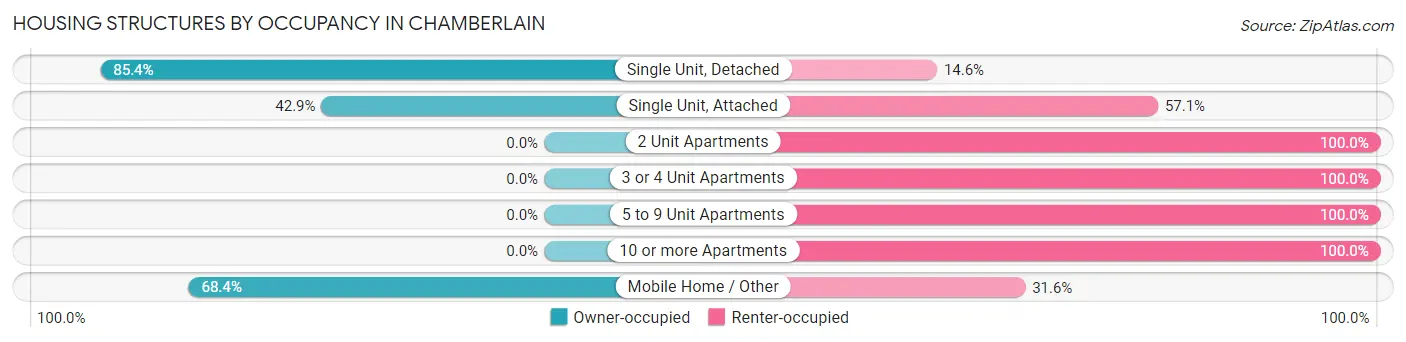
| Structure Type | Owner-occupied | Renter-occupied |
| Single Unit, Detached | 445 (85.4%) | 76 (14.6%) |
| Single Unit, Attached | 9 (42.9%) | 12 (57.1%) |
| 2 Unit Apartments | 0 (0.0%) | 8 (100.0%) |
| 3 or 4 Unit Apartments | 0 (0.0%) | 47 (100.0%) |
| 5 to 9 Unit Apartments | 0 (0.0%) | 117 (100.0%) |
| 10 or more Apartments | 0 (0.0%) | 119 (100.0%) |
| Mobile Home / Other | 26 (68.4%) | 12 (31.6%) |
| Total | 480 (55.1%) | 391 (44.9%) |
Housing Structures by Number of Rooms in Chamberlain
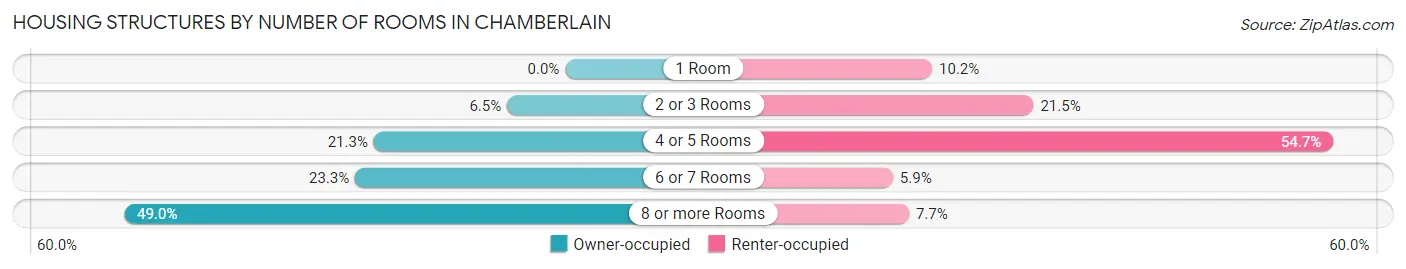
| Number of Rooms | Owner-occupied | Renter-occupied |
| 1 Room | 0 (0.0%) | 40 (10.2%) |
| 2 or 3 Rooms | 31 (6.5%) | 84 (21.5%) |
| 4 or 5 Rooms | 102 (21.2%) | 214 (54.7%) |
| 6 or 7 Rooms | 112 (23.3%) | 23 (5.9%) |
| 8 or more Rooms | 235 (49.0%) | 30 (7.7%) |
| Total | 480 (100.0%) | 391 (100.0%) |
Housing Structure by Heating Type in Chamberlain
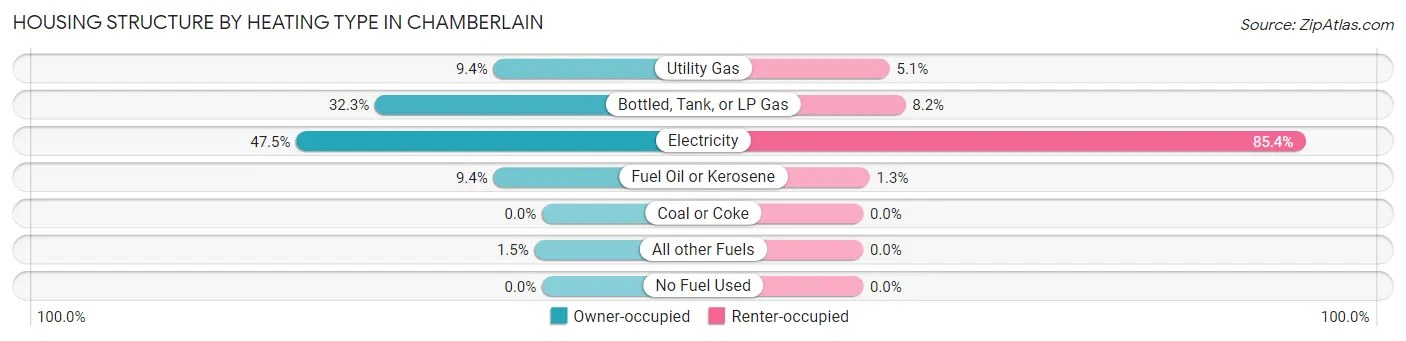
| Heating Type | Owner-occupied | Renter-occupied |
| Utility Gas | 45 (9.4%) | 20 (5.1%) |
| Bottled, Tank, or LP Gas | 155 (32.3%) | 32 (8.2%) |
| Electricity | 228 (47.5%) | 334 (85.4%) |
| Fuel Oil or Kerosene | 45 (9.4%) | 5 (1.3%) |
| Coal or Coke | 0 (0.0%) | 0 (0.0%) |
| All other Fuels | 7 (1.5%) | 0 (0.0%) |
| No Fuel Used | 0 (0.0%) | 0 (0.0%) |
| Total | 480 (100.0%) | 391 (100.0%) |
Household Vehicle Usage in Chamberlain
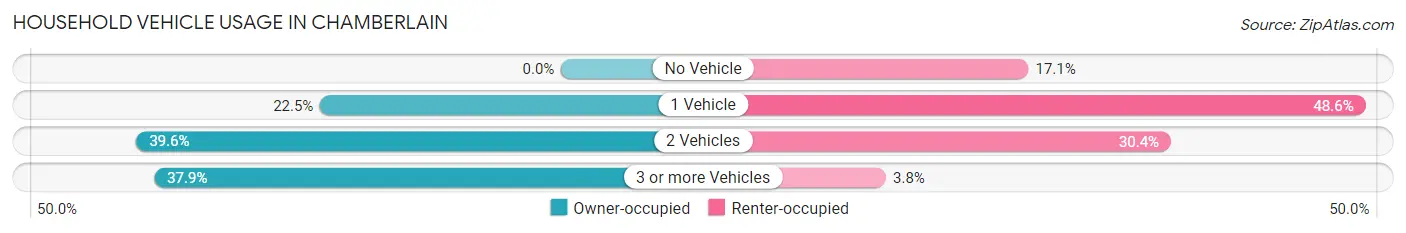
| Vehicles per Household | Owner-occupied | Renter-occupied |
| No Vehicle | 0 (0.0%) | 67 (17.1%) |
| 1 Vehicle | 108 (22.5%) | 190 (48.6%) |
| 2 Vehicles | 190 (39.6%) | 119 (30.4%) |
| 3 or more Vehicles | 182 (37.9%) | 15 (3.8%) |
| Total | 480 (100.0%) | 391 (100.0%) |
Real Estate & Mortgages in Chamberlain
Real Estate and Mortgage Overview in Chamberlain
| Characteristic | Without Mortgage | With Mortgage |
| Housing Units | 268 | 212 |
| Median Property Value | $160,200 | $189,400 |
| Median Household Income | $88,750 | $44 |
| Monthly Housing Costs | $562 | $14 |
| Real Estate Taxes | $1,889 | $0 |
Property Value by Mortgage Status in Chamberlain
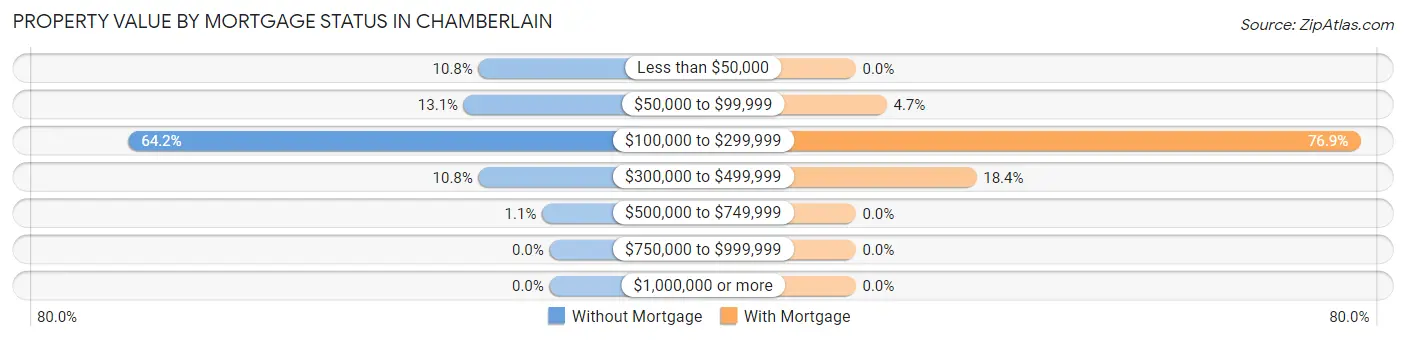
| Property Value | Without Mortgage | With Mortgage |
| Less than $50,000 | 29 (10.8%) | 0 (0.0%) |
| $50,000 to $99,999 | 35 (13.1%) | 10 (4.7%) |
| $100,000 to $299,999 | 172 (64.2%) | 163 (76.9%) |
| $300,000 to $499,999 | 29 (10.8%) | 39 (18.4%) |
| $500,000 to $749,999 | 3 (1.1%) | 0 (0.0%) |
| $750,000 to $999,999 | 0 (0.0%) | 0 (0.0%) |
| $1,000,000 or more | 0 (0.0%) | 0 (0.0%) |
| Total | 268 (100.0%) | 212 (100.0%) |
Household Income by Mortgage Status in Chamberlain
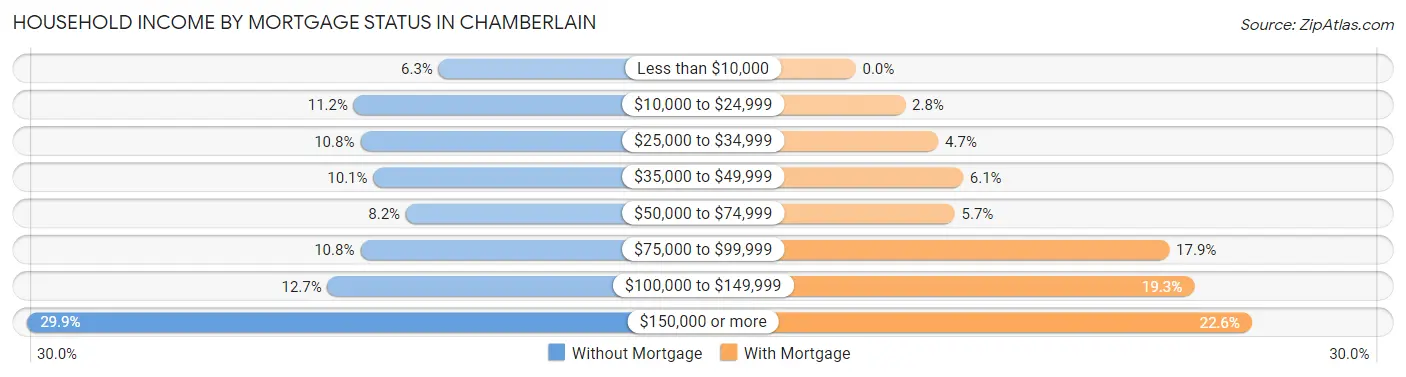
| Household Income | Without Mortgage | With Mortgage |
| Less than $10,000 | 17 (6.3%) | 0 (0.0%) |
| $10,000 to $24,999 | 30 (11.2%) | 6 (2.8%) |
| $25,000 to $34,999 | 29 (10.8%) | 10 (4.7%) |
| $35,000 to $49,999 | 27 (10.1%) | 13 (6.1%) |
| $50,000 to $74,999 | 22 (8.2%) | 12 (5.7%) |
| $75,000 to $99,999 | 29 (10.8%) | 38 (17.9%) |
| $100,000 to $149,999 | 34 (12.7%) | 41 (19.3%) |
| $150,000 or more | 80 (29.8%) | 48 (22.6%) |
| Total | 268 (100.0%) | 212 (100.0%) |
Property Value to Household Income Ratio in Chamberlain
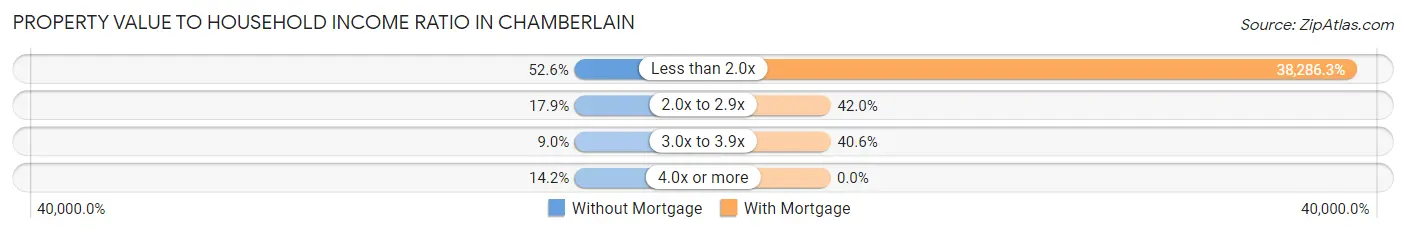
| Value-to-Income Ratio | Without Mortgage | With Mortgage |
| Less than 2.0x | 141 (52.6%) | 81,167 (38,286.3%) |
| 2.0x to 2.9x | 48 (17.9%) | 89 (42.0%) |
| 3.0x to 3.9x | 24 (9.0%) | 86 (40.6%) |
| 4.0x or more | 38 (14.2%) | 0 (0.0%) |
| Total | 268 (100.0%) | 212 (100.0%) |
Real Estate Taxes by Mortgage Status in Chamberlain
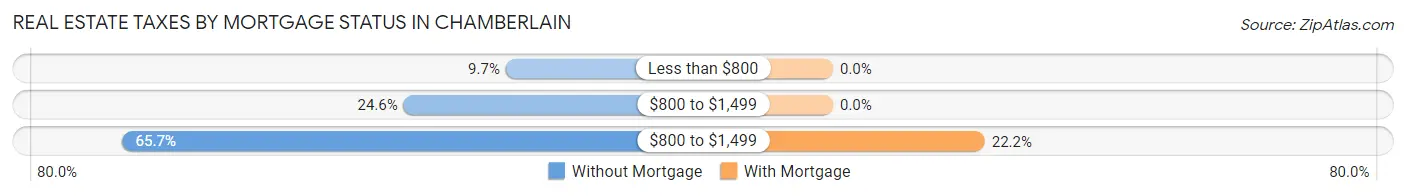
| Property Taxes | Without Mortgage | With Mortgage |
| Less than $800 | 26 (9.7%) | 0 (0.0%) |
| $800 to $1,499 | 66 (24.6%) | 0 (0.0%) |
| $800 to $1,499 | 176 (65.7%) | 47 (22.2%) |
| Total | 268 (100.0%) | 212 (100.0%) |
Health & Disability in Chamberlain
Health Insurance Coverage by Age in Chamberlain
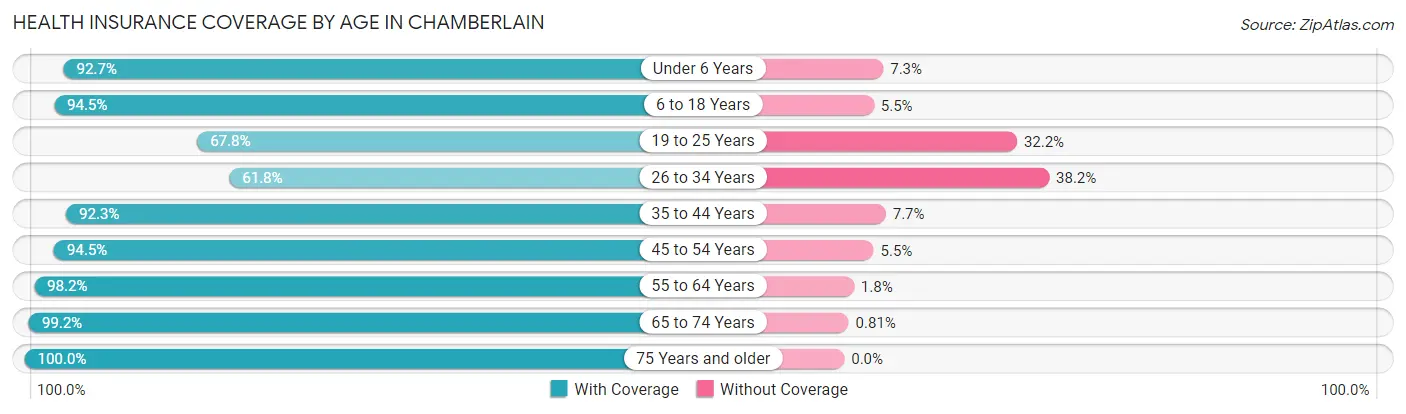
| Age Bracket | With Coverage | Without Coverage |
| Under 6 Years | 153 (92.7%) | 12 (7.3%) |
| 6 to 18 Years | 446 (94.5%) | 26 (5.5%) |
| 19 to 25 Years | 120 (67.8%) | 57 (32.2%) |
| 26 to 34 Years | 123 (61.8%) | 76 (38.2%) |
| 35 to 44 Years | 298 (92.3%) | 25 (7.7%) |
| 45 to 54 Years | 242 (94.5%) | 14 (5.5%) |
| 55 to 64 Years | 385 (98.2%) | 7 (1.8%) |
| 65 to 74 Years | 244 (99.2%) | 2 (0.8%) |
| 75 Years and older | 153 (100.0%) | 0 (0.0%) |
| Total | 2,164 (90.8%) | 219 (9.2%) |
Health Insurance Coverage by Citizenship Status in Chamberlain
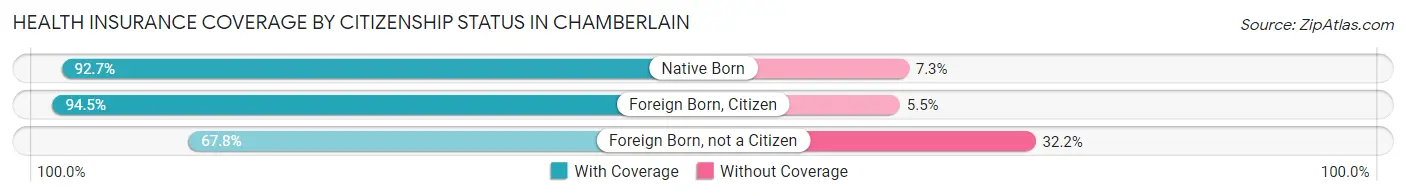
| Citizenship Status | With Coverage | Without Coverage |
| Native Born | 153 (92.7%) | 12 (7.3%) |
| Foreign Born, Citizen | 446 (94.5%) | 26 (5.5%) |
| Foreign Born, not a Citizen | 120 (67.8%) | 57 (32.2%) |
Health Insurance Coverage by Household Income in Chamberlain
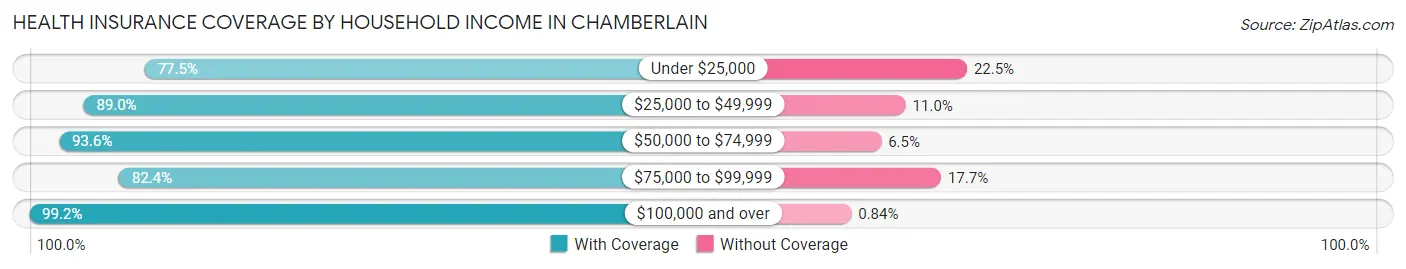
| Household Income | With Coverage | Without Coverage |
| Under $25,000 | 265 (77.5%) | 77 (22.5%) |
| $25,000 to $49,999 | 250 (89.0%) | 31 (11.0%) |
| $50,000 to $74,999 | 290 (93.5%) | 20 (6.5%) |
| $75,000 to $99,999 | 392 (82.4%) | 84 (17.6%) |
| $100,000 and over | 826 (99.2%) | 7 (0.8%) |
Public vs Private Health Insurance Coverage by Age in Chamberlain
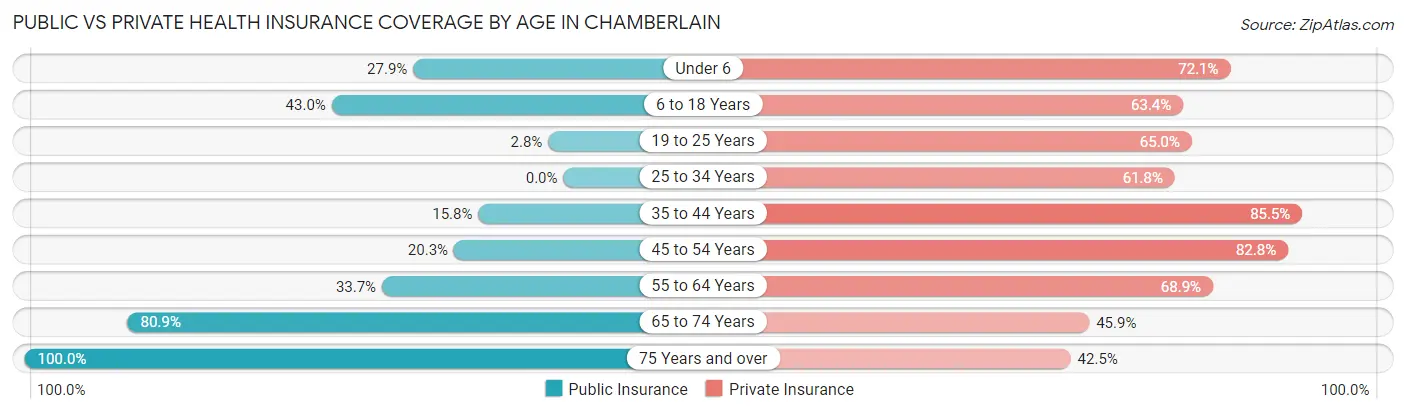
| Age Bracket | Public Insurance | Private Insurance |
| Under 6 | 46 (27.9%) | 119 (72.1%) |
| 6 to 18 Years | 203 (43.0%) | 299 (63.3%) |
| 19 to 25 Years | 5 (2.8%) | 115 (65.0%) |
| 25 to 34 Years | 0 (0.0%) | 123 (61.8%) |
| 35 to 44 Years | 51 (15.8%) | 276 (85.5%) |
| 45 to 54 Years | 52 (20.3%) | 212 (82.8%) |
| 55 to 64 Years | 132 (33.7%) | 270 (68.9%) |
| 65 to 74 Years | 199 (80.9%) | 113 (45.9%) |
| 75 Years and over | 153 (100.0%) | 65 (42.5%) |
| Total | 841 (35.3%) | 1,592 (66.8%) |
Disability Status by Sex by Age in Chamberlain
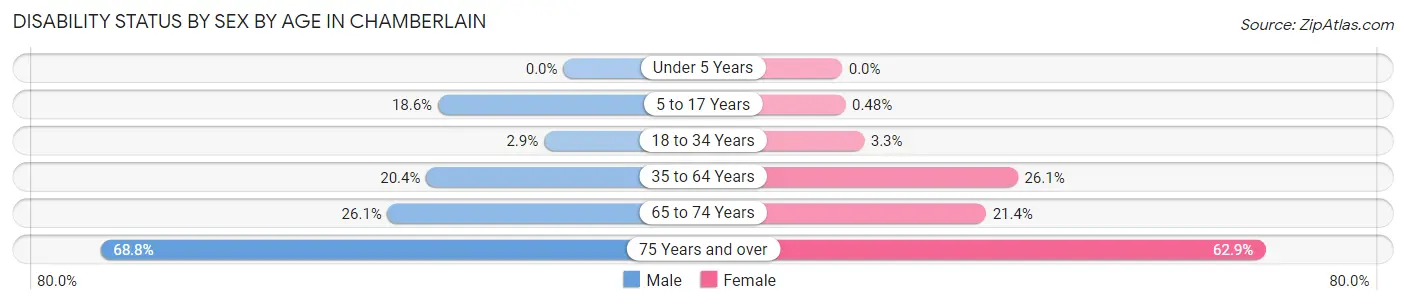
| Age Bracket | Male | Female |
| Under 5 Years | 0 (0.0%) | 0 (0.0%) |
| 5 to 17 Years | 46 (18.6%) | 1 (0.5%) |
| 18 to 34 Years | 6 (2.9%) | 7 (3.3%) |
| 35 to 64 Years | 104 (20.3%) | 120 (26.1%) |
| 65 to 74 Years | 30 (26.1%) | 28 (21.4%) |
| 75 Years and over | 33 (68.8%) | 66 (62.9%) |
Disability Class by Sex by Age in Chamberlain
Disability Class: Hearing Difficulty
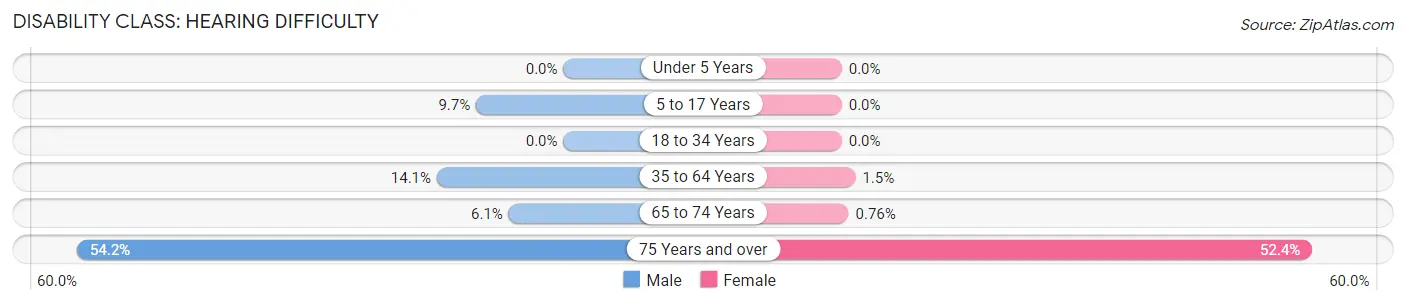
| Age Bracket | Male | Female |
| Under 5 Years | 0 (0.0%) | 0 (0.0%) |
| 5 to 17 Years | 24 (9.7%) | 0 (0.0%) |
| 18 to 34 Years | 0 (0.0%) | 0 (0.0%) |
| 35 to 64 Years | 72 (14.1%) | 7 (1.5%) |
| 65 to 74 Years | 7 (6.1%) | 1 (0.8%) |
| 75 Years and over | 26 (54.2%) | 55 (52.4%) |
Disability Class: Vision Difficulty
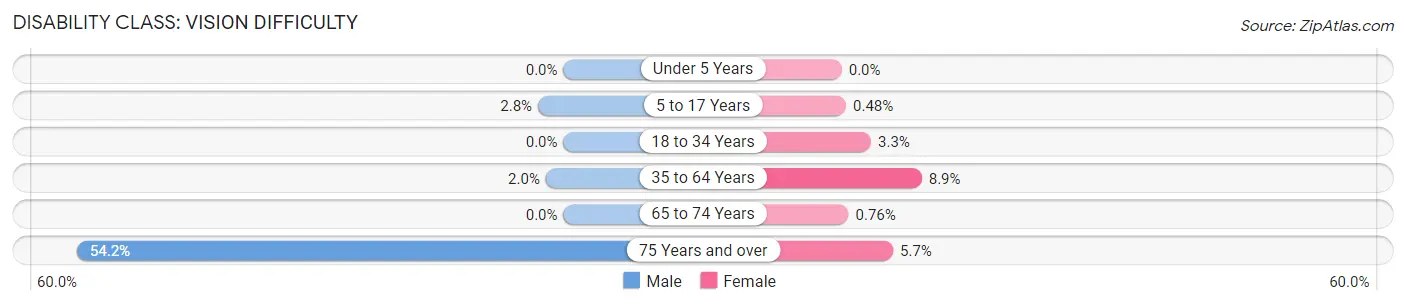
| Age Bracket | Male | Female |
| Under 5 Years | 0 (0.0%) | 0 (0.0%) |
| 5 to 17 Years | 7 (2.8%) | 1 (0.5%) |
| 18 to 34 Years | 0 (0.0%) | 7 (3.3%) |
| 35 to 64 Years | 10 (2.0%) | 41 (8.9%) |
| 65 to 74 Years | 0 (0.0%) | 1 (0.8%) |
| 75 Years and over | 26 (54.2%) | 6 (5.7%) |
Disability Class: Cognitive Difficulty
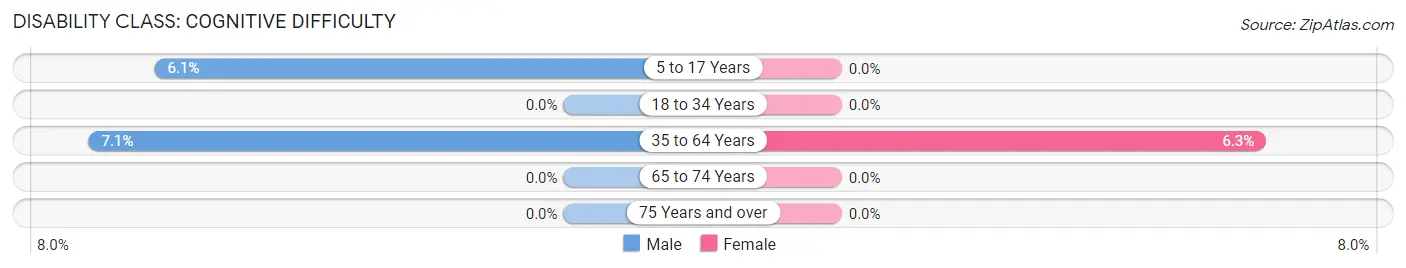
| Age Bracket | Male | Female |
| 5 to 17 Years | 15 (6.1%) | 0 (0.0%) |
| 18 to 34 Years | 0 (0.0%) | 0 (0.0%) |
| 35 to 64 Years | 36 (7.0%) | 29 (6.3%) |
| 65 to 74 Years | 0 (0.0%) | 0 (0.0%) |
| 75 Years and over | 0 (0.0%) | 0 (0.0%) |
Disability Class: Ambulatory Difficulty
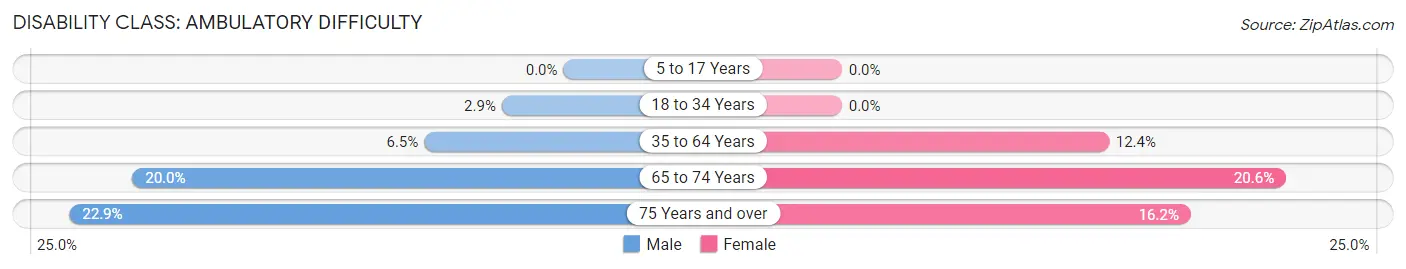
| Age Bracket | Male | Female |
| 5 to 17 Years | 0 (0.0%) | 0 (0.0%) |
| 18 to 34 Years | 6 (2.9%) | 0 (0.0%) |
| 35 to 64 Years | 33 (6.5%) | 57 (12.4%) |
| 65 to 74 Years | 23 (20.0%) | 27 (20.6%) |
| 75 Years and over | 11 (22.9%) | 17 (16.2%) |
Disability Class: Self-Care Difficulty
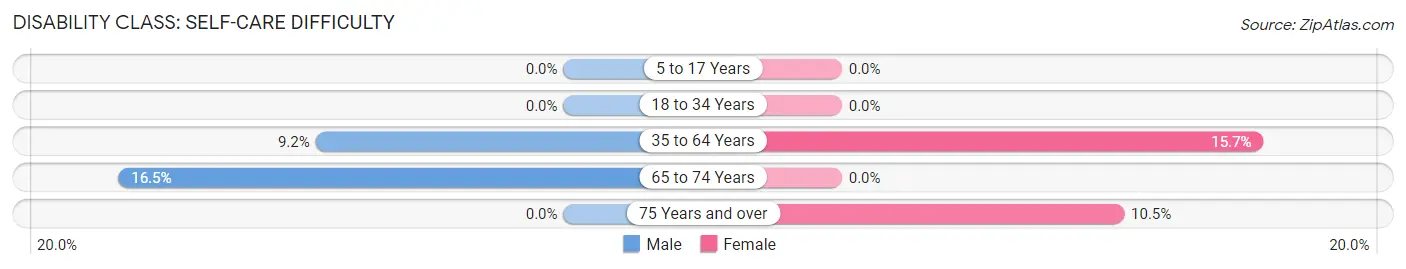
| Age Bracket | Male | Female |
| 5 to 17 Years | 0 (0.0%) | 0 (0.0%) |
| 18 to 34 Years | 0 (0.0%) | 0 (0.0%) |
| 35 to 64 Years | 47 (9.2%) | 72 (15.7%) |
| 65 to 74 Years | 19 (16.5%) | 0 (0.0%) |
| 75 Years and over | 0 (0.0%) | 11 (10.5%) |
Technology Access in Chamberlain
Computing Device Access in Chamberlain
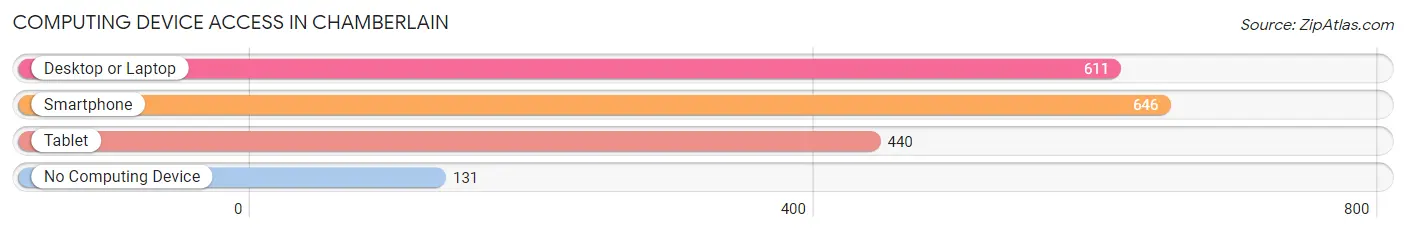
| Device Type | # Households | % Households |
| Desktop or Laptop | 611 | 70.2% |
| Smartphone | 646 | 74.2% |
| Tablet | 440 | 50.5% |
| No Computing Device | 131 | 15.0% |
| Total | 871 | 100.0% |
Internet Access in Chamberlain
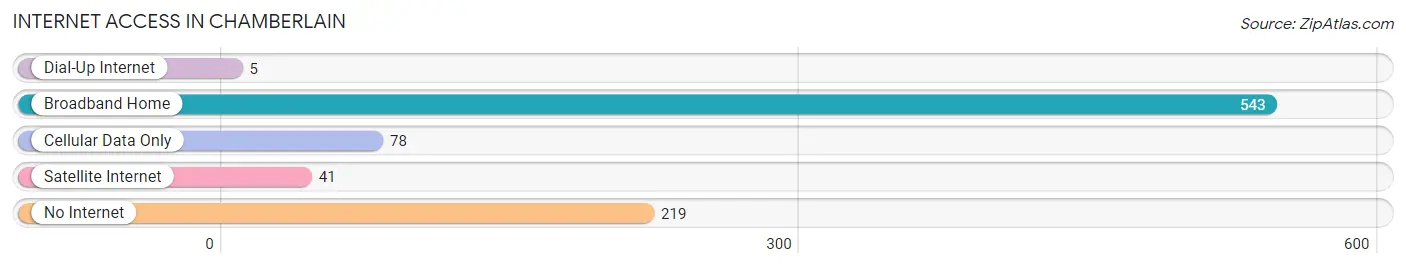
| Internet Type | # Households | % Households |
| Dial-Up Internet | 5 | 0.6% |
| Broadband Home | 543 | 62.3% |
| Cellular Data Only | 78 | 9.0% |
| Satellite Internet | 41 | 4.7% |
| No Internet | 219 | 25.1% |
| Total | 871 | 100.0% |
Chamberlain Summary
Chamberlain, South Dakota is a small city located in Brule County, South Dakota, along the Missouri River. The city is the county seat of Brule County and is home to a population of 2,387 people as of the 2010 census. The city is located in the southeastern corner of the state, approximately 75 miles east of Pierre, the state capital.
History
The area that is now Chamberlain was first settled in the late 1800s by European settlers. The city was founded in 1881 and was named after the first postmaster, George Chamberlain. The city was incorporated in 1883 and was designated as the county seat of Brule County in 1885.
In the early 1900s, the city was a major transportation hub, with the Chicago, Milwaukee, St. Paul and Pacific Railroad running through the city. The railroad was a major factor in the city's growth and development, and it was also the site of a major bridge across the Missouri River.
The city was also home to a number of businesses, including a flour mill, a creamery, a lumber yard, and a number of other businesses. The city also had a number of churches, including the First Congregational Church, which was founded in 1883.
Geography
Chamberlain is located in the southeastern corner of South Dakota, along the Missouri River. The city is located approximately 75 miles east of Pierre, the state capital. The city is located in a flat, open area, with the Missouri River to the east and the Big Bend National Wildlife Refuge to the west.
The city has a total area of 2.2 square miles, all of which is land. The city has a humid continental climate, with hot summers and cold winters. The average temperature in the summer is around 80 degrees Fahrenheit, and the average temperature in the winter is around 20 degrees Fahrenheit.
Economy
The economy of Chamberlain is largely based on agriculture and tourism. The city is home to a number of farms, which produce a variety of crops, including corn, soybeans, wheat, and hay. The city is also home to a number of tourist attractions, including the Big Bend National Wildlife Refuge, the Chamberlain Fish Hatchery, and the Chamberlain Museum.
The city is also home to a number of businesses, including a number of restaurants, hotels, and retail stores. The city is also home to a number of manufacturing companies, including a number of food processing plants.
Demographics
As of the 2010 census, the population of Chamberlain was 2,387. The racial makeup of the city was 95.3% White, 0.7% African American, 0.3% Native American, 0.2% Asian, 0.1% Pacific Islander, 1.2% from other races, and 2.4% from two or more races. Hispanic or Latino of any race were 3.2% of the population.
The median income for a household in the city was $37,917, and the median income for a family was $45,938. The per capita income for the city was $18,945. About 11.2% of families and 14.2% of the population were below the poverty line, including 19.2% of those under age 18 and 8.2% of those age 65 or over.
Common Questions
What is the Total Population of Chamberlain?
Total Population of Chamberlain is 2,538.
What is the Total Male Population of Chamberlain?
Total Male Population of Chamberlain is 1,302.
What is the Total Female Population of Chamberlain?
Total Female Population of Chamberlain is 1,236.
What is the Ratio of Males per 100 Females in Chamberlain?
There are 105.34 Males per 100 Females in Chamberlain.
What is the Ratio of Females per 100 Males in Chamberlain?
There are 94.93 Females per 100 Males in Chamberlain.
What is the Median Population Age in Chamberlain?
Median Population Age in Chamberlain is 40.6 Years.
What is the Average Family Size in Chamberlain
Average Family Size in Chamberlain is 3.5 People.
What is the Average Household Size in Chamberlain
Average Household Size in Chamberlain is 2.6 People.
What is Per Capita Income in Chamberlain?
Per Capita income in Chamberlain is $34,814.
What is the Median Family Income in Chamberlain?
Median Family Income in Chamberlain is $98,750.
What is the Median Household income in Chamberlain?
Median Household Income in Chamberlain is $59,375.
What is Income or Wage Gap in Chamberlain?
Income or Wage Gap in Chamberlain is 26.7%.
Women in Chamberlain earn 73.3 cents for every dollar earned by a man.
What is Inequality or Gini Index in Chamberlain?
Inequality or Gini Index in Chamberlain is 0.49.
How Large is the Labor Force in Chamberlain?
There are 1,348 People in the Labor Forcein in Chamberlain.
What is the Percentage of People in the Labor Force in Chamberlain?
66.5% of People are in the Labor Force in Chamberlain.
What is the Unemployment Rate in Chamberlain?
Unemployment Rate in Chamberlain is 3.5%.