Zip Codes with the Highest Percentage of Population Employed in Life, Physical & Social Science in Pittston, PA
RELATED REPORTS & OPTIONS
Life, Physical & Social Science
Pittston
Compare Zip Codes
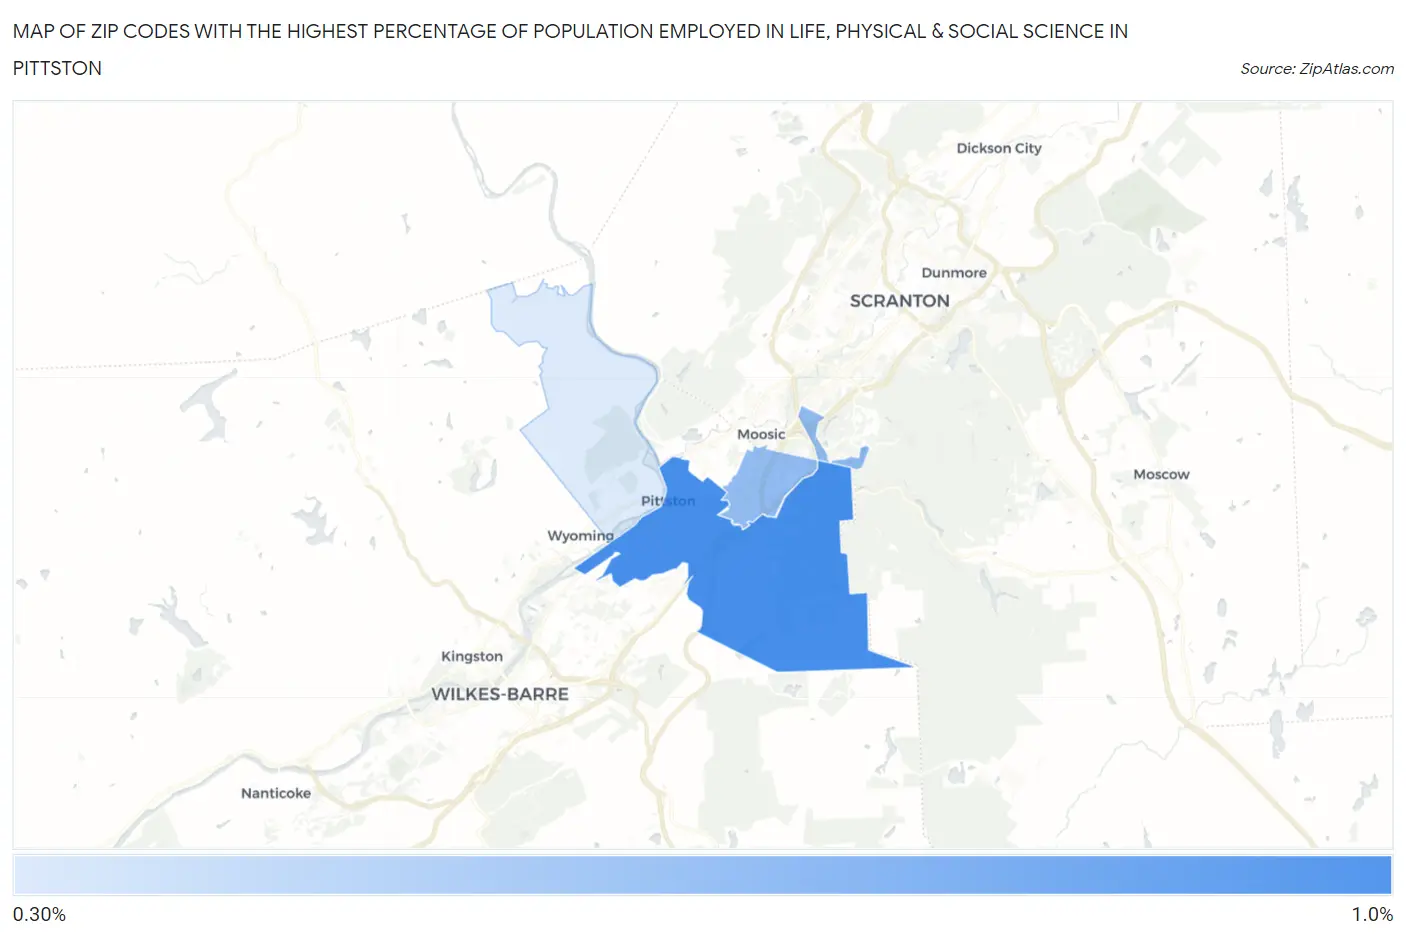
Map of Zip Codes with the Highest Percentage of Population Employed in Life, Physical & Social Science in Pittston
0.0%
1.0%
Zip Codes with the Highest Percentage of Population Employed in Life, Physical & Social Science in Pittston, PA
| Zip Code | % Employed | vs State | vs National | |
| 1. | 18640 | 1.00% | 1.2%(-0.226)#478 | 1.1%(-0.095)#9,071 |
| 2. | 18641 | 0.68% | 1.2%(-0.546)#645 | 1.1%(-0.414)#12,330 |
| 3. | 18643 | 0.36% | 1.2%(-0.858)#852 | 1.1%(-0.726)#16,210 |
1
Common Questions
What are the Top Zip Codes with the Highest Percentage of Population Employed in Life, Physical & Social Science in Pittston, PA?
Top Zip Codes with the Highest Percentage of Population Employed in Life, Physical & Social Science in Pittston, PA are:
What zip code has the Highest Percentage of Population Employed in Life, Physical & Social Science in Pittston, PA?
18640 has the Highest Percentage of Population Employed in Life, Physical & Social Science in Pittston, PA with 1.00%.
What is the Percentage of Population Employed in Life, Physical & Social Science in Pennsylvania?
Percentage of Population Employed in Life, Physical & Social Science in Pennsylvania is 1.2%.
What is the Percentage of Population Employed in Life, Physical & Social Science in the United States?
Percentage of Population Employed in Life, Physical & Social Science in the United States is 1.1%.