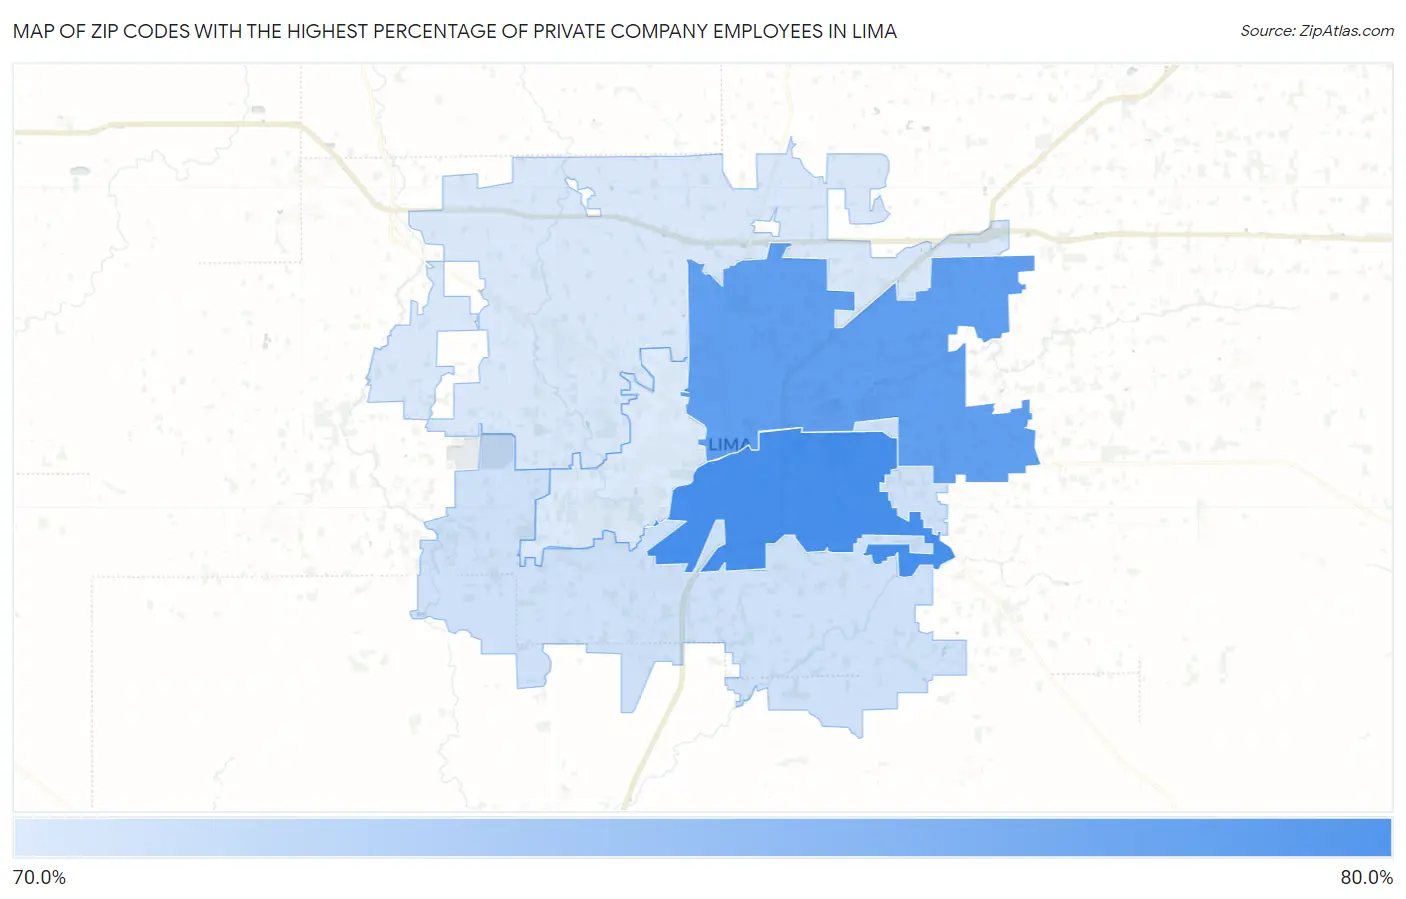
Zip Codes with the Highest Percentage of Private Company Employees in Lima, OH
RELATED REPORTS & OPTIONS
Private Company Employees
Lima
Compare Zip Codes
Map of Zip Codes with the Highest Percentage of Private Company Employees in Lima
0.0%
80.0%
Zip Codes with the Highest Percentage of Private Company Employees in Lima, OH
| Zip Code | % Private Company Employees | vs State | vs National | |
| 1. | 45804 | 79.1% | 69.5%(+9.65)#170 | 66.9%(+12.2)#2,626 |
| 2. | 45801 | 77.7% | 69.5%(+8.22)#223 | 66.9%(+10.8)#3,252 |
| 3. | 45806 | 71.3% | 69.5%(+1.81)#568 | 66.9%(+4.38)#8,725 |
| 4. | 45807 | 70.8% | 69.5%(+1.33)#598 | 66.9%(+3.90)#9,340 |
| 5. | 45805 | 70.5% | 69.5%(+1.08)#615 | 66.9%(+3.64)#9,668 |
1
Common Questions
What are the Top 3 Zip Codes with the Highest Percentage of Private Company Employees in Lima, OH?
Top 3 Zip Codes with the Highest Percentage of Private Company Employees in Lima, OH are:
What zip code has the Highest Percentage of Private Company Employees in Lima, OH?
45804 has the Highest Percentage of Private Company Employees in Lima, OH with 79.1%.
What is the Percentage of Private Company Employees in Lima, OH?
Percentage of Private Company Employees in Lima is 77.0%.
What is the Percentage of Private Company Employees in Ohio?
Percentage of Private Company Employees in Ohio is 69.5%.
What is the Percentage of Private Company Employees in the United States?
Percentage of Private Company Employees in the United States is 66.9%.