Laughlin, NV
Laughlin Map
Laughlin Overview
8,184
TOTAL POPULATION
4,295
MALE POPULATION
3,889
FEMALE POPULATION
110.44
MALES / 100 FEMALES
90.55
FEMALES / 100 MALES
59.9
MEDIAN AGE
2.5
AVG FAMILY SIZE
1.9
AVG HOUSEHOLD SIZE
$31,531
PER CAPITA INCOME
$63,064
AVG FAMILY INCOME
$44,359
AVG HOUSEHOLD INCOME
33.3%
WAGE / INCOME GAP [ % ]
66.7¢/ $1
WAGE / INCOME GAP [ $ ]
0.44
INEQUALITY / GINI INDEX
2,990
LABOR FORCE [ PEOPLE ]
39.8%
PERCENT IN LABOR FORCE
11.7%
UNEMPLOYMENT RATE
Laughlin Zip Codes
Laughlin Area Codes
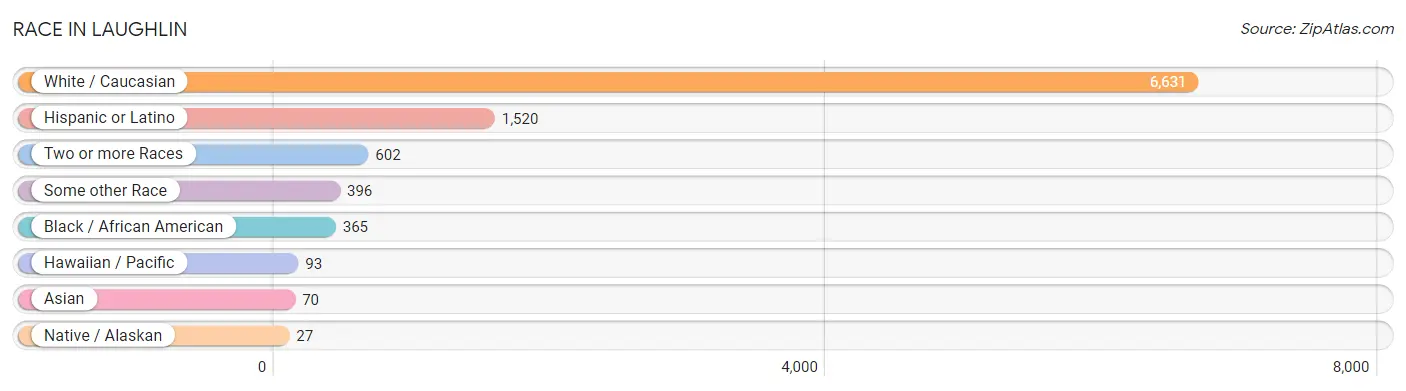
Race in Laughlin
The most populous races in Laughlin are White / Caucasian (6,631 | 81.0%), Hispanic or Latino (1,520 | 18.6%), and Two or more Races (602 | 7.4%).
| Race | # Population | % Population |
| Asian | 70 | 0.9% |
| Black / African American | 365 | 4.5% |
| Hawaiian / Pacific | 93 | 1.1% |
| Hispanic or Latino | 1,520 | 18.6% |
| Native / Alaskan | 27 | 0.3% |
| White / Caucasian | 6,631 | 81.0% |
| Two or more Races | 602 | 7.4% |
| Some other Race | 396 | 4.8% |
| Total | 8,184 | 100.0% |
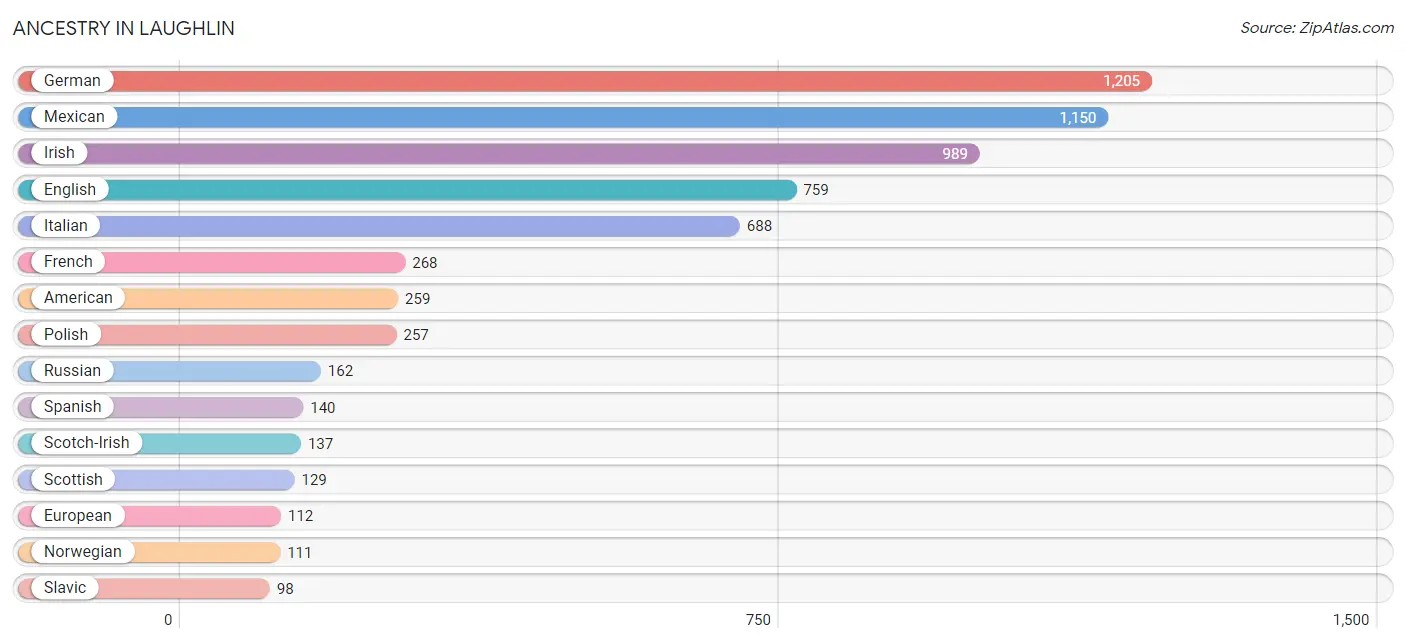
Ancestry in Laughlin
The most populous ancestries reported in Laughlin are German (1,205 | 14.7%), Mexican (1,150 | 14.1%), Irish (989 | 12.1%), English (759 | 9.3%), and Italian (688 | 8.4%), together accounting for 58.5% of all Laughlin residents.
| Ancestry | # Population | % Population |
| African | 14 | 0.2% |
| American | 259 | 3.2% |
| Arab | 34 | 0.4% |
| Austrian | 25 | 0.3% |
| Bhutanese | 16 | 0.2% |
| Bolivian | 8 | 0.1% |
| Brazilian | 10 | 0.1% |
| British | 12 | 0.2% |
| Burmese | 55 | 0.7% |
| Celtic | 10 | 0.1% |
| Central American | 13 | 0.2% |
| Central American Indian | 14 | 0.2% |
| Cherokee | 17 | 0.2% |
| Colombian | 17 | 0.2% |
| Croatian | 22 | 0.3% |
| Cuban | 18 | 0.2% |
| Czech | 20 | 0.2% |
| Czechoslovakian | 17 | 0.2% |
| Danish | 56 | 0.7% |
| Dutch | 35 | 0.4% |
| Egyptian | 7 | 0.1% |
| English | 759 | 9.3% |
| European | 112 | 1.4% |
| Finnish | 55 | 0.7% |
| French | 268 | 3.3% |
| French Canadian | 85 | 1.0% |
| German | 1,205 | 14.7% |
| Greek | 79 | 1.0% |
| Guamanian / Chamorro | 64 | 0.8% |
| Guatemalan | 7 | 0.1% |
| Hungarian | 11 | 0.1% |
| Indian (Asian) | 27 | 0.3% |
| Irish | 989 | 12.1% |
| Israeli | 9 | 0.1% |
| Italian | 688 | 8.4% |
| Korean | 51 | 0.6% |
| Lithuanian | 7 | 0.1% |
| Mexican | 1,150 | 14.1% |
| Mexican American Indian | 8 | 0.1% |
| Native Hawaiian | 7 | 0.1% |
| Norwegian | 111 | 1.4% |
| Pakistani | 5 | 0.1% |
| Pennsylvania German | 10 | 0.1% |
| Polish | 257 | 3.1% |
| Portuguese | 13 | 0.2% |
| Puerto Rican | 32 | 0.4% |
| Russian | 162 | 2.0% |
| Salvadoran | 6 | 0.1% |
| Samoan | 13 | 0.2% |
| Scandinavian | 30 | 0.4% |
| Scotch-Irish | 137 | 1.7% |
| Scottish | 129 | 1.6% |
| Shoshone | 5 | 0.1% |
| Sioux | 16 | 0.2% |
| Slavic | 98 | 1.2% |
| Slovene | 11 | 0.1% |
| South American | 25 | 0.3% |
| Spaniard | 16 | 0.2% |
| Spanish | 140 | 1.7% |
| Subsaharan African | 14 | 0.2% |
| Swedish | 69 | 0.8% |
| Swiss | 53 | 0.6% |
| Ukrainian | 13 | 0.2% |
| Welsh | 75 | 0.9% | View All 64 Rows |
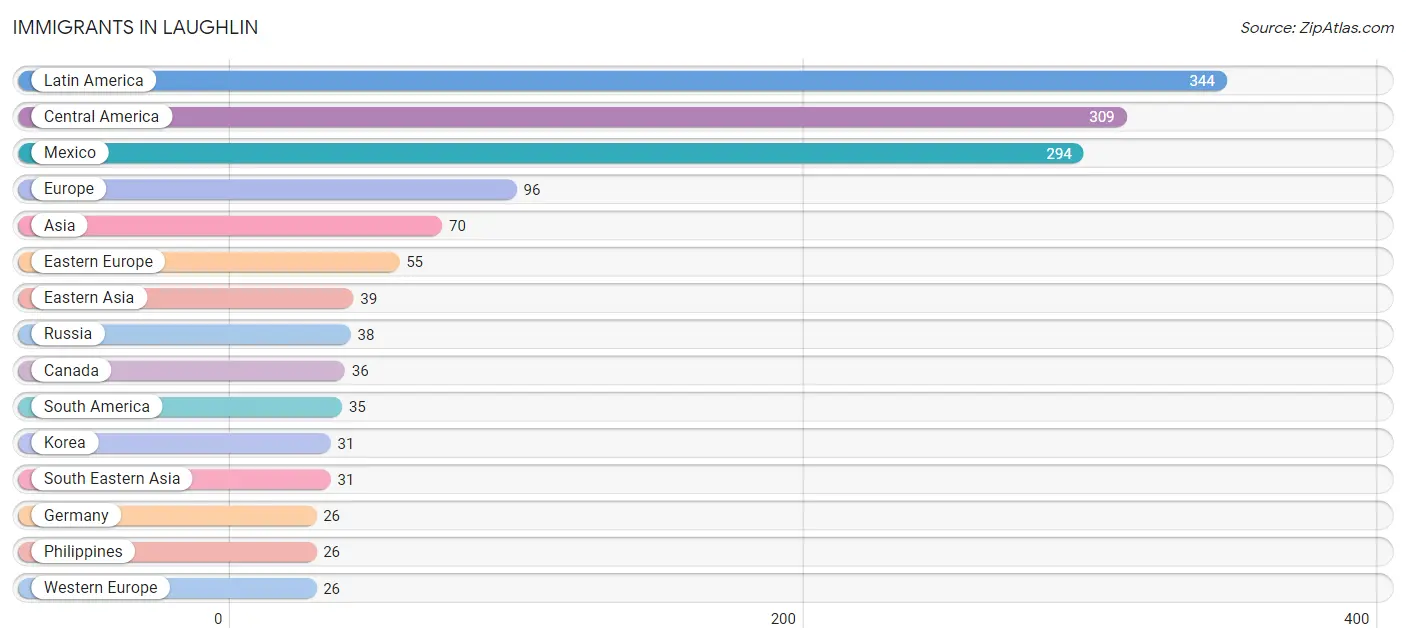
Immigrants in Laughlin
The most numerous immigrant groups reported in Laughlin came from Latin America (344 | 4.2%), Central America (309 | 3.8%), Mexico (294 | 3.6%), Europe (96 | 1.2%), and Asia (70 | 0.9%), together accounting for 13.6% of all Laughlin residents.
| Immigration Origin | # Population | % Population |
| Asia | 70 | 0.9% |
| Bolivia | 8 | 0.1% |
| Brazil | 10 | 0.1% |
| Canada | 36 | 0.4% |
| Central America | 309 | 3.8% |
| China | 8 | 0.1% |
| Colombia | 17 | 0.2% |
| Eastern Asia | 39 | 0.5% |
| Eastern Europe | 55 | 0.7% |
| Europe | 96 | 1.2% |
| Germany | 26 | 0.3% |
| Guatemala | 15 | 0.2% |
| Ireland | 9 | 0.1% |
| Korea | 31 | 0.4% |
| Latin America | 344 | 4.2% |
| Mexico | 294 | 3.6% |
| Northern Europe | 9 | 0.1% |
| Oceania | 13 | 0.2% |
| Philippines | 26 | 0.3% |
| Poland | 17 | 0.2% |
| Portugal | 6 | 0.1% |
| Russia | 38 | 0.5% |
| South America | 35 | 0.4% |
| South Eastern Asia | 31 | 0.4% |
| Southern Europe | 6 | 0.1% |
| Thailand | 5 | 0.1% |
| Western Europe | 26 | 0.3% | View All 27 Rows |
Sex and Age in Laughlin
Sex and Age in Laughlin
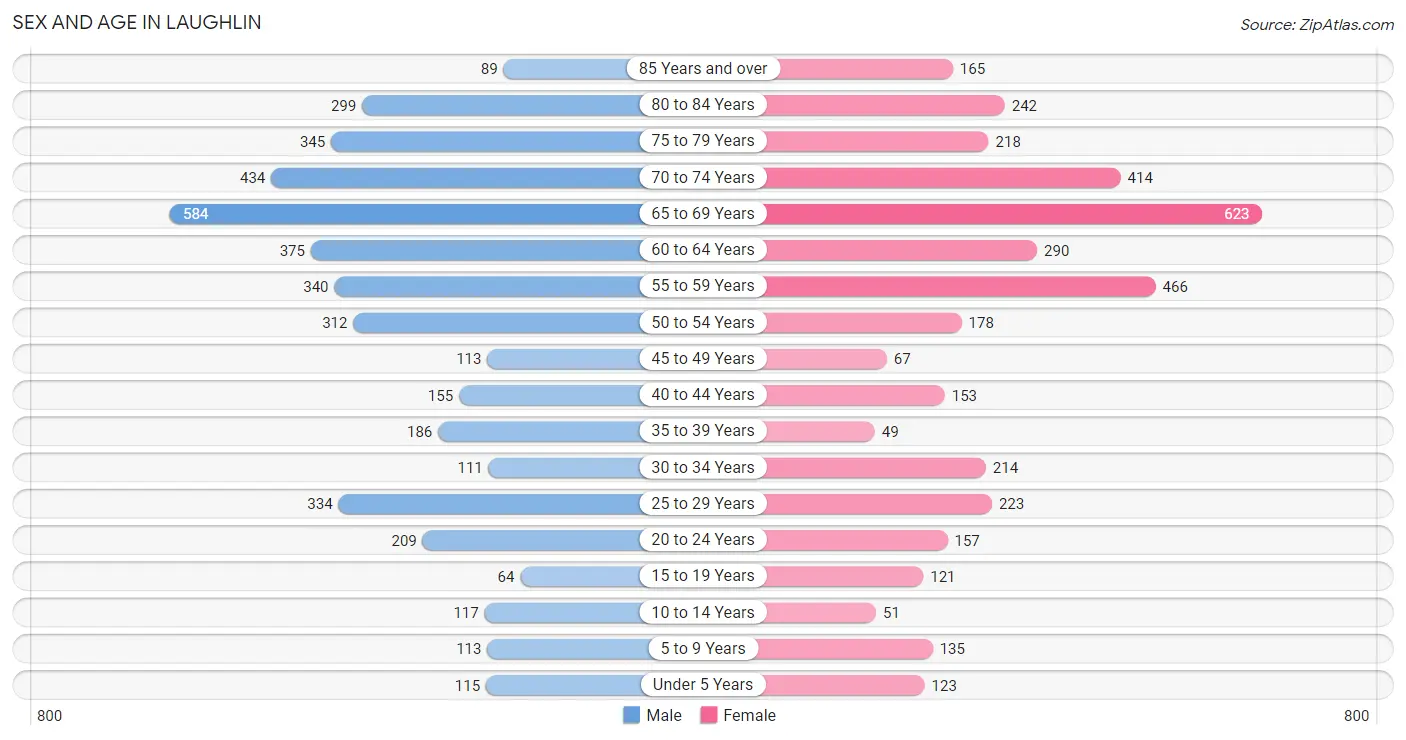
The most populous age groups in Laughlin are 65 to 69 Years (584 | 13.6%) for men and 65 to 69 Years (623 | 16.0%) for women.
| Age Bracket | Male | Female |
| Under 5 Years | 115 (2.7%) | 123 (3.2%) |
| 5 to 9 Years | 113 (2.6%) | 135 (3.5%) |
| 10 to 14 Years | 117 (2.7%) | 51 (1.3%) |
| 15 to 19 Years | 64 (1.5%) | 121 (3.1%) |
| 20 to 24 Years | 209 (4.9%) | 157 (4.0%) |
| 25 to 29 Years | 334 (7.8%) | 223 (5.7%) |
| 30 to 34 Years | 111 (2.6%) | 214 (5.5%) |
| 35 to 39 Years | 186 (4.3%) | 49 (1.3%) |
| 40 to 44 Years | 155 (3.6%) | 153 (3.9%) |
| 45 to 49 Years | 113 (2.6%) | 67 (1.7%) |
| 50 to 54 Years | 312 (7.3%) | 178 (4.6%) |
| 55 to 59 Years | 340 (7.9%) | 466 (12.0%) |
| 60 to 64 Years | 375 (8.7%) | 290 (7.5%) |
| 65 to 69 Years | 584 (13.6%) | 623 (16.0%) |
| 70 to 74 Years | 434 (10.1%) | 414 (10.6%) |
| 75 to 79 Years | 345 (8.0%) | 218 (5.6%) |
| 80 to 84 Years | 299 (7.0%) | 242 (6.2%) |
| 85 Years and over | 89 (2.1%) | 165 (4.2%) |
| Total | 4,295 (100.0%) | 3,889 (100.0%) |
Families and Households in Laughlin
Median Family Size in Laughlin
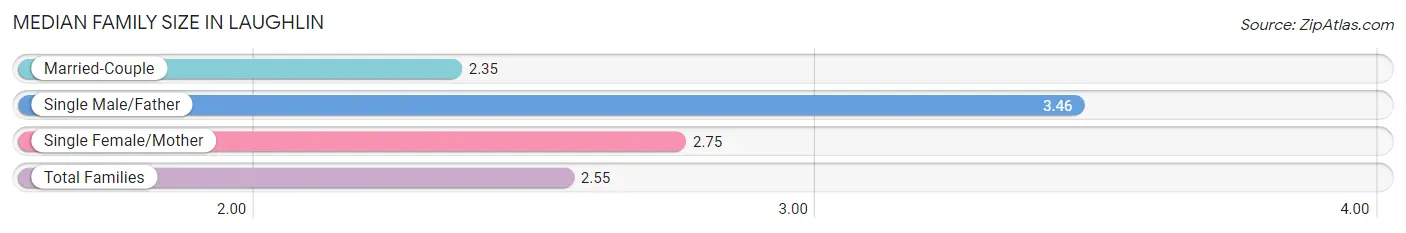
The median family size in Laughlin is 2.55 persons per family, with single male/father families (224 | 10.7%) accounting for the largest median family size of 3.46 persons per family. On the other hand, married-couple families (1,450 | 69.6%) represent the smallest median family size with 2.35 persons per family.
| Family Type | # Families | Family Size |
| Married-Couple | 1,450 (69.6%) | 2.35 |
| Single Male/Father | 224 (10.7%) | 3.46 |
| Single Female/Mother | 409 (19.6%) | 2.75 |
| Total Families | 2,083 (100.0%) | 2.55 |
Median Household Size in Laughlin
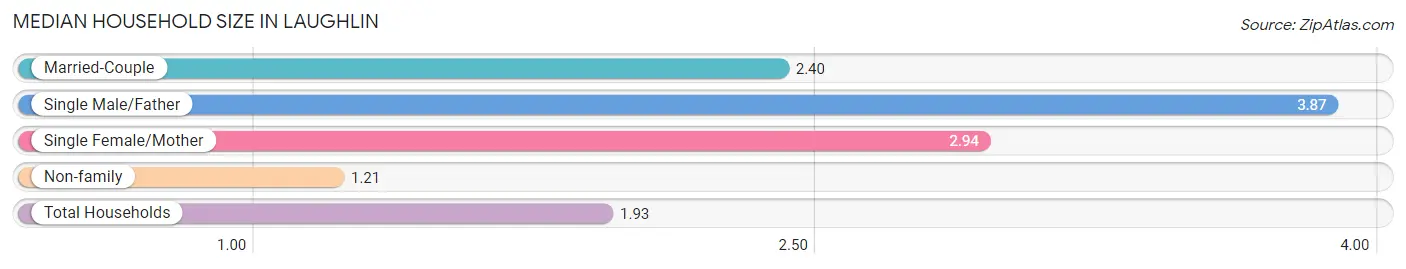
The median household size in Laughlin is 1.93 persons per household, with single male/father households (224 | 5.3%) accounting for the largest median household size of 3.87 persons per household. non-family households (2,165 | 51.0%) represent the smallest median household size with 1.21 persons per household.
| Household Type | # Households | Household Size |
| Married-Couple | 1,450 (34.1%) | 2.40 |
| Single Male/Father | 224 (5.3%) | 3.87 |
| Single Female/Mother | 409 (9.6%) | 2.94 |
| Non-family | 2,165 (51.0%) | 1.21 |
| Total Households | 4,248 (100.0%) | 1.93 |
Household Size by Marriage Status in Laughlin
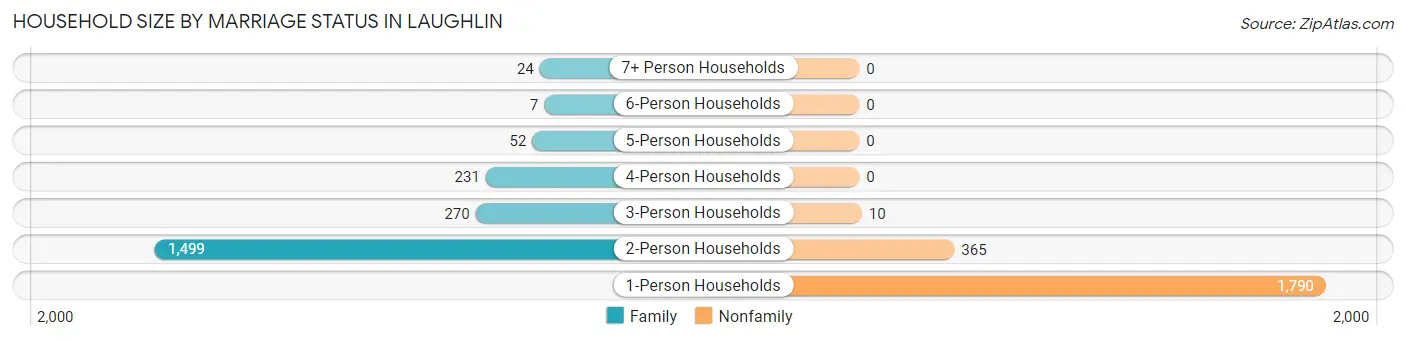
Out of a total of 4,248 households in Laughlin, 2,083 (49.0%) are family households, while 2,165 (51.0%) are nonfamily households. The most numerous type of family households are 2-person households, comprising 1,499, and the most common type of nonfamily households are 1-person households, comprising 1,790.
| Household Size | Family Households | Nonfamily Households |
| 1-Person Households | - | 1,790 (42.1%) |
| 2-Person Households | 1,499 (35.3%) | 365 (8.6%) |
| 3-Person Households | 270 (6.4%) | 10 (0.2%) |
| 4-Person Households | 231 (5.4%) | 0 (0.0%) |
| 5-Person Households | 52 (1.2%) | 0 (0.0%) |
| 6-Person Households | 7 (0.2%) | 0 (0.0%) |
| 7+ Person Households | 24 (0.6%) | 0 (0.0%) |
| Total | 2,083 (49.0%) | 2,165 (51.0%) |
Female Fertility in Laughlin
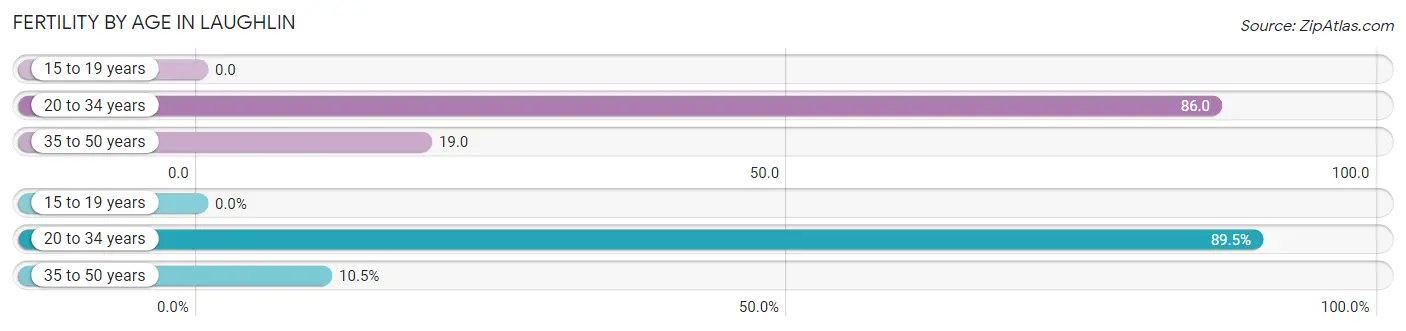
Fertility by Age in Laughlin
Average fertility rate in Laughlin is 55.0 births per 1,000 women. Women in the age bracket of 20 to 34 years have the highest fertility rate with 86.0 births per 1,000 women. Women in the age bracket of 20 to 34 years acount for 89.5% of all women with births.
| Age Bracket | Women with Births | Births / 1,000 Women |
| 15 to 19 years | 0 (0.0%) | 0.0 |
| 20 to 34 years | 51 (89.5%) | 86.0 |
| 35 to 50 years | 6 (10.5%) | 19.0 |
| Total | 57 (100.0%) | 55.0 |
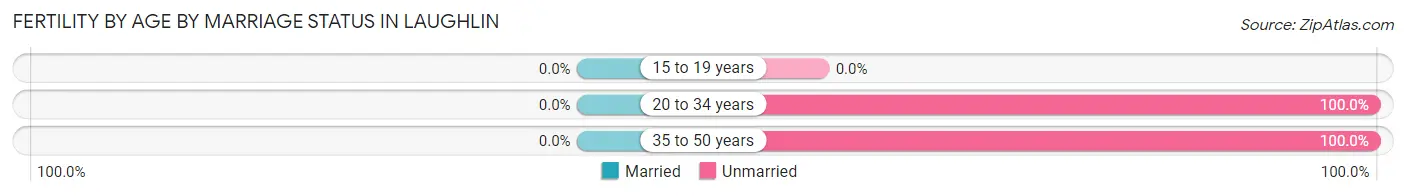
Fertility by Age by Marriage Status in Laughlin
| Age Bracket | Married | Unmarried |
| 15 to 19 years | 0 (0.0%) | 0 (0.0%) |
| 20 to 34 years | 0 (0.0%) | 51 (100.0%) |
| 35 to 50 years | 0 (0.0%) | 6 (100.0%) |
| Total | 0 (0.0%) | 57 (100.0%) |
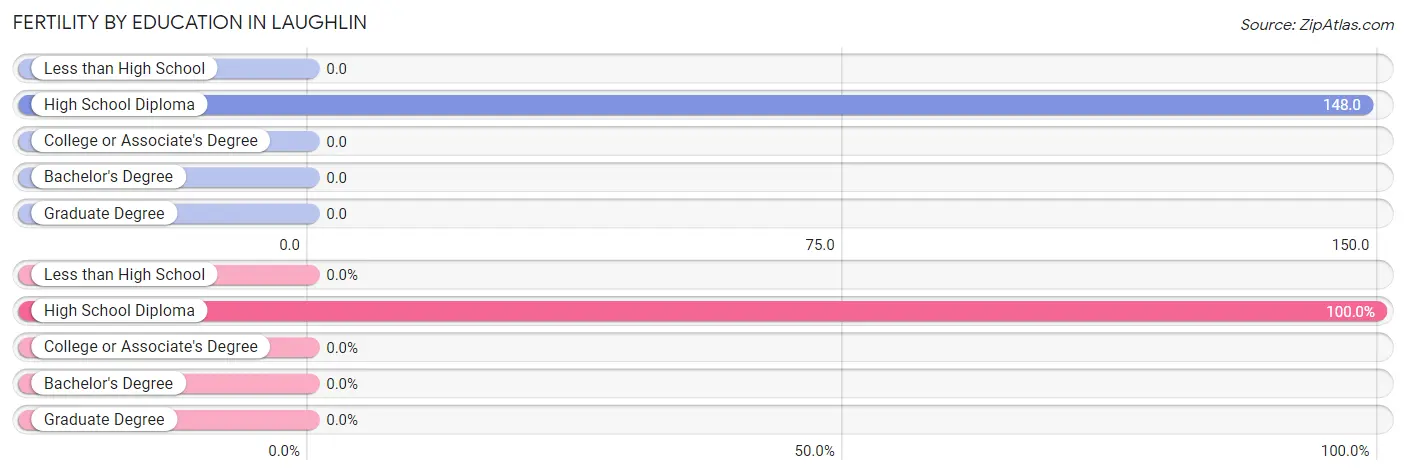
Fertility by Education in Laughlin
| Educational Attainment | Women with Births | Births / 1,000 Women |
| Less than High School | 0 (0.0%) | 0.0 |
| High School Diploma | 57 (100.0%) | 148.0 |
| College or Associate's Degree | 0 (0.0%) | 0.0 |
| Bachelor's Degree | 0 (0.0%) | 0.0 |
| Graduate Degree | 0 (0.0%) | 0.0 |
| Total | 57 (100.0%) | 55.0 |
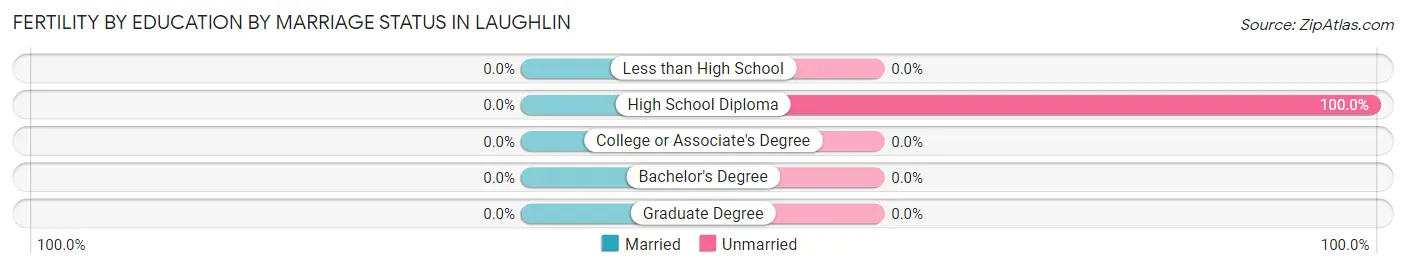
Fertility by Education by Marriage Status in Laughlin
| Educational Attainment | Married | Unmarried |
| Less than High School | 0 (0.0%) | 0 (0.0%) |
| High School Diploma | 0 (0.0%) | 57 (100.0%) |
| College or Associate's Degree | 0 (0.0%) | 0 (0.0%) |
| Bachelor's Degree | 0 (0.0%) | 0 (0.0%) |
| Graduate Degree | 0 (0.0%) | 0 (0.0%) |
| Total | 0 (0.0%) | 57 (100.0%) |
Income in Laughlin
Income Overview in Laughlin
Per Capita Income in Laughlin is $31,531, while median incomes of families and households are $63,064 and $44,359 respectively.
| Characteristic | Number | Measure |
| Per Capita Income | 8,184 | $31,531 |
| Median Family Income | 2,083 | $63,064 |
| Mean Family Income | 2,083 | $68,686 |
| Median Household Income | 4,248 | $44,359 |
| Mean Household Income | 4,248 | $57,969 |
| Income Deficit | 2,083 | $0 |
| Wage / Income Gap (%) | 8,184 | 33.27% |
| Wage / Income Gap ($) | 8,184 | 66.73¢ per $1 |
| Gini / Inequality Index | 8,184 | 0.44 |
Earnings by Sex in Laughlin
Average Earnings in Laughlin are $29,136, $35,049 for men and $23,387 for women, a difference of 33.3%.
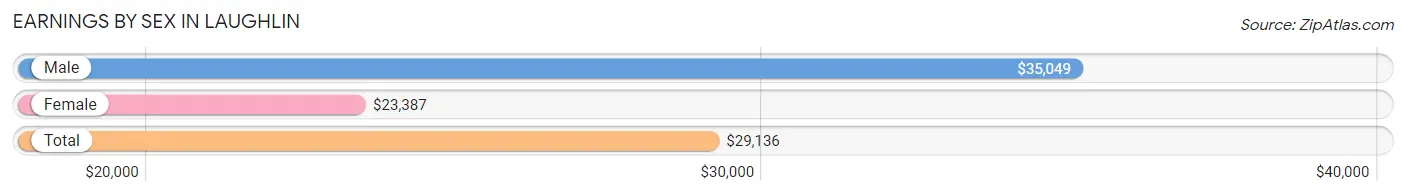
| Sex | Number | Average Earnings |
| Male | 1,696 (56.7%) | $35,049 |
| Female | 1,293 (43.3%) | $23,387 |
| Total | 2,989 (100.0%) | $29,136 |
Earnings by Sex by Income Bracket in Laughlin
The most common earnings brackets in Laughlin are $25,000 to $29,999 for men (246 | 14.5%) and $2,500 to $4,999 for women (135 | 10.4%).
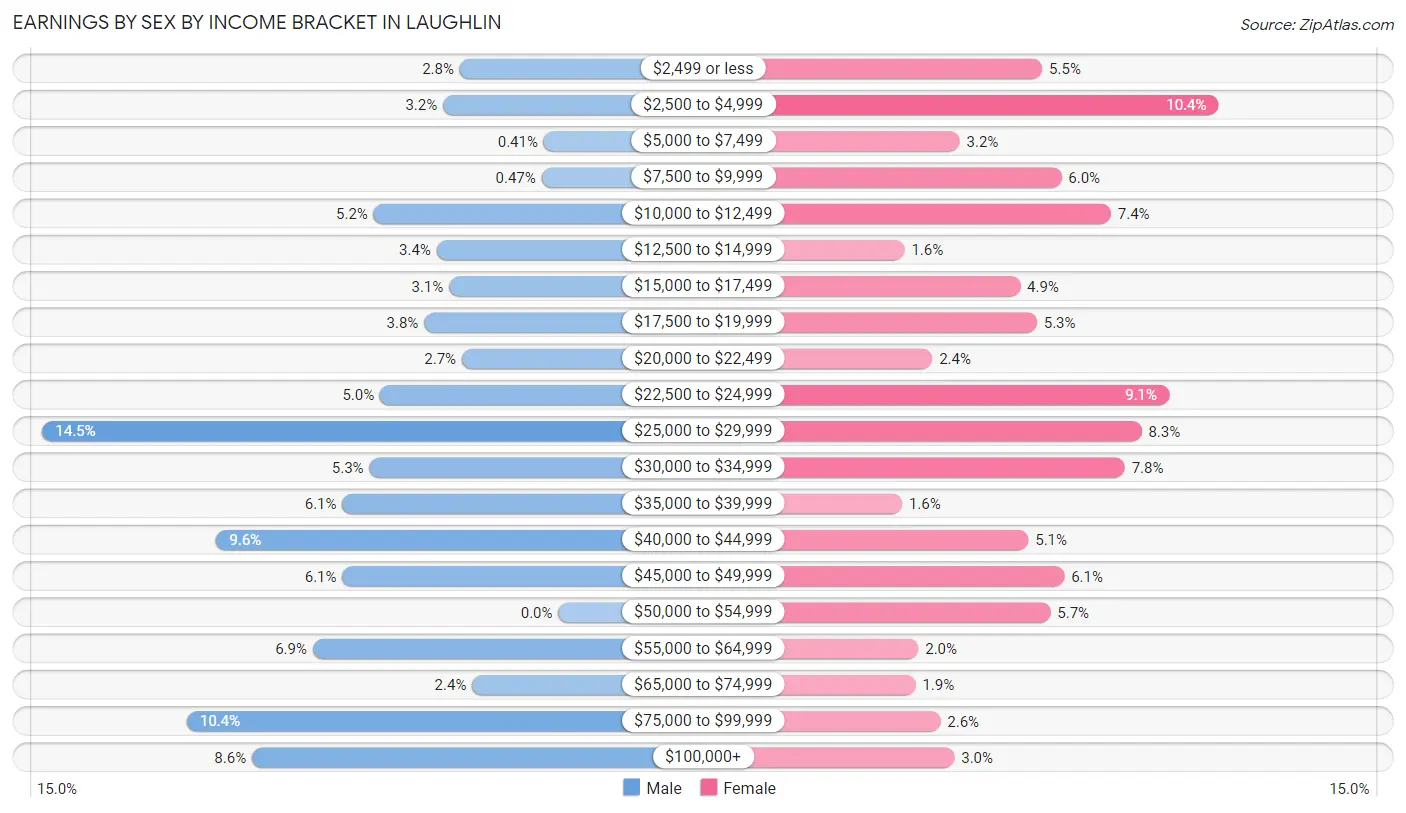
| Income | Male | Female |
| $2,499 or less | 47 (2.8%) | 71 (5.5%) |
| $2,500 to $4,999 | 55 (3.2%) | 135 (10.4%) |
| $5,000 to $7,499 | 7 (0.4%) | 41 (3.2%) |
| $7,500 to $9,999 | 8 (0.5%) | 78 (6.0%) |
| $10,000 to $12,499 | 88 (5.2%) | 96 (7.4%) |
| $12,500 to $14,999 | 58 (3.4%) | 21 (1.6%) |
| $15,000 to $17,499 | 52 (3.1%) | 63 (4.9%) |
| $17,500 to $19,999 | 64 (3.8%) | 69 (5.3%) |
| $20,000 to $22,499 | 46 (2.7%) | 31 (2.4%) |
| $22,500 to $24,999 | 85 (5.0%) | 117 (9.0%) |
| $25,000 to $29,999 | 246 (14.5%) | 107 (8.3%) |
| $30,000 to $34,999 | 90 (5.3%) | 101 (7.8%) |
| $35,000 to $39,999 | 103 (6.1%) | 20 (1.5%) |
| $40,000 to $44,999 | 163 (9.6%) | 66 (5.1%) |
| $45,000 to $49,999 | 103 (6.1%) | 79 (6.1%) |
| $50,000 to $54,999 | 0 (0.0%) | 74 (5.7%) |
| $55,000 to $64,999 | 117 (6.9%) | 26 (2.0%) |
| $65,000 to $74,999 | 41 (2.4%) | 25 (1.9%) |
| $75,000 to $99,999 | 177 (10.4%) | 34 (2.6%) |
| $100,000+ | 146 (8.6%) | 39 (3.0%) |
| Total | 1,696 (100.0%) | 1,293 (100.0%) |
Earnings by Sex by Educational Attainment in Laughlin
Average earnings in Laughlin are $36,760 for men and $25,393 for women, a difference of 30.9%. Men with an educational attainment of graduate degree enjoy the highest average annual earnings of $46,006, while those with college or associate's degree education earn the least with $35,714. Women with an educational attainment of college or associate's degree earn the most with the average annual earnings of $32,692, while those with bachelor's degree education have the smallest earnings of $24,070.
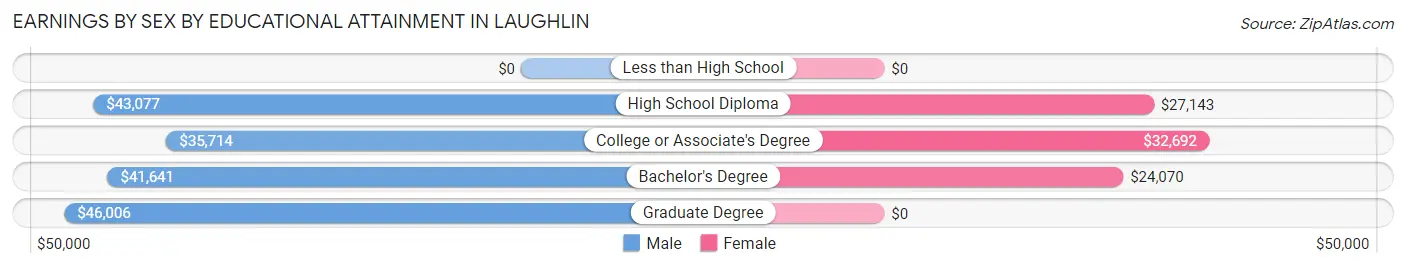
| Educational Attainment | Male Income | Female Income |
| Less than High School | - | - |
| High School Diploma | $43,077 | $27,143 |
| College or Associate's Degree | $35,714 | $32,692 |
| Bachelor's Degree | $41,641 | $24,070 |
| Graduate Degree | $46,006 | $0 |
| Total | $36,760 | $25,393 |
Family Income in Laughlin
Family Income Brackets in Laughlin
According to the Laughlin family income data, there are 435 families falling into the $50,000 to $74,999 income range, which is the most common income bracket and makes up 20.9% of all families. Conversely, the $10,000 to $14,999 income bracket is the least frequent group with only 19 families (0.9%) belonging to this category.
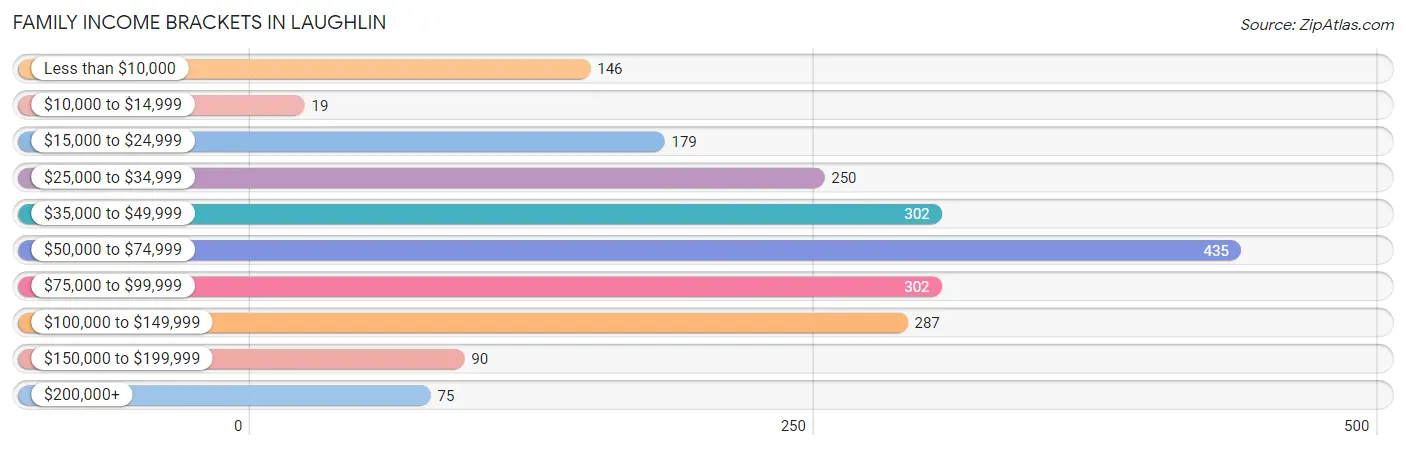
| Income Bracket | # Families | % Families |
| Less than $10,000 | 146 | 7.0% |
| $10,000 to $14,999 | 19 | 0.9% |
| $15,000 to $24,999 | 179 | 8.6% |
| $25,000 to $34,999 | 250 | 12.0% |
| $35,000 to $49,999 | 302 | 14.5% |
| $50,000 to $74,999 | 435 | 20.9% |
| $75,000 to $99,999 | 302 | 14.5% |
| $100,000 to $149,999 | 287 | 13.8% |
| $150,000 to $199,999 | 90 | 4.3% |
| $200,000+ | 75 | 3.6% |
Family Income by Famaliy Size in Laughlin
5-person families (27 | 1.3%) account for the highest median family income in Laughlin with $72,411 per family, while 2-person families (1,635 | 78.5%) have the highest median income of $31,388 per family member.
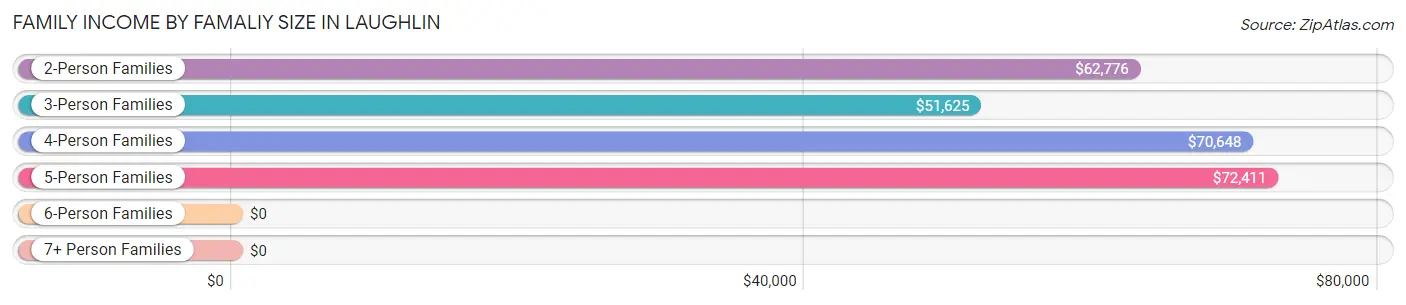
| Income Bracket | # Families | Median Income |
| 2-Person Families | 1,635 (78.5%) | $62,776 |
| 3-Person Families | 187 (9.0%) | $51,625 |
| 4-Person Families | 210 (10.1%) | $70,648 |
| 5-Person Families | 27 (1.3%) | $72,411 |
| 6-Person Families | 0 (0.0%) | $0 |
| 7+ Person Families | 24 (1.1%) | $0 |
| Total | 2,083 (100.0%) | $63,064 |
Family Income by Number of Earners in Laughlin
The median family income in Laughlin is $63,064, with families comprising 3+ earners (47) having the highest median family income of $175,664, while families with no earners (886) have the lowest median family income of $51,429, accounting for 2.3% and 42.5% of families, respectively.
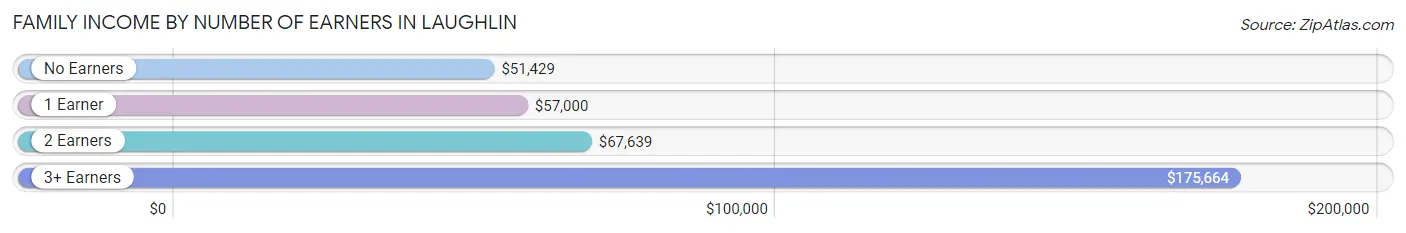
| Number of Earners | # Families | Median Income |
| No Earners | 886 (42.5%) | $51,429 |
| 1 Earner | 640 (30.7%) | $57,000 |
| 2 Earners | 510 (24.5%) | $67,639 |
| 3+ Earners | 47 (2.3%) | $175,664 |
| Total | 2,083 (100.0%) | $63,064 |
Household Income in Laughlin
Household Income Brackets in Laughlin
With 811 households falling in the category, the $35,000 to $49,999 income range is the most frequent in Laughlin, accounting for 19.1% of all households. In contrast, only 115 households (2.7%) fall into the $150,000 to $199,999 income bracket, making it the least populous group.
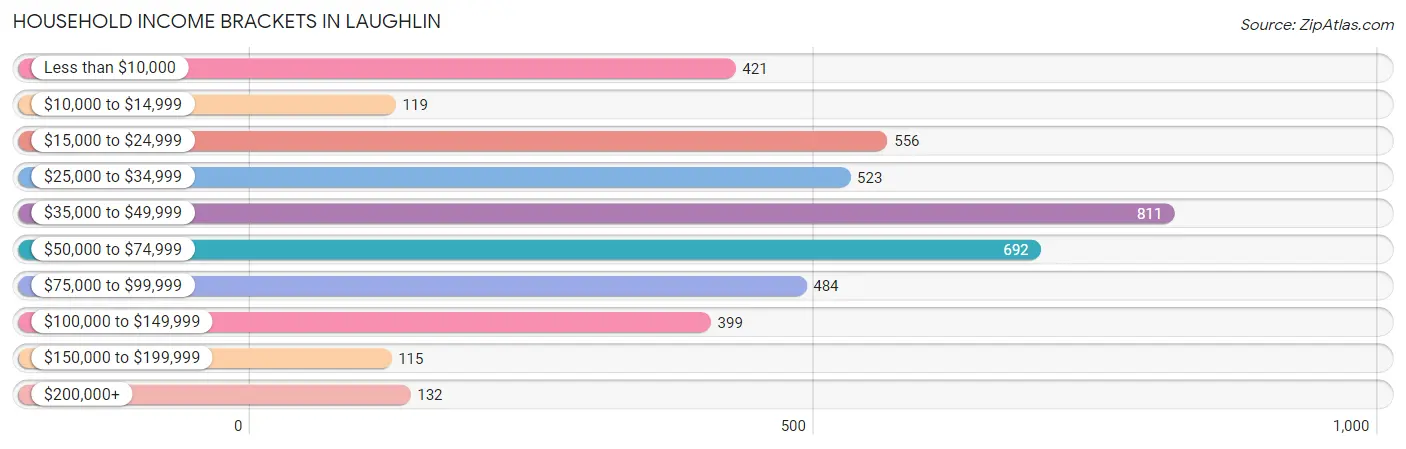
| Income Bracket | # Households | % Households |
| Less than $10,000 | 421 | 9.9% |
| $10,000 to $14,999 | 119 | 2.8% |
| $15,000 to $24,999 | 556 | 13.1% |
| $25,000 to $34,999 | 523 | 12.3% |
| $35,000 to $49,999 | 811 | 19.1% |
| $50,000 to $74,999 | 692 | 16.3% |
| $75,000 to $99,999 | 484 | 11.4% |
| $100,000 to $149,999 | 399 | 9.4% |
| $150,000 to $199,999 | 115 | 2.7% |
| $200,000+ | 132 | 3.1% |
Household Income by Householder Age in Laughlin
The median household income in Laughlin is $44,359, with the highest median household income of $48,674 found in the 45 to 64 years age bracket for the primary householder. A total of 1,113 households (26.2%) fall into this category. Meanwhile, the 15 to 24 years age bracket for the primary householder has the lowest median household income of $28,371, with 199 households (4.7%) in this group.
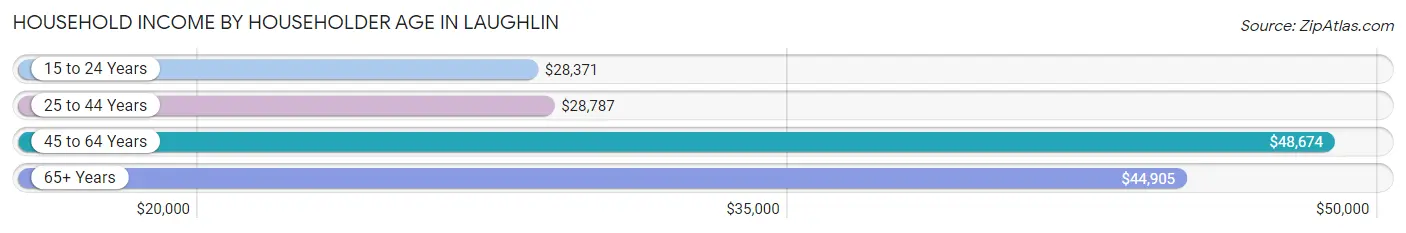
| Income Bracket | # Households | Median Income |
| 15 to 24 Years | 199 (4.7%) | $28,371 |
| 25 to 44 Years | 595 (14.0%) | $28,787 |
| 45 to 64 Years | 1,113 (26.2%) | $48,674 |
| 65+ Years | 2,341 (55.1%) | $44,905 |
| Total | 4,248 (100.0%) | $44,359 |
Poverty in Laughlin
Income Below Poverty by Sex and Age in Laughlin
With 16.6% poverty level for males and 23.2% for females among the residents of Laughlin, 15 year old males and 5 year old females are the most vulnerable to poverty, with 17 males (100.0%) and 12 females (100.0%) in their respective age groups living below the poverty level.
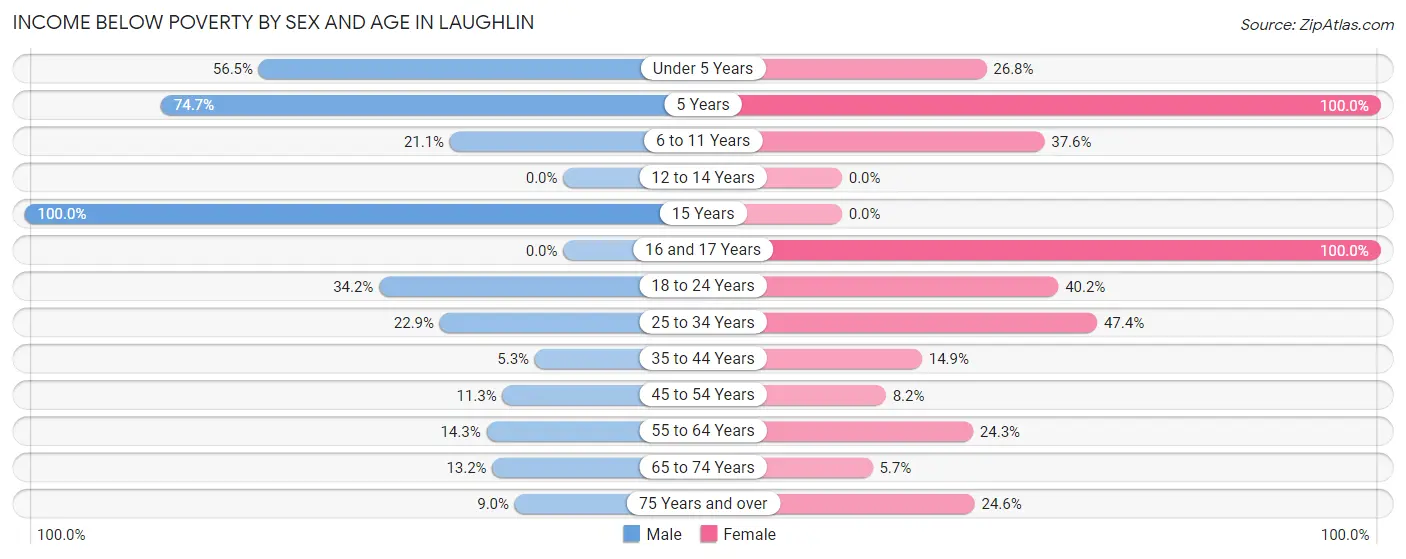
| Age Bracket | Male | Female |
| Under 5 Years | 65 (56.5%) | 33 (26.8%) |
| 5 Years | 62 (74.7%) | 12 (100.0%) |
| 6 to 11 Years | 16 (21.0%) | 59 (37.6%) |
| 12 to 14 Years | 0 (0.0%) | 0 (0.0%) |
| 15 Years | 17 (100.0%) | 0 (0.0%) |
| 16 and 17 Years | 0 (0.0%) | 49 (100.0%) |
| 18 to 24 Years | 81 (34.2%) | 92 (40.2%) |
| 25 to 34 Years | 102 (22.9%) | 207 (47.4%) |
| 35 to 44 Years | 18 (5.3%) | 30 (14.8%) |
| 45 to 54 Years | 48 (11.3%) | 20 (8.2%) |
| 55 to 64 Years | 102 (14.3%) | 184 (24.3%) |
| 65 to 74 Years | 134 (13.2%) | 59 (5.7%) |
| 75 Years and over | 66 (9.0%) | 154 (24.6%) |
| Total | 711 (16.6%) | 899 (23.2%) |
Income Above Poverty by Sex and Age in Laughlin
According to the poverty statistics in Laughlin, males aged 12 to 14 years and females aged 12 to 14 years are the age groups that are most secure financially, with 100.0% of males and 100.0% of females in these age groups living above the poverty line.
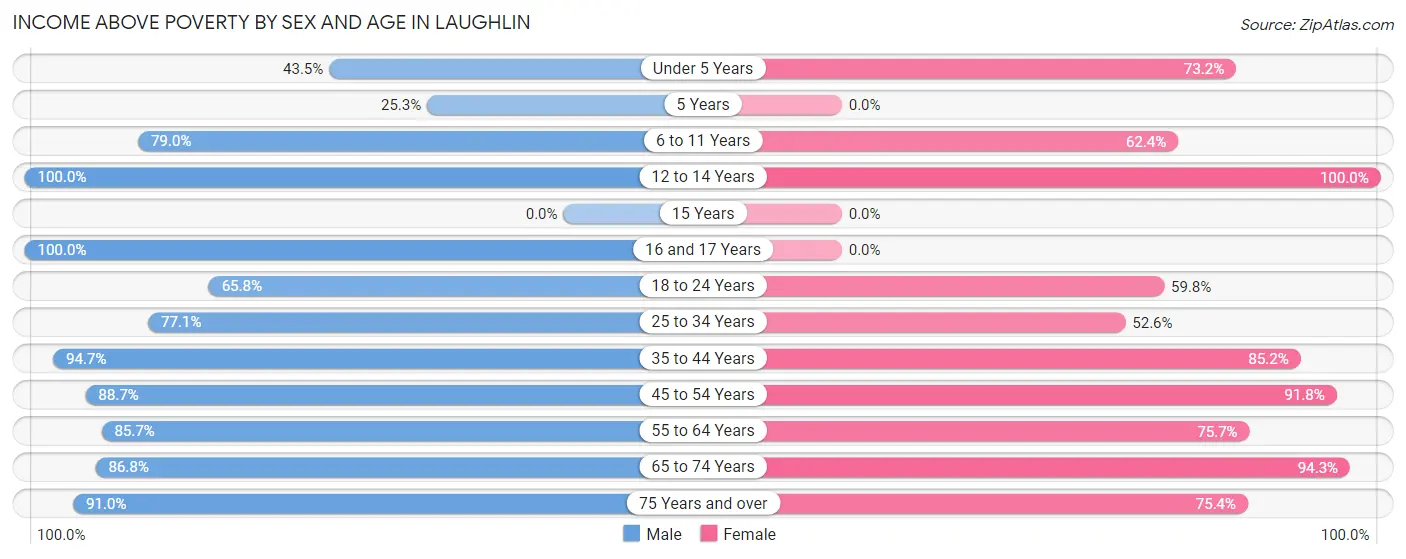
| Age Bracket | Male | Female |
| Under 5 Years | 50 (43.5%) | 90 (73.2%) |
| 5 Years | 21 (25.3%) | 0 (0.0%) |
| 6 to 11 Years | 60 (78.9%) | 98 (62.4%) |
| 12 to 14 Years | 58 (100.0%) | 10 (100.0%) |
| 15 Years | 0 (0.0%) | 0 (0.0%) |
| 16 and 17 Years | 19 (100.0%) | 0 (0.0%) |
| 18 to 24 Years | 156 (65.8%) | 137 (59.8%) |
| 25 to 34 Years | 343 (77.1%) | 230 (52.6%) |
| 35 to 44 Years | 323 (94.7%) | 172 (85.2%) |
| 45 to 54 Years | 377 (88.7%) | 225 (91.8%) |
| 55 to 64 Years | 613 (85.7%) | 572 (75.7%) |
| 65 to 74 Years | 884 (86.8%) | 978 (94.3%) |
| 75 Years and over | 667 (91.0%) | 471 (75.4%) |
| Total | 3,571 (83.4%) | 2,983 (76.8%) |
Income Below Poverty Among Married-Couple Families in Laughlin
The poverty statistics for married-couple families in Laughlin show that 14.4% or 209 of the total 1,450 families live below the poverty line. Families with 1 or 2 children have the highest poverty rate of 63.0%, comprising of 97 families. On the other hand, families with 3 or 4 children have the lowest poverty rate of 0.0%, which includes 0 families.
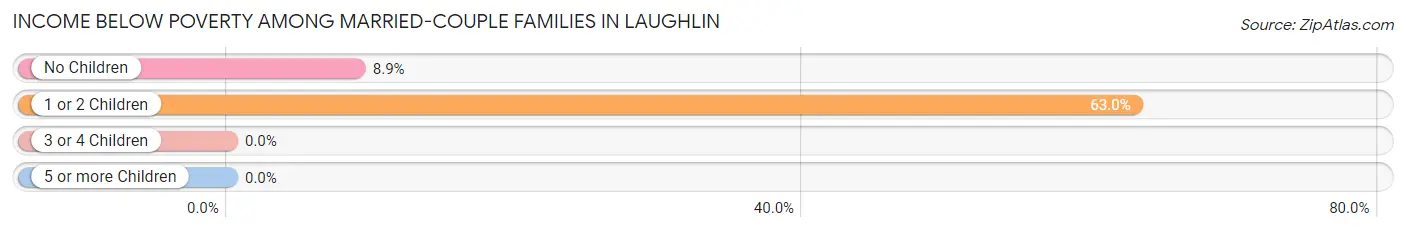
| Children | Above Poverty | Below Poverty |
| No Children | 1,146 (91.1%) | 112 (8.9%) |
| 1 or 2 Children | 57 (37.0%) | 97 (63.0%) |
| 3 or 4 Children | 38 (100.0%) | 0 (0.0%) |
| 5 or more Children | 0 (0.0%) | 0 (0.0%) |
| Total | 1,241 (85.6%) | 209 (14.4%) |
Income Below Poverty Among Single-Parent Households in Laughlin
According to the poverty data in Laughlin, 2.2% or 5 single-father households and 24.9% or 102 single-mother households are living below the poverty line. Among single-father households, those with no children have the highest poverty rate, with 5 households (3.1%) experiencing poverty. Likewise, among single-mother households, those with 3 or 4 children have the highest poverty rate, with 6 households (100.0%) falling below the poverty line.
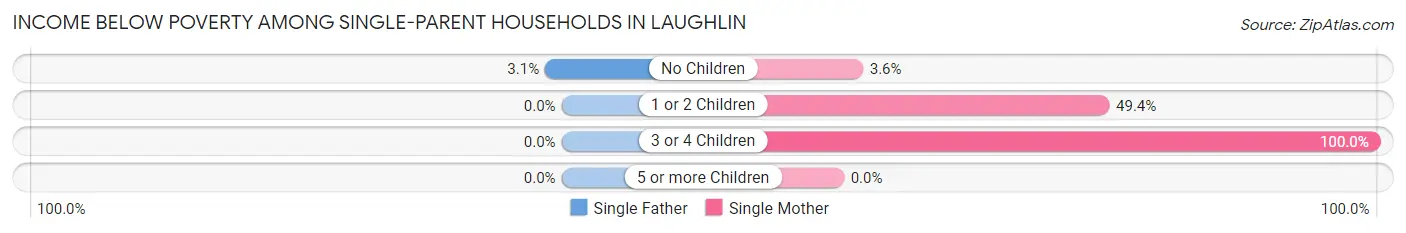
| Children | Single Father | Single Mother |
| No Children | 5 (3.1%) | 8 (3.6%) |
| 1 or 2 Children | 0 (0.0%) | 88 (49.4%) |
| 3 or 4 Children | 0 (0.0%) | 6 (100.0%) |
| 5 or more Children | 0 (0.0%) | 0 (0.0%) |
| Total | 5 (2.2%) | 102 (24.9%) |
Income Below Poverty Among Married-Couple vs Single-Parent Households in Laughlin
The poverty data for Laughlin shows that 209 of the married-couple family households (14.4%) and 107 of the single-parent households (16.9%) are living below the poverty level. Within the married-couple family households, those with 1 or 2 children have the highest poverty rate, with 97 households (63.0%) falling below the poverty line. Among the single-parent households, those with 1 or 2 children have the highest poverty rate, with 88 household (41.1%) living below poverty.
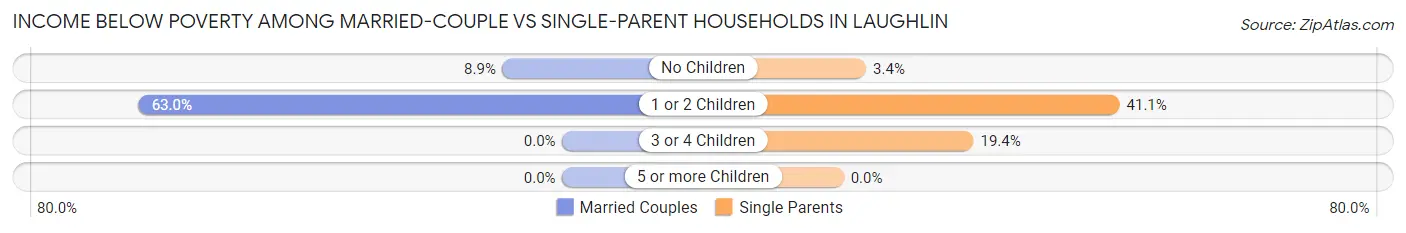
| Children | Married-Couple Families | Single-Parent Households |
| No Children | 112 (8.9%) | 13 (3.4%) |
| 1 or 2 Children | 97 (63.0%) | 88 (41.1%) |
| 3 or 4 Children | 0 (0.0%) | 6 (19.4%) |
| 5 or more Children | 0 (0.0%) | 0 (0.0%) |
| Total | 209 (14.4%) | 107 (16.9%) |
Employment Characteristics in Laughlin
Employment by Class of Employer in Laughlin
Among the 2,568 employed individuals in Laughlin, private company employees (1,932 | 75.2%), local government employees (183 | 7.1%), and not-for-profit organizations (164 | 6.4%) make up the most common classes of employment.
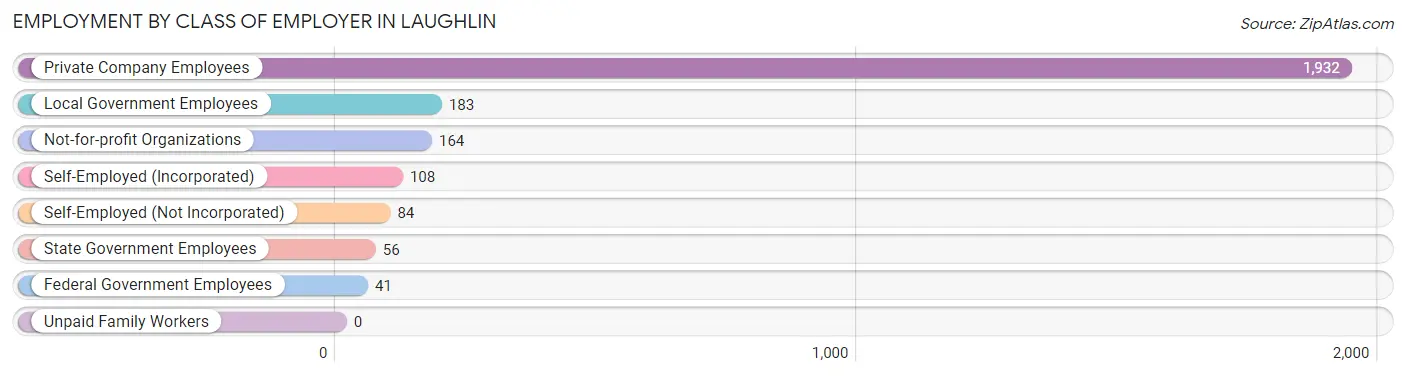
| Employer Class | # Employees | % Employees |
| Private Company Employees | 1,932 | 75.2% |
| Self-Employed (Incorporated) | 108 | 4.2% |
| Self-Employed (Not Incorporated) | 84 | 3.3% |
| Not-for-profit Organizations | 164 | 6.4% |
| Local Government Employees | 183 | 7.1% |
| State Government Employees | 56 | 2.2% |
| Federal Government Employees | 41 | 1.6% |
| Unpaid Family Workers | 0 | 0.0% |
| Total | 2,568 | 100.0% |
Employment Status by Age in Laughlin
According to the labor force statistics for Laughlin, out of the total population over 16 years of age (7,513), 39.8% or 2,990 individuals are in the labor force, with 11.7% or 350 of them unemployed. The age group with the highest labor force participation rate is 20 to 24 years, with 87.2% or 319 individuals in the labor force. Within the labor force, the 30 to 34 years age range has the highest percentage of unemployed individuals, with 25.9% or 57 of them being unemployed.
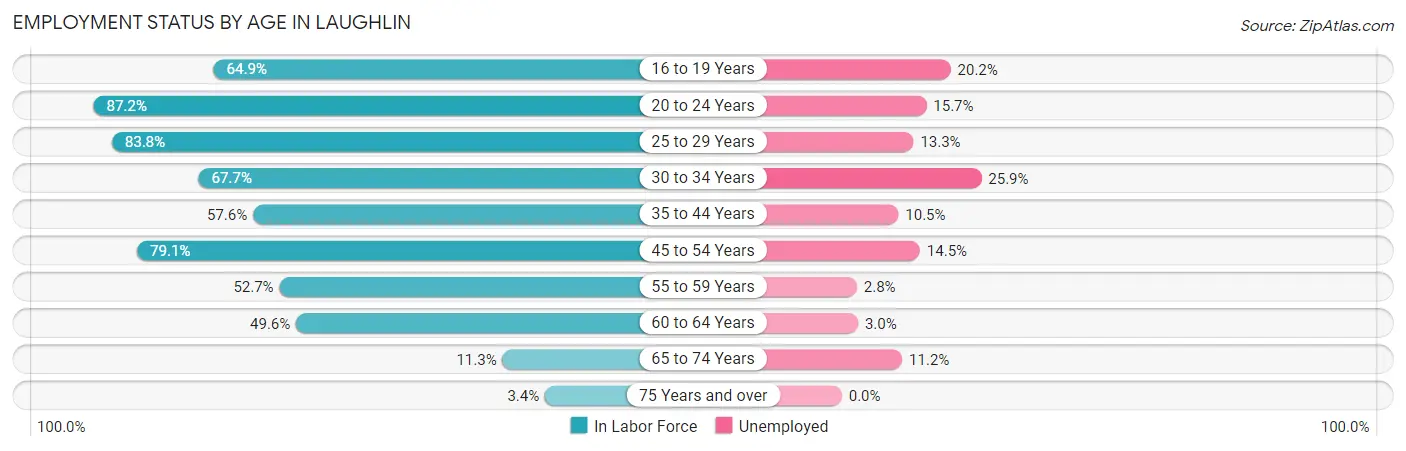
| Age Bracket | In Labor Force | Unemployed |
| 16 to 19 Years | 109 (64.9%) | 22 (20.2%) |
| 20 to 24 Years | 319 (87.2%) | 50 (15.7%) |
| 25 to 29 Years | 467 (83.8%) | 62 (13.3%) |
| 30 to 34 Years | 220 (67.7%) | 57 (25.9%) |
| 35 to 44 Years | 313 (57.6%) | 33 (10.5%) |
| 45 to 54 Years | 530 (79.1%) | 77 (14.5%) |
| 55 to 59 Years | 425 (52.7%) | 12 (2.8%) |
| 60 to 64 Years | 330 (49.6%) | 10 (3.0%) |
| 65 to 74 Years | 232 (11.3%) | 26 (11.2%) |
| 75 Years and over | 46 (3.4%) | 0 (0.0%) |
| Total | 2,990 (39.8%) | 350 (11.7%) |
Employment Status by Educational Attainment in Laughlin
According to labor force statistics for Laughlin, 64.1% of individuals (2,286) out of the total population between 25 and 64 years of age (3,566) are in the labor force, with 11.0% or 251 of them being unemployed. The group with the highest labor force participation rate are those with the educational attainment of bachelor's degree or higher, with 79.6% or 340 individuals in the labor force. Within the labor force, individuals with bachelor's degree or higher education have the highest percentage of unemployment, with 14.4% or 49 of them being unemployed.
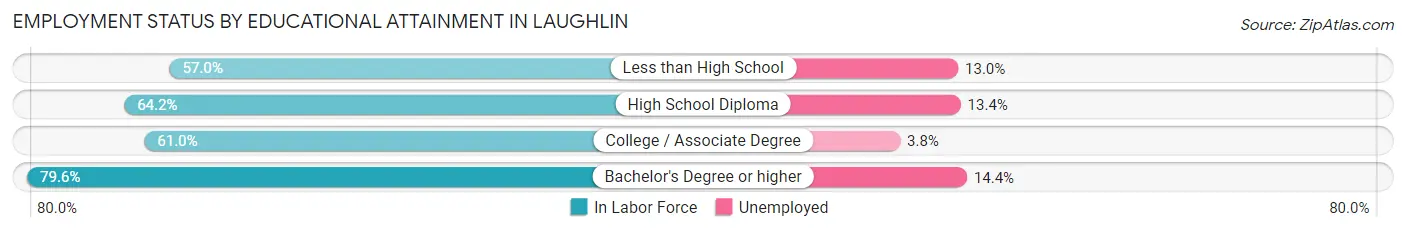
| Educational Attainment | In Labor Force | Unemployed |
| Less than High School | 300 (57.0%) | 68 (13.0%) |
| High School Diploma | 1,048 (64.2%) | 219 (13.4%) |
| College / Associate Degree | 598 (61.0%) | 37 (3.8%) |
| Bachelor's Degree or higher | 340 (79.6%) | 61 (14.4%) |
| Total | 2,286 (64.1%) | 392 (11.0%) |
Employment Occupations by Sex in Laughlin
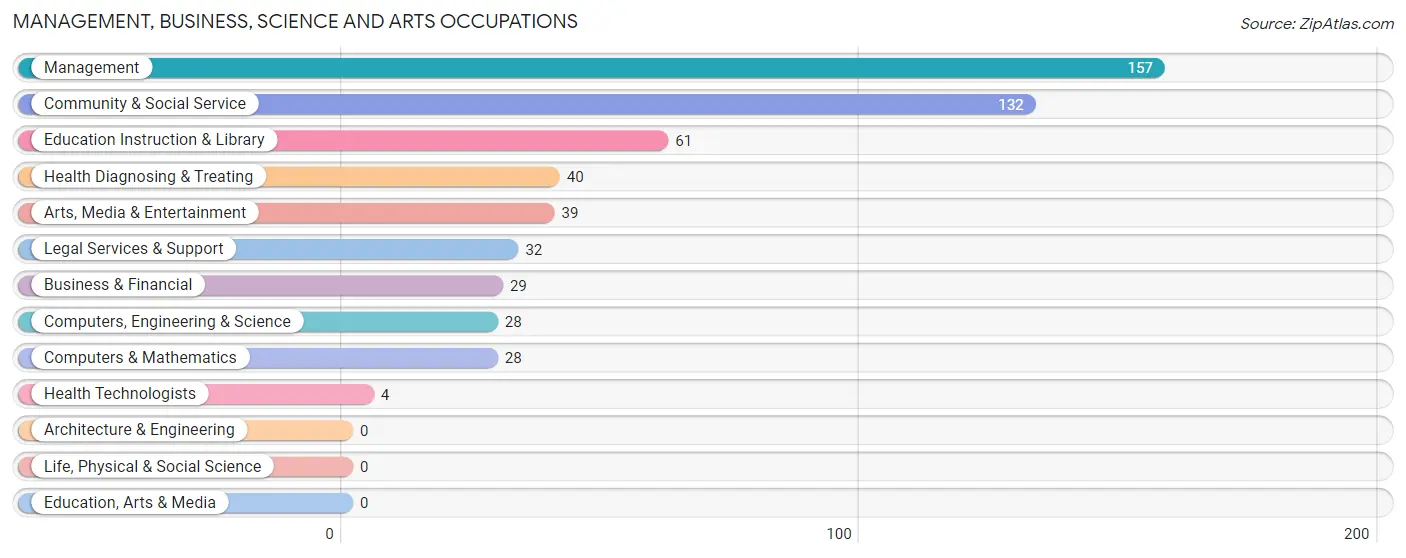
Management, Business, Science and Arts Occupations
The most common Management, Business, Science and Arts occupations in Laughlin are Management (157 | 5.9%), Community & Social Service (132 | 5.0%), Education Instruction & Library (61 | 2.3%), Health Diagnosing & Treating (40 | 1.5%), and Arts, Media & Entertainment (39 | 1.5%).
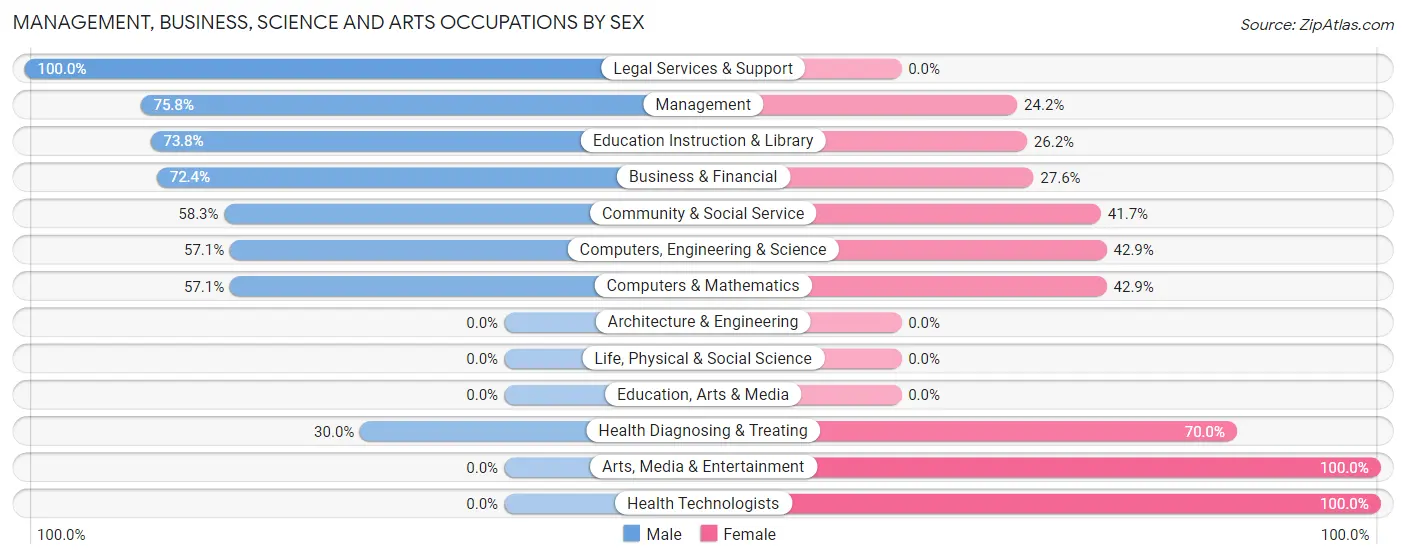
Management, Business, Science and Arts Occupations by Sex
Within the Management, Business, Science and Arts occupations in Laughlin, the most male-oriented occupations are Legal Services & Support (100.0%), Management (75.8%), and Education Instruction & Library (73.8%), while the most female-oriented occupations are Arts, Media & Entertainment (100.0%), Health Technologists (100.0%), and Health Diagnosing & Treating (70.0%).
| Occupation | Male | Female |
| Management | 119 (75.8%) | 38 (24.2%) |
| Business & Financial | 21 (72.4%) | 8 (27.6%) |
| Computers, Engineering & Science | 16 (57.1%) | 12 (42.9%) |
| Computers & Mathematics | 16 (57.1%) | 12 (42.9%) |
| Architecture & Engineering | 0 (0.0%) | 0 (0.0%) |
| Life, Physical & Social Science | 0 (0.0%) | 0 (0.0%) |
| Community & Social Service | 77 (58.3%) | 55 (41.7%) |
| Education, Arts & Media | 0 (0.0%) | 0 (0.0%) |
| Legal Services & Support | 32 (100.0%) | 0 (0.0%) |
| Education Instruction & Library | 45 (73.8%) | 16 (26.2%) |
| Arts, Media & Entertainment | 0 (0.0%) | 39 (100.0%) |
| Health Diagnosing & Treating | 12 (30.0%) | 28 (70.0%) |
| Health Technologists | 0 (0.0%) | 4 (100.0%) |
| Total (Category) | 245 (63.5%) | 141 (36.5%) |
| Total (Overall) | 1,564 (59.2%) | 1,079 (40.8%) |
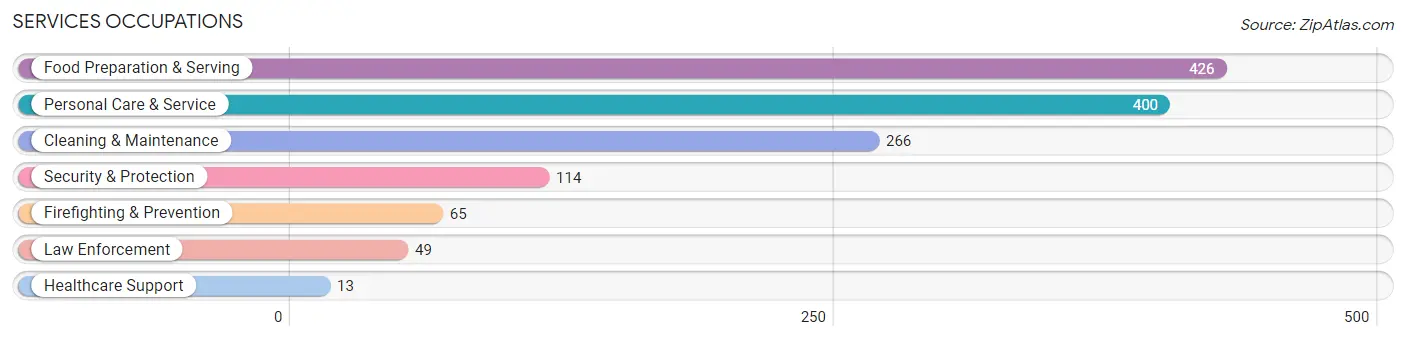
Services Occupations
The most common Services occupations in Laughlin are Food Preparation & Serving (426 | 16.1%), Personal Care & Service (400 | 15.1%), Cleaning & Maintenance (266 | 10.1%), Security & Protection (114 | 4.3%), and Firefighting & Prevention (65 | 2.5%).
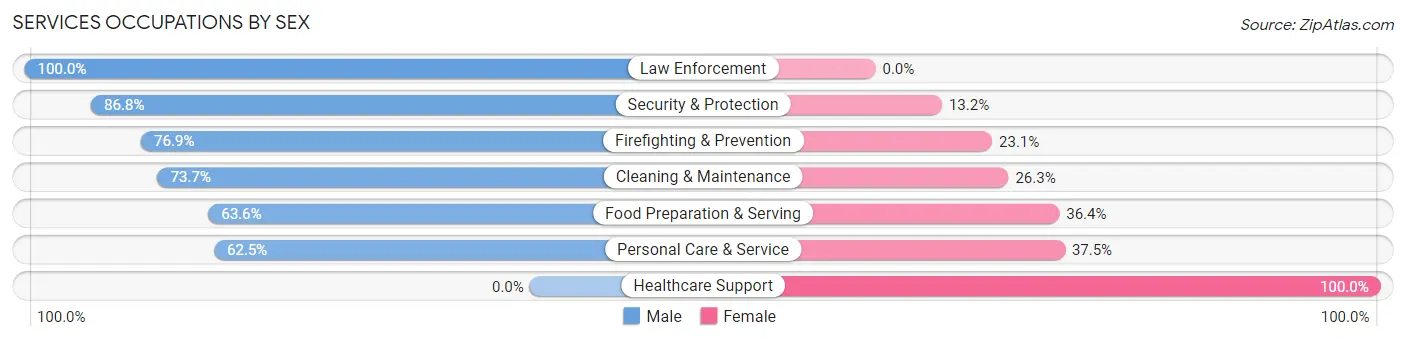
Services Occupations by Sex
Within the Services occupations in Laughlin, the most male-oriented occupations are Law Enforcement (100.0%), Security & Protection (86.8%), and Firefighting & Prevention (76.9%), while the most female-oriented occupations are Healthcare Support (100.0%), Personal Care & Service (37.5%), and Food Preparation & Serving (36.4%).
| Occupation | Male | Female |
| Healthcare Support | 0 (0.0%) | 13 (100.0%) |
| Security & Protection | 99 (86.8%) | 15 (13.2%) |
| Firefighting & Prevention | 50 (76.9%) | 15 (23.1%) |
| Law Enforcement | 49 (100.0%) | 0 (0.0%) |
| Food Preparation & Serving | 271 (63.6%) | 155 (36.4%) |
| Cleaning & Maintenance | 196 (73.7%) | 70 (26.3%) |
| Personal Care & Service | 250 (62.5%) | 150 (37.5%) |
| Total (Category) | 816 (66.9%) | 403 (33.1%) |
| Total (Overall) | 1,564 (59.2%) | 1,079 (40.8%) |
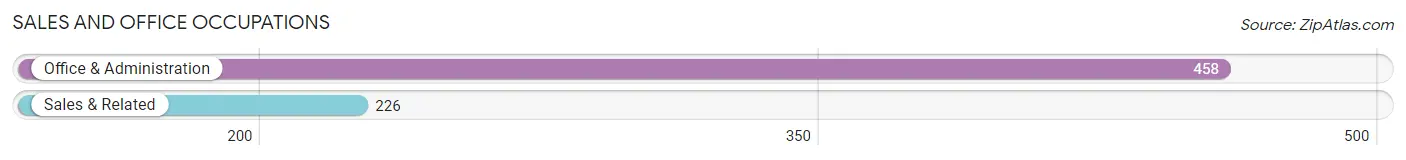
Sales and Office Occupations
The most common Sales and Office occupations in Laughlin are Office & Administration (458 | 17.3%), and Sales & Related (226 | 8.6%).
Sales and Office Occupations by Sex
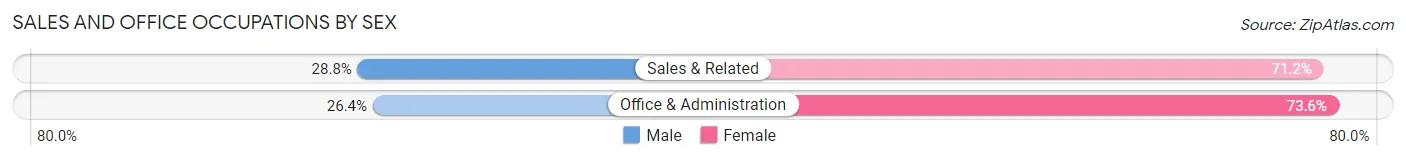
| Occupation | Male | Female |
| Sales & Related | 65 (28.8%) | 161 (71.2%) |
| Office & Administration | 121 (26.4%) | 337 (73.6%) |
| Total (Category) | 186 (27.2%) | 498 (72.8%) |
| Total (Overall) | 1,564 (59.2%) | 1,079 (40.8%) |
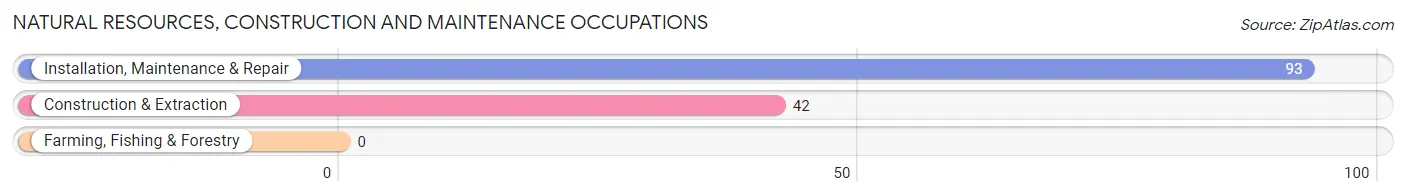
Natural Resources, Construction and Maintenance Occupations
The most common Natural Resources, Construction and Maintenance occupations in Laughlin are Installation, Maintenance & Repair (93 | 3.5%), and Construction & Extraction (42 | 1.6%).
Natural Resources, Construction and Maintenance Occupations by Sex
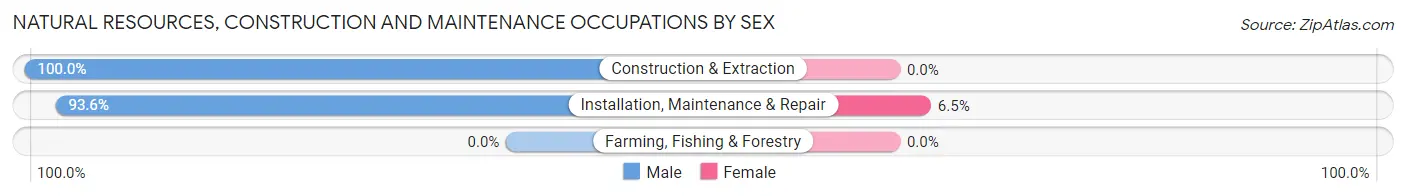
| Occupation | Male | Female |
| Farming, Fishing & Forestry | 0 (0.0%) | 0 (0.0%) |
| Construction & Extraction | 42 (100.0%) | 0 (0.0%) |
| Installation, Maintenance & Repair | 87 (93.5%) | 6 (6.5%) |
| Total (Category) | 129 (95.6%) | 6 (4.4%) |
| Total (Overall) | 1,564 (59.2%) | 1,079 (40.8%) |
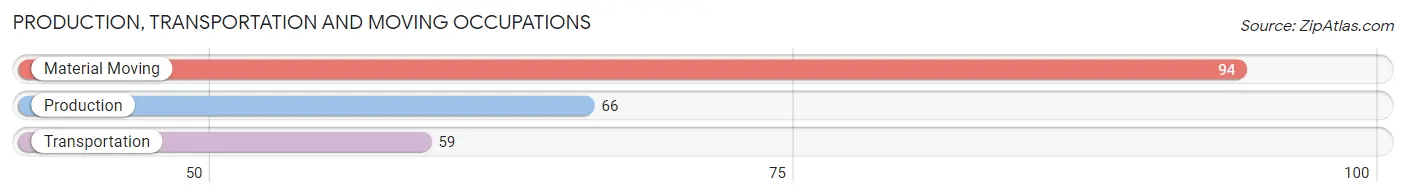
Production, Transportation and Moving Occupations
The most common Production, Transportation and Moving occupations in Laughlin are Material Moving (94 | 3.6%), Production (66 | 2.5%), and Transportation (59 | 2.2%).
Production, Transportation and Moving Occupations by Sex
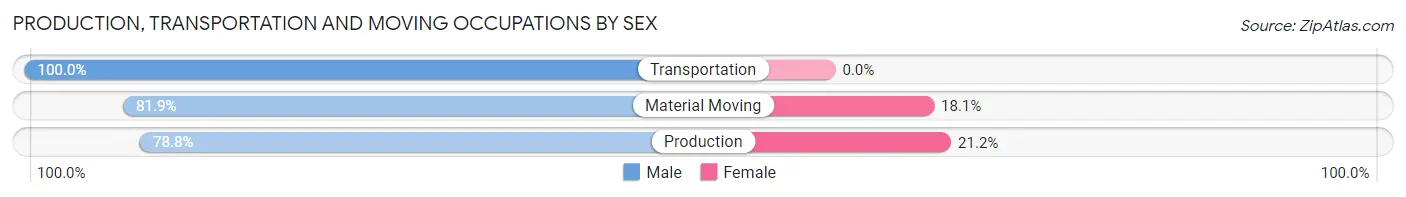
| Occupation | Male | Female |
| Production | 52 (78.8%) | 14 (21.2%) |
| Transportation | 59 (100.0%) | 0 (0.0%) |
| Material Moving | 77 (81.9%) | 17 (18.1%) |
| Total (Category) | 188 (85.8%) | 31 (14.2%) |
| Total (Overall) | 1,564 (59.2%) | 1,079 (40.8%) |
Employment Industries by Sex in Laughlin
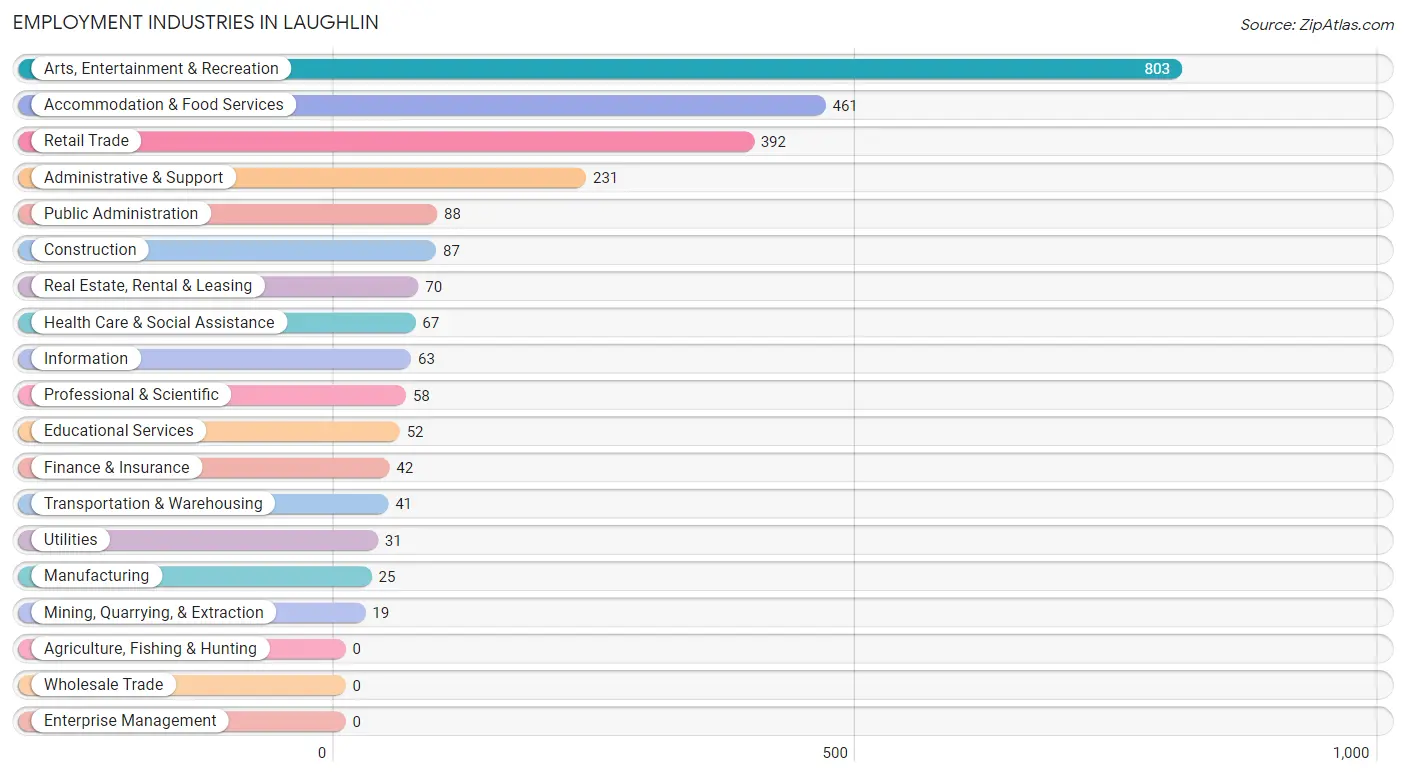
Employment Industries in Laughlin
The major employment industries in Laughlin include Arts, Entertainment & Recreation (803 | 30.4%), Accommodation & Food Services (461 | 17.4%), Retail Trade (392 | 14.8%), Administrative & Support (231 | 8.7%), and Public Administration (88 | 3.3%).
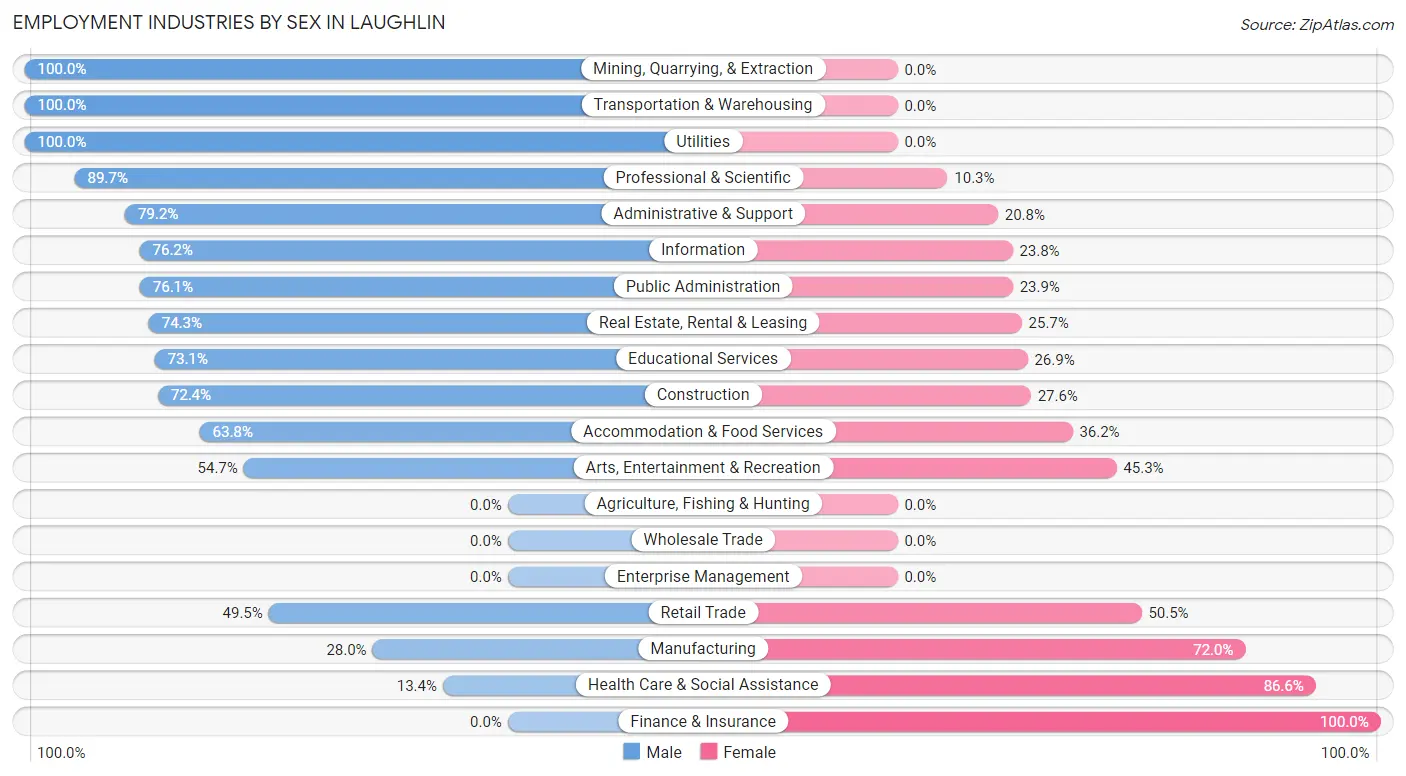
Employment Industries by Sex in Laughlin
The Laughlin industries that see more men than women are Mining, Quarrying, & Extraction (100.0%), Transportation & Warehousing (100.0%), and Utilities (100.0%), whereas the industries that tend to have a higher number of women are Finance & Insurance (100.0%), Health Care & Social Assistance (86.6%), and Manufacturing (72.0%).
| Industry | Male | Female |
| Agriculture, Fishing & Hunting | 0 (0.0%) | 0 (0.0%) |
| Mining, Quarrying, & Extraction | 19 (100.0%) | 0 (0.0%) |
| Construction | 63 (72.4%) | 24 (27.6%) |
| Manufacturing | 7 (28.0%) | 18 (72.0%) |
| Wholesale Trade | 0 (0.0%) | 0 (0.0%) |
| Retail Trade | 194 (49.5%) | 198 (50.5%) |
| Transportation & Warehousing | 41 (100.0%) | 0 (0.0%) |
| Utilities | 31 (100.0%) | 0 (0.0%) |
| Information | 48 (76.2%) | 15 (23.8%) |
| Finance & Insurance | 0 (0.0%) | 42 (100.0%) |
| Real Estate, Rental & Leasing | 52 (74.3%) | 18 (25.7%) |
| Professional & Scientific | 52 (89.7%) | 6 (10.3%) |
| Enterprise Management | 0 (0.0%) | 0 (0.0%) |
| Administrative & Support | 183 (79.2%) | 48 (20.8%) |
| Educational Services | 38 (73.1%) | 14 (26.9%) |
| Health Care & Social Assistance | 9 (13.4%) | 58 (86.6%) |
| Arts, Entertainment & Recreation | 439 (54.7%) | 364 (45.3%) |
| Accommodation & Food Services | 294 (63.8%) | 167 (36.2%) |
| Public Administration | 67 (76.1%) | 21 (23.9%) |
| Total | 1,564 (59.2%) | 1,079 (40.8%) |
Education in Laughlin
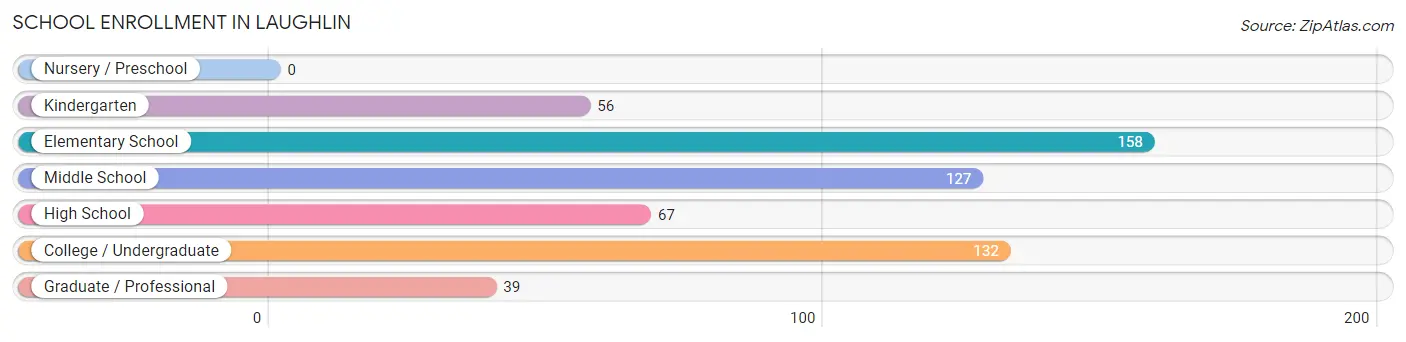
School Enrollment in Laughlin
The most common levels of schooling among the 579 students in Laughlin are elementary school (158 | 27.3%), college / undergraduate (132 | 22.8%), and middle school (127 | 21.9%).
| School Level | # Students | % Students |
| Nursery / Preschool | 0 | 0.0% |
| Kindergarten | 56 | 9.7% |
| Elementary School | 158 | 27.3% |
| Middle School | 127 | 21.9% |
| High School | 67 | 11.6% |
| College / Undergraduate | 132 | 22.8% |
| Graduate / Professional | 39 | 6.7% |
| Total | 579 | 100.0% |
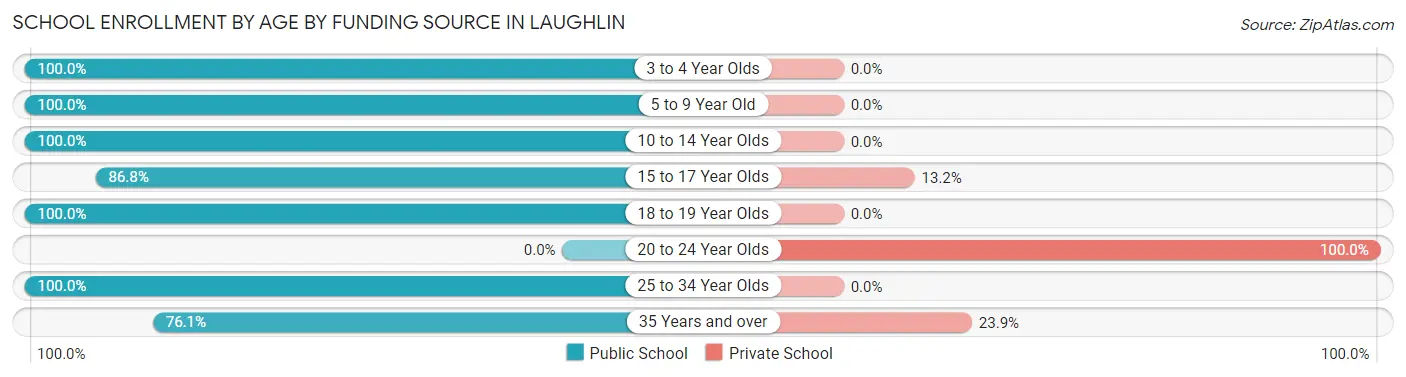
School Enrollment by Age by Funding Source in Laughlin
Out of a total of 579 students who are enrolled in schools in Laughlin, 56 (9.7%) attend a private institution, while the remaining 523 (90.3%) are enrolled in public schools. The age group of 20 to 24 year olds has the highest likelihood of being enrolled in private schools, with 22 (100.0% in the age bracket) enrolled. Conversely, the age group of 3 to 4 year olds has the lowest likelihood of being enrolled in a private school, with 23 (100.0% in the age bracket) attending a public institution.
| Age Bracket | Public School | Private School |
| 3 to 4 Year Olds | 23 (100.0%) | 0 (0.0%) |
| 5 to 9 Year Old | 165 (100.0%) | 0 (0.0%) |
| 10 to 14 Year Olds | 158 (100.0%) | 0 (0.0%) |
| 15 to 17 Year Olds | 46 (86.8%) | 7 (13.2%) |
| 18 to 19 Year Olds | 15 (100.0%) | 0 (0.0%) |
| 20 to 24 Year Olds | 0 (0.0%) | 22 (100.0%) |
| 25 to 34 Year Olds | 30 (100.0%) | 0 (0.0%) |
| 35 Years and over | 86 (76.1%) | 27 (23.9%) |
| Total | 523 (90.3%) | 56 (9.7%) |
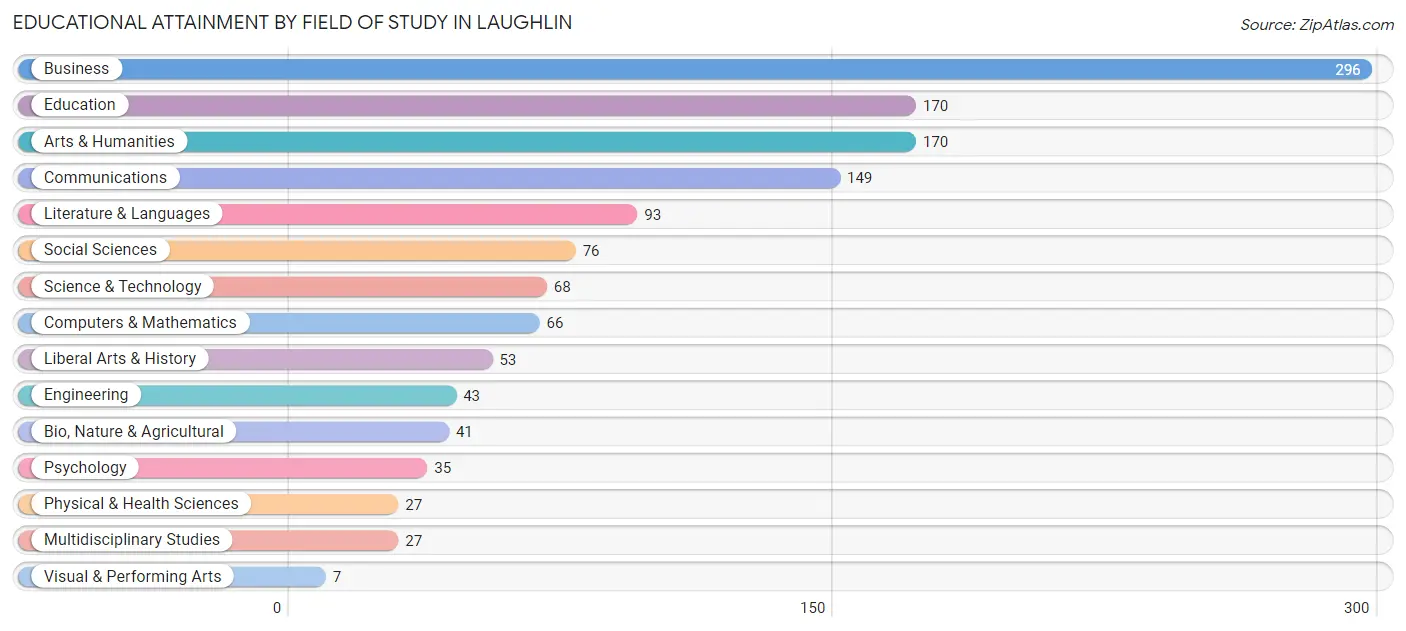
Educational Attainment by Field of Study in Laughlin
Business (296 | 22.4%), education (170 | 12.9%), arts & humanities (170 | 12.9%), communications (149 | 11.3%), and literature & languages (93 | 7.0%) are the most common fields of study among 1,321 individuals in Laughlin who have obtained a bachelor's degree or higher.
| Field of Study | # Graduates | % Graduates |
| Computers & Mathematics | 66 | 5.0% |
| Bio, Nature & Agricultural | 41 | 3.1% |
| Physical & Health Sciences | 27 | 2.0% |
| Psychology | 35 | 2.6% |
| Social Sciences | 76 | 5.8% |
| Engineering | 43 | 3.3% |
| Multidisciplinary Studies | 27 | 2.0% |
| Science & Technology | 68 | 5.1% |
| Business | 296 | 22.4% |
| Education | 170 | 12.9% |
| Literature & Languages | 93 | 7.0% |
| Liberal Arts & History | 53 | 4.0% |
| Visual & Performing Arts | 7 | 0.5% |
| Communications | 149 | 11.3% |
| Arts & Humanities | 170 | 12.9% |
| Total | 1,321 | 100.0% |
Transportation & Commute in Laughlin
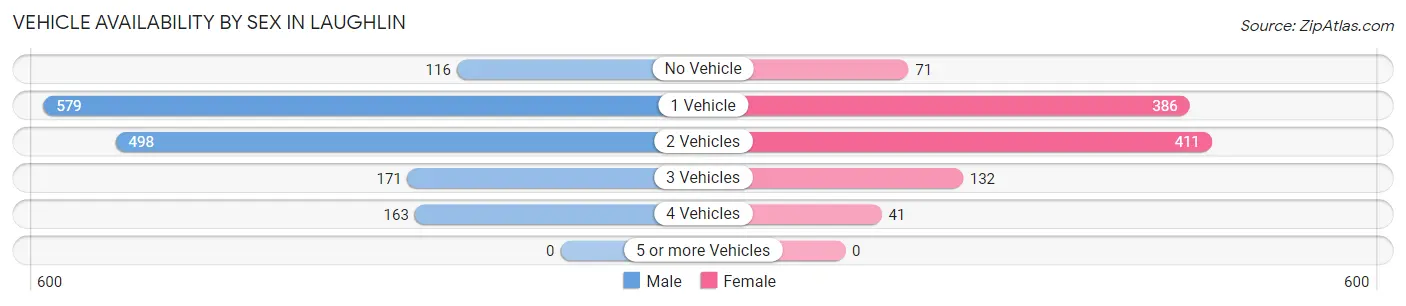
Vehicle Availability by Sex in Laughlin
The most prevalent vehicle ownership categories in Laughlin are males with 1 vehicle (579, accounting for 37.9%) and females with 1 vehicle (386, making up 55.6%).
| Vehicles Available | Male | Female |
| No Vehicle | 116 (7.6%) | 71 (6.8%) |
| 1 Vehicle | 579 (37.9%) | 386 (37.1%) |
| 2 Vehicles | 498 (32.6%) | 411 (39.5%) |
| 3 Vehicles | 171 (11.2%) | 132 (12.7%) |
| 4 Vehicles | 163 (10.7%) | 41 (3.9%) |
| 5 or more Vehicles | 0 (0.0%) | 0 (0.0%) |
| Total | 1,527 (100.0%) | 1,041 (100.0%) |
Commute Time in Laughlin
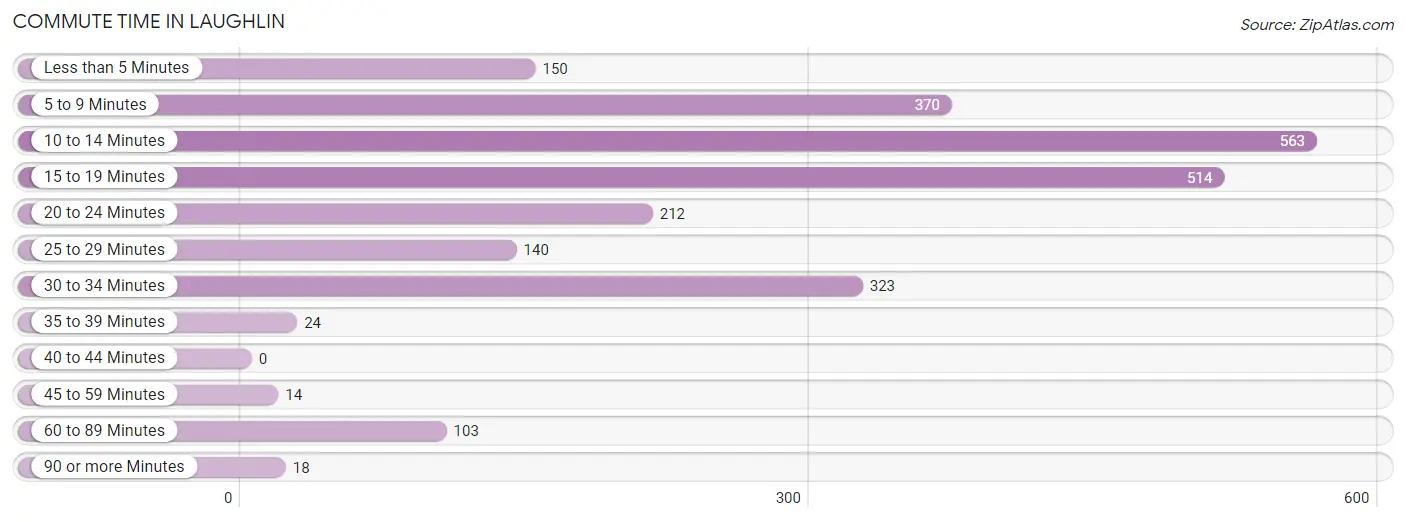
The most frequently occuring commute durations in Laughlin are 10 to 14 minutes (563 commuters, 23.2%), 15 to 19 minutes (514 commuters, 21.1%), and 5 to 9 minutes (370 commuters, 15.2%).
| Commute Time | # Commuters | % Commuters |
| Less than 5 Minutes | 150 | 6.2% |
| 5 to 9 Minutes | 370 | 15.2% |
| 10 to 14 Minutes | 563 | 23.2% |
| 15 to 19 Minutes | 514 | 21.1% |
| 20 to 24 Minutes | 212 | 8.7% |
| 25 to 29 Minutes | 140 | 5.8% |
| 30 to 34 Minutes | 323 | 13.3% |
| 35 to 39 Minutes | 24 | 1.0% |
| 40 to 44 Minutes | 0 | 0.0% |
| 45 to 59 Minutes | 14 | 0.6% |
| 60 to 89 Minutes | 103 | 4.2% |
| 90 or more Minutes | 18 | 0.7% |
Commute Time by Sex in Laughlin
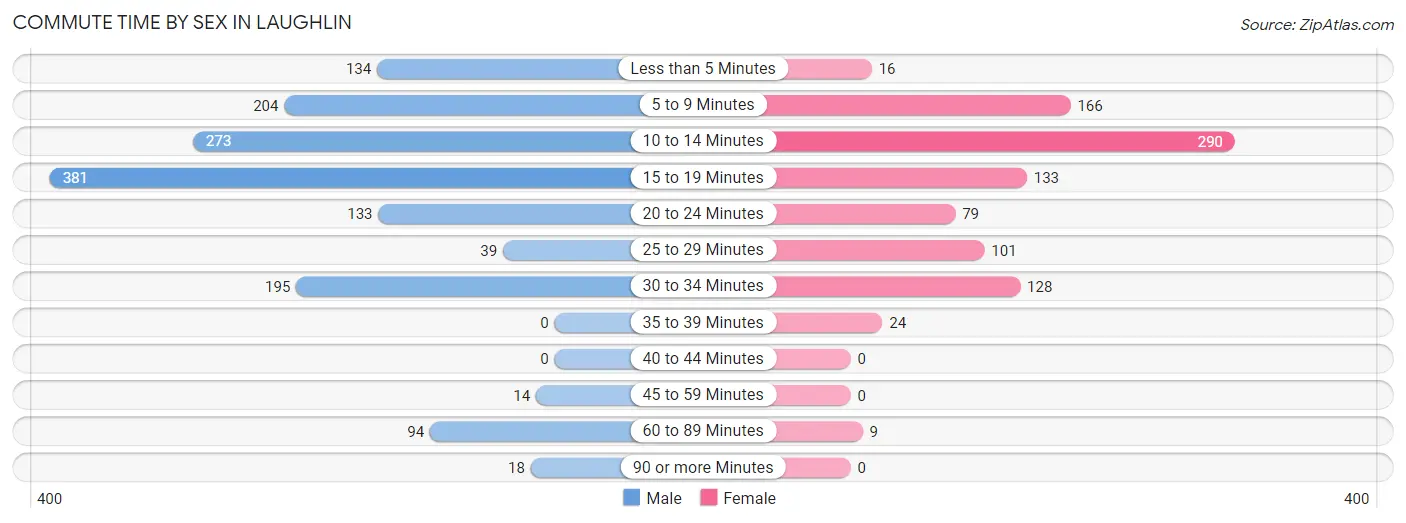
The most common commute times in Laughlin are 15 to 19 minutes (381 commuters, 25.7%) for males and 10 to 14 minutes (290 commuters, 30.7%) for females.
| Commute Time | Male | Female |
| Less than 5 Minutes | 134 (9.0%) | 16 (1.7%) |
| 5 to 9 Minutes | 204 (13.7%) | 166 (17.5%) |
| 10 to 14 Minutes | 273 (18.4%) | 290 (30.7%) |
| 15 to 19 Minutes | 381 (25.7%) | 133 (14.1%) |
| 20 to 24 Minutes | 133 (9.0%) | 79 (8.4%) |
| 25 to 29 Minutes | 39 (2.6%) | 101 (10.7%) |
| 30 to 34 Minutes | 195 (13.1%) | 128 (13.5%) |
| 35 to 39 Minutes | 0 (0.0%) | 24 (2.5%) |
| 40 to 44 Minutes | 0 (0.0%) | 0 (0.0%) |
| 45 to 59 Minutes | 14 (0.9%) | 0 (0.0%) |
| 60 to 89 Minutes | 94 (6.3%) | 9 (0.9%) |
| 90 or more Minutes | 18 (1.2%) | 0 (0.0%) |
Time of Departure to Work by Sex in Laughlin
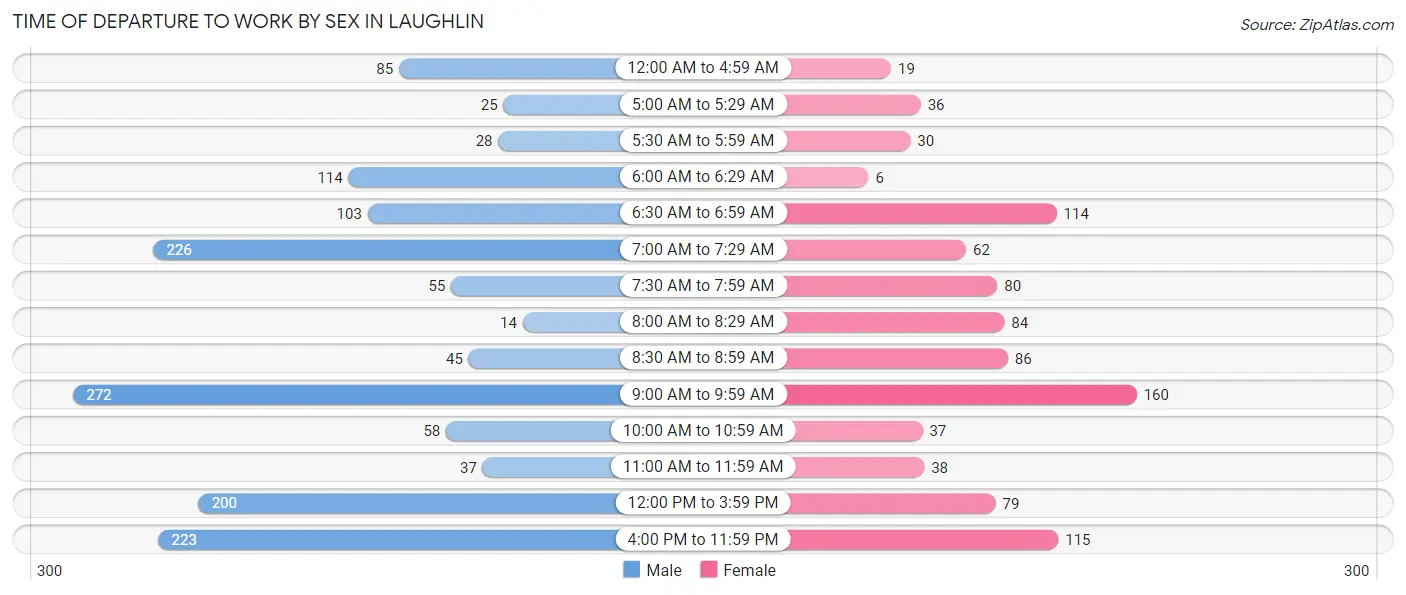
The most frequent times of departure to work in Laughlin are 9:00 AM to 9:59 AM (272, 18.3%) for males and 9:00 AM to 9:59 AM (160, 16.9%) for females.
| Time of Departure | Male | Female |
| 12:00 AM to 4:59 AM | 85 (5.7%) | 19 (2.0%) |
| 5:00 AM to 5:29 AM | 25 (1.7%) | 36 (3.8%) |
| 5:30 AM to 5:59 AM | 28 (1.9%) | 30 (3.2%) |
| 6:00 AM to 6:29 AM | 114 (7.7%) | 6 (0.6%) |
| 6:30 AM to 6:59 AM | 103 (6.9%) | 114 (12.0%) |
| 7:00 AM to 7:29 AM | 226 (15.2%) | 62 (6.6%) |
| 7:30 AM to 7:59 AM | 55 (3.7%) | 80 (8.5%) |
| 8:00 AM to 8:29 AM | 14 (0.9%) | 84 (8.9%) |
| 8:30 AM to 8:59 AM | 45 (3.0%) | 86 (9.1%) |
| 9:00 AM to 9:59 AM | 272 (18.3%) | 160 (16.9%) |
| 10:00 AM to 10:59 AM | 58 (3.9%) | 37 (3.9%) |
| 11:00 AM to 11:59 AM | 37 (2.5%) | 38 (4.0%) |
| 12:00 PM to 3:59 PM | 200 (13.5%) | 79 (8.4%) |
| 4:00 PM to 11:59 PM | 223 (15.0%) | 115 (12.2%) |
| Total | 1,485 (100.0%) | 946 (100.0%) |
Housing Occupancy in Laughlin
Occupancy by Ownership in Laughlin
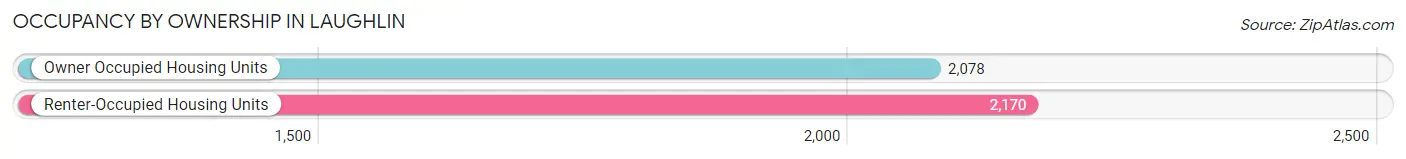
Of the total 4,248 dwellings in Laughlin, owner-occupied units account for 2,078 (48.9%), while renter-occupied units make up 2,170 (51.1%).
| Occupancy | # Housing Units | % Housing Units |
| Owner Occupied Housing Units | 2,078 | 48.9% |
| Renter-Occupied Housing Units | 2,170 | 51.1% |
| Total Occupied Housing Units | 4,248 | 100.0% |
Occupancy by Household Size in Laughlin
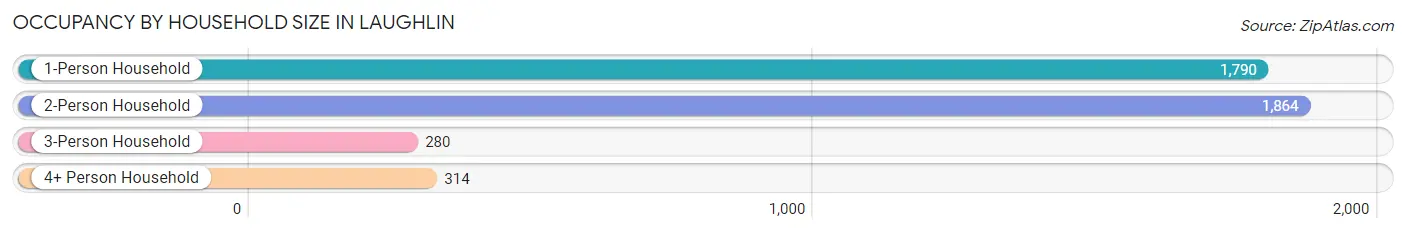
| Household Size | # Housing Units | % Housing Units |
| 1-Person Household | 1,790 | 42.1% |
| 2-Person Household | 1,864 | 43.9% |
| 3-Person Household | 280 | 6.6% |
| 4+ Person Household | 314 | 7.4% |
| Total Housing Units | 4,248 | 100.0% |
Occupancy by Ownership by Household Size in Laughlin
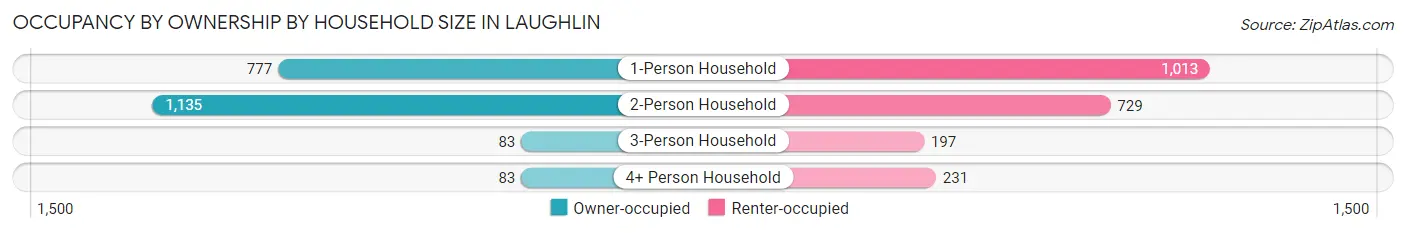
| Household Size | Owner-occupied | Renter-occupied |
| 1-Person Household | 777 (43.4%) | 1,013 (56.6%) |
| 2-Person Household | 1,135 (60.9%) | 729 (39.1%) |
| 3-Person Household | 83 (29.6%) | 197 (70.4%) |
| 4+ Person Household | 83 (26.4%) | 231 (73.6%) |
| Total Housing Units | 2,078 (48.9%) | 2,170 (51.1%) |
Occupancy by Educational Attainment in Laughlin
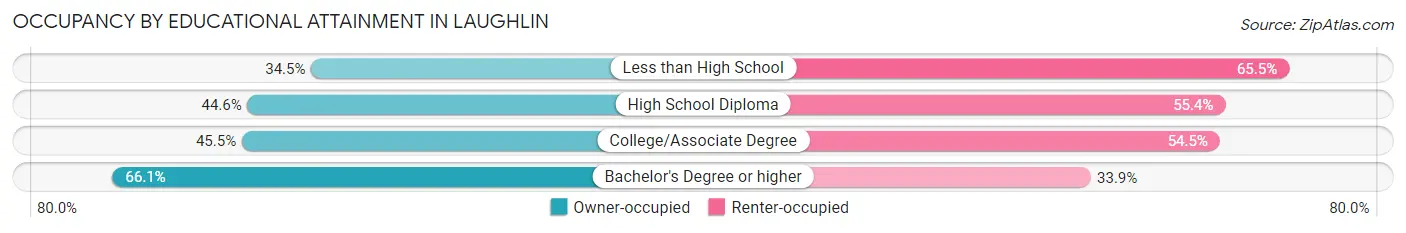
| Household Size | Owner-occupied | Renter-occupied |
| Less than High School | 164 (34.5%) | 311 (65.5%) |
| High School Diploma | 570 (44.6%) | 707 (55.4%) |
| College/Associate Degree | 676 (45.5%) | 809 (54.5%) |
| Bachelor's Degree or higher | 668 (66.1%) | 343 (33.9%) |
Occupancy by Age of Householder in Laughlin
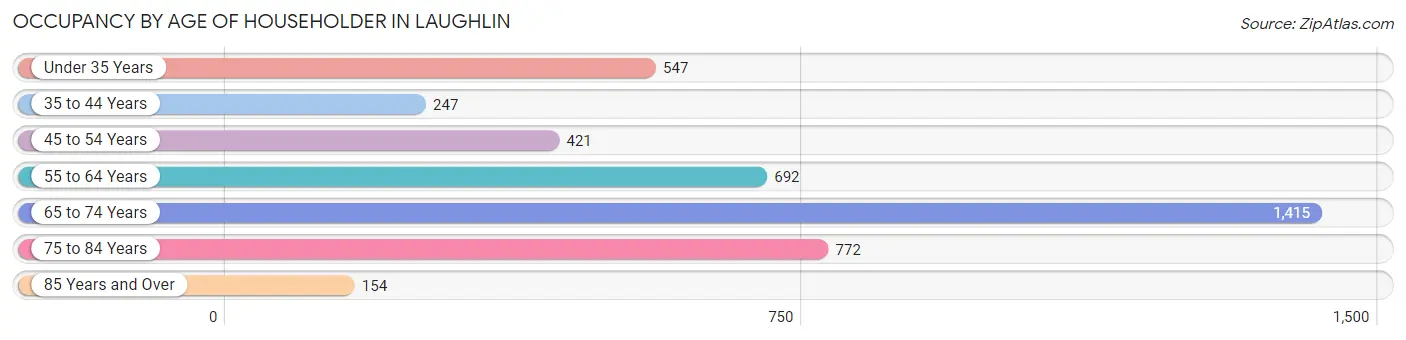
| Age Bracket | # Households | % Households |
| Under 35 Years | 547 | 12.9% |
| 35 to 44 Years | 247 | 5.8% |
| 45 to 54 Years | 421 | 9.9% |
| 55 to 64 Years | 692 | 16.3% |
| 65 to 74 Years | 1,415 | 33.3% |
| 75 to 84 Years | 772 | 18.2% |
| 85 Years and Over | 154 | 3.6% |
| Total | 4,248 | 100.0% |
Housing Finances in Laughlin
Median Income by Occupancy in Laughlin
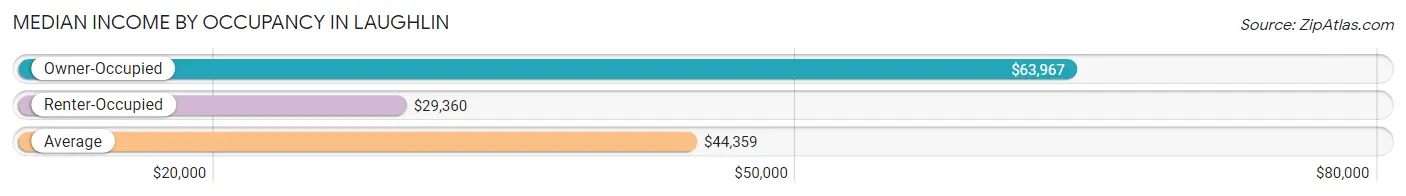
| Occupancy Type | # Households | Median Income |
| Owner-Occupied | 2,078 (48.9%) | $63,967 |
| Renter-Occupied | 2,170 (51.1%) | $29,360 |
| Average | 4,248 (100.0%) | $44,359 |
Occupancy by Householder Income Bracket in Laughlin
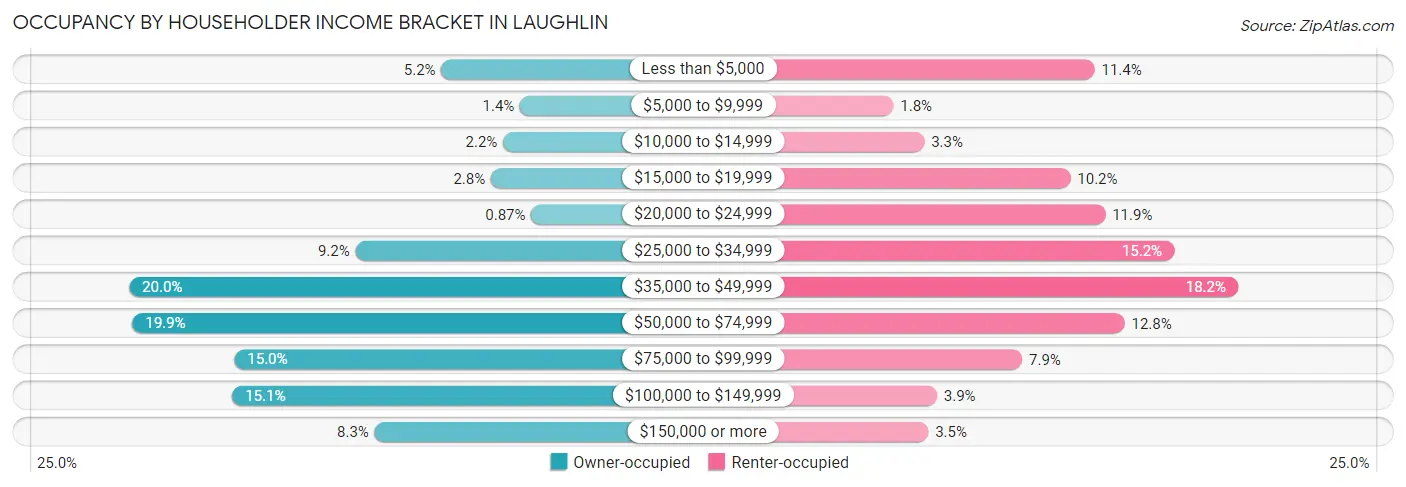
| Income Bracket | Owner-occupied | Renter-occupied |
| Less than $5,000 | 107 (5.1%) | 247 (11.4%) |
| $5,000 to $9,999 | 29 (1.4%) | 39 (1.8%) |
| $10,000 to $14,999 | 46 (2.2%) | 71 (3.3%) |
| $15,000 to $19,999 | 58 (2.8%) | 222 (10.2%) |
| $20,000 to $24,999 | 18 (0.9%) | 258 (11.9%) |
| $25,000 to $34,999 | 192 (9.2%) | 329 (15.2%) |
| $35,000 to $49,999 | 416 (20.0%) | 395 (18.2%) |
| $50,000 to $74,999 | 413 (19.9%) | 278 (12.8%) |
| $75,000 to $99,999 | 312 (15.0%) | 172 (7.9%) |
| $100,000 to $149,999 | 314 (15.1%) | 84 (3.9%) |
| $150,000 or more | 173 (8.3%) | 75 (3.5%) |
| Total | 2,078 (100.0%) | 2,170 (100.0%) |
Monthly Housing Cost Tiers in Laughlin
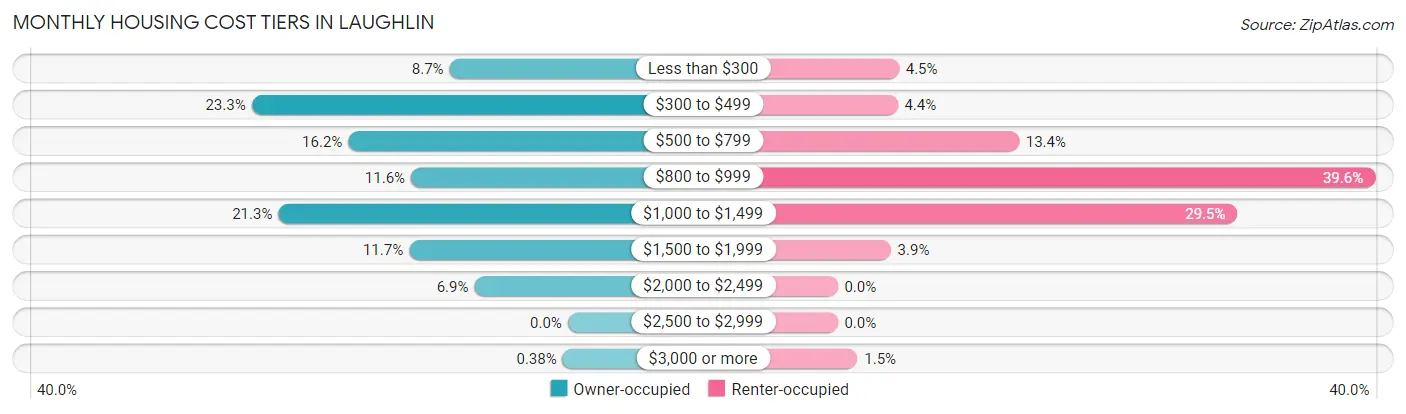
| Monthly Cost | Owner-occupied | Renter-occupied |
| Less than $300 | 181 (8.7%) | 98 (4.5%) |
| $300 to $499 | 484 (23.3%) | 96 (4.4%) |
| $500 to $799 | 336 (16.2%) | 290 (13.4%) |
| $800 to $999 | 240 (11.6%) | 859 (39.6%) |
| $1,000 to $1,499 | 443 (21.3%) | 639 (29.4%) |
| $1,500 to $1,999 | 243 (11.7%) | 85 (3.9%) |
| $2,000 to $2,499 | 143 (6.9%) | 0 (0.0%) |
| $2,500 to $2,999 | 0 (0.0%) | 0 (0.0%) |
| $3,000 or more | 8 (0.4%) | 32 (1.5%) |
| Total | 2,078 (100.0%) | 2,170 (100.0%) |
Physical Housing Characteristics in Laughlin
Housing Structures in Laughlin
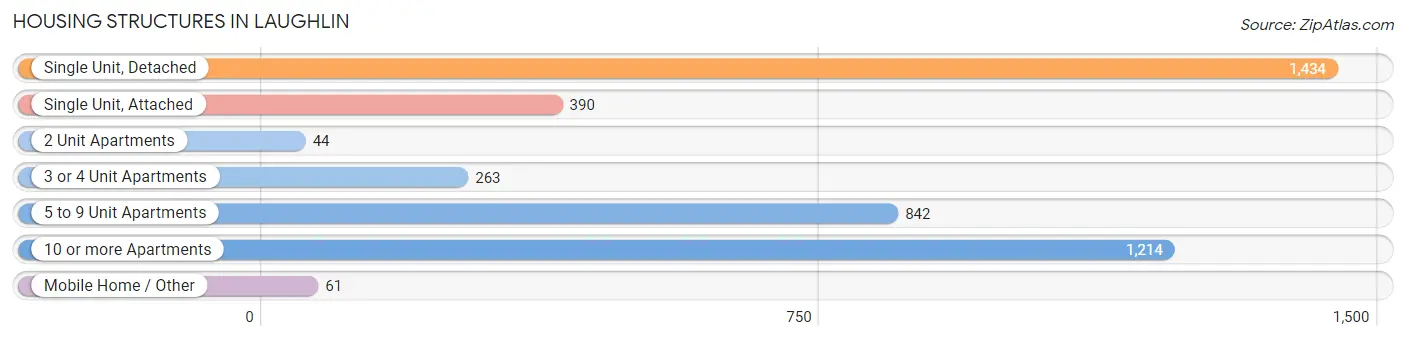
| Structure Type | # Housing Units | % Housing Units |
| Single Unit, Detached | 1,434 | 33.8% |
| Single Unit, Attached | 390 | 9.2% |
| 2 Unit Apartments | 44 | 1.0% |
| 3 or 4 Unit Apartments | 263 | 6.2% |
| 5 to 9 Unit Apartments | 842 | 19.8% |
| 10 or more Apartments | 1,214 | 28.6% |
| Mobile Home / Other | 61 | 1.4% |
| Total | 4,248 | 100.0% |
Housing Structures by Occupancy in Laughlin
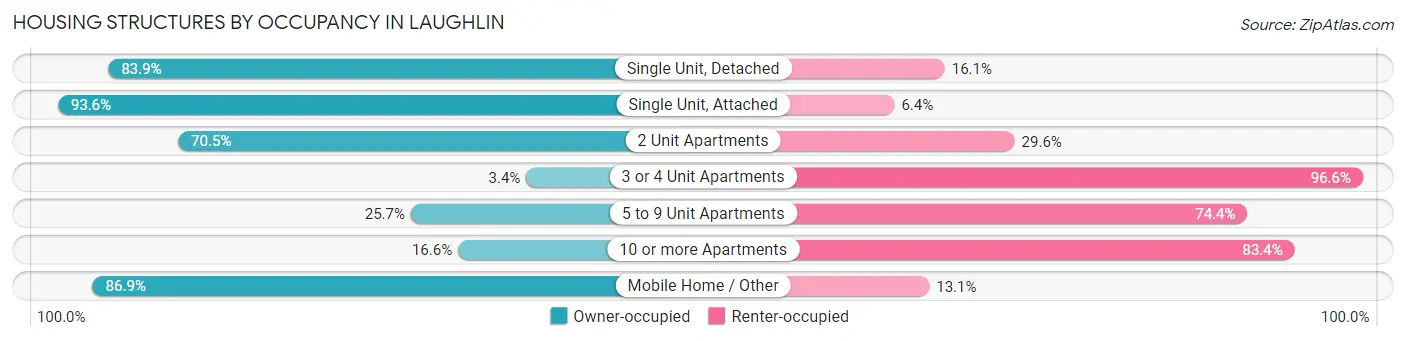
| Structure Type | Owner-occupied | Renter-occupied |
| Single Unit, Detached | 1,203 (83.9%) | 231 (16.1%) |
| Single Unit, Attached | 365 (93.6%) | 25 (6.4%) |
| 2 Unit Apartments | 31 (70.5%) | 13 (29.5%) |
| 3 or 4 Unit Apartments | 9 (3.4%) | 254 (96.6%) |
| 5 to 9 Unit Apartments | 216 (25.7%) | 626 (74.4%) |
| 10 or more Apartments | 201 (16.6%) | 1,013 (83.4%) |
| Mobile Home / Other | 53 (86.9%) | 8 (13.1%) |
| Total | 2,078 (48.9%) | 2,170 (51.1%) |
Housing Structures by Number of Rooms in Laughlin
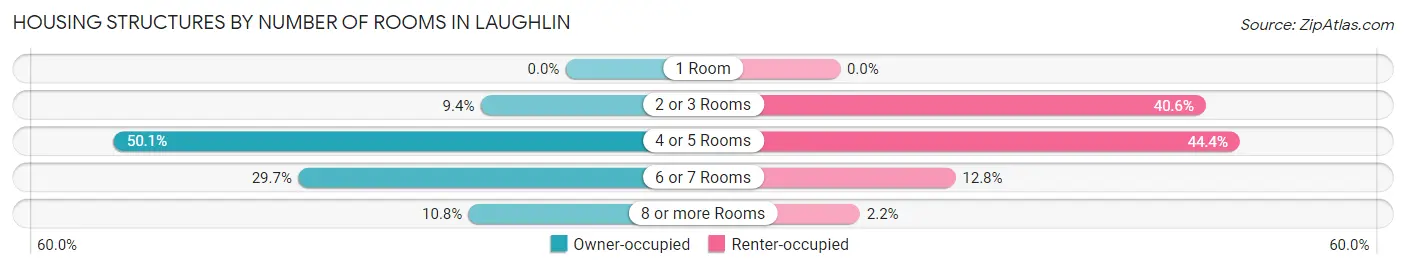
| Number of Rooms | Owner-occupied | Renter-occupied |
| 1 Room | 0 (0.0%) | 0 (0.0%) |
| 2 or 3 Rooms | 196 (9.4%) | 881 (40.6%) |
| 4 or 5 Rooms | 1,041 (50.1%) | 963 (44.4%) |
| 6 or 7 Rooms | 617 (29.7%) | 278 (12.8%) |
| 8 or more Rooms | 224 (10.8%) | 48 (2.2%) |
| Total | 2,078 (100.0%) | 2,170 (100.0%) |
Housing Structure by Heating Type in Laughlin
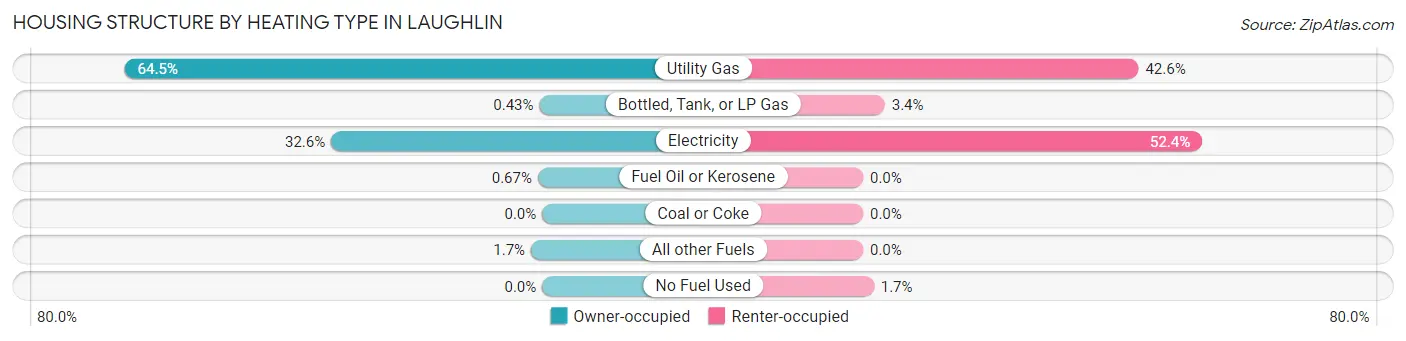
| Heating Type | Owner-occupied | Renter-occupied |
| Utility Gas | 1,341 (64.5%) | 924 (42.6%) |
| Bottled, Tank, or LP Gas | 9 (0.4%) | 73 (3.4%) |
| Electricity | 678 (32.6%) | 1,137 (52.4%) |
| Fuel Oil or Kerosene | 14 (0.7%) | 0 (0.0%) |
| Coal or Coke | 0 (0.0%) | 0 (0.0%) |
| All other Fuels | 36 (1.7%) | 0 (0.0%) |
| No Fuel Used | 0 (0.0%) | 36 (1.7%) |
| Total | 2,078 (100.0%) | 2,170 (100.0%) |
Household Vehicle Usage in Laughlin
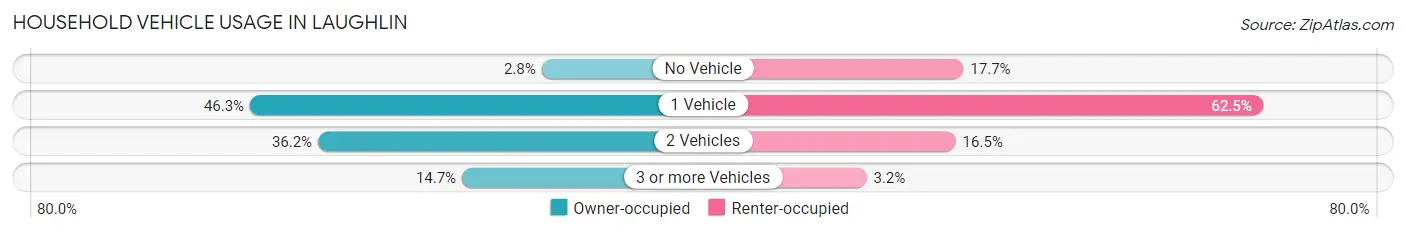
| Vehicles per Household | Owner-occupied | Renter-occupied |
| No Vehicle | 58 (2.8%) | 384 (17.7%) |
| 1 Vehicle | 963 (46.3%) | 1,357 (62.5%) |
| 2 Vehicles | 752 (36.2%) | 359 (16.5%) |
| 3 or more Vehicles | 305 (14.7%) | 70 (3.2%) |
| Total | 2,078 (100.0%) | 2,170 (100.0%) |
Real Estate & Mortgages in Laughlin
Real Estate and Mortgage Overview in Laughlin
| Characteristic | Without Mortgage | With Mortgage |
| Housing Units | 905 | 1,173 |
| Median Property Value | $217,900 | $229,800 |
| Median Household Income | $61,850 | $97 |
| Monthly Housing Costs | $432 | $8 |
| Real Estate Taxes | $1,454 | $50 |
Property Value by Mortgage Status in Laughlin
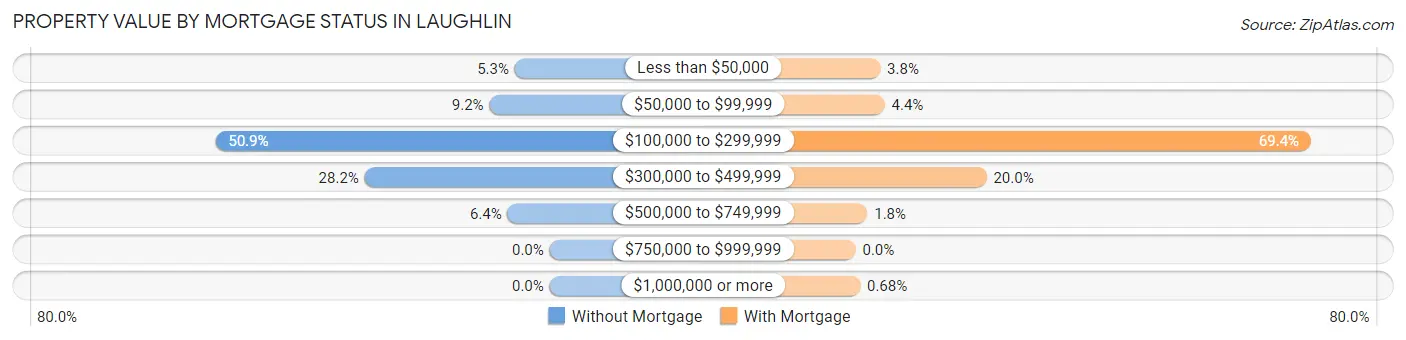
| Property Value | Without Mortgage | With Mortgage |
| Less than $50,000 | 48 (5.3%) | 44 (3.7%) |
| $50,000 to $99,999 | 83 (9.2%) | 52 (4.4%) |
| $100,000 to $299,999 | 461 (50.9%) | 814 (69.4%) |
| $300,000 to $499,999 | 255 (28.2%) | 234 (20.0%) |
| $500,000 to $749,999 | 58 (6.4%) | 21 (1.8%) |
| $750,000 to $999,999 | 0 (0.0%) | 0 (0.0%) |
| $1,000,000 or more | 0 (0.0%) | 8 (0.7%) |
| Total | 905 (100.0%) | 1,173 (100.0%) |
Household Income by Mortgage Status in Laughlin
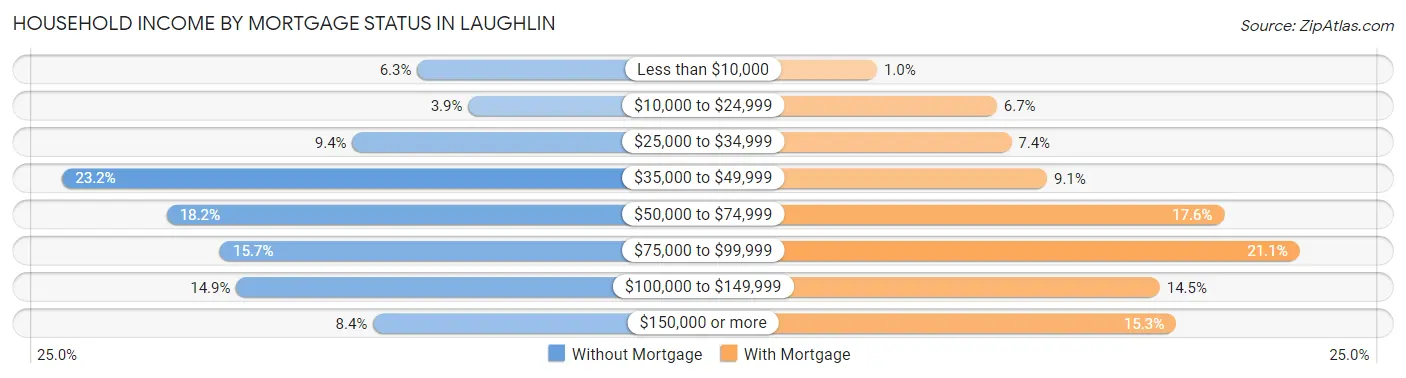
| Household Income | Without Mortgage | With Mortgage |
| Less than $10,000 | 57 (6.3%) | 12 (1.0%) |
| $10,000 to $24,999 | 35 (3.9%) | 79 (6.7%) |
| $25,000 to $34,999 | 85 (9.4%) | 87 (7.4%) |
| $35,000 to $49,999 | 210 (23.2%) | 107 (9.1%) |
| $50,000 to $74,999 | 165 (18.2%) | 206 (17.6%) |
| $75,000 to $99,999 | 142 (15.7%) | 248 (21.1%) |
| $100,000 to $149,999 | 135 (14.9%) | 170 (14.5%) |
| $150,000 or more | 76 (8.4%) | 179 (15.3%) |
| Total | 905 (100.0%) | 1,173 (100.0%) |
Property Value to Household Income Ratio in Laughlin
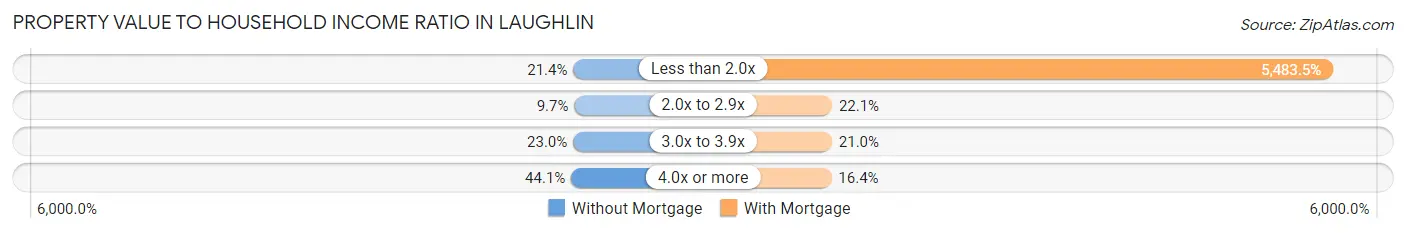
| Value-to-Income Ratio | Without Mortgage | With Mortgage |
| Less than 2.0x | 194 (21.4%) | 64,321 (5,483.5%) |
| 2.0x to 2.9x | 88 (9.7%) | 259 (22.1%) |
| 3.0x to 3.9x | 208 (23.0%) | 246 (21.0%) |
| 4.0x or more | 399 (44.1%) | 192 (16.4%) |
| Total | 905 (100.0%) | 1,173 (100.0%) |
Real Estate Taxes by Mortgage Status in Laughlin
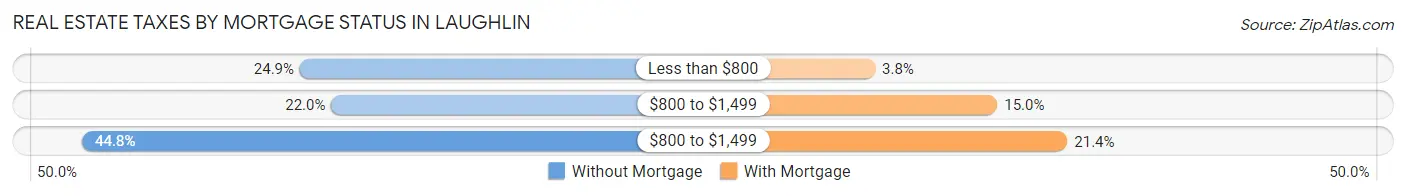
| Property Taxes | Without Mortgage | With Mortgage |
| Less than $800 | 225 (24.9%) | 45 (3.8%) |
| $800 to $1,499 | 199 (22.0%) | 176 (15.0%) |
| $800 to $1,499 | 405 (44.8%) | 251 (21.4%) |
| Total | 905 (100.0%) | 1,173 (100.0%) |
Health & Disability in Laughlin
Health Insurance Coverage by Age in Laughlin
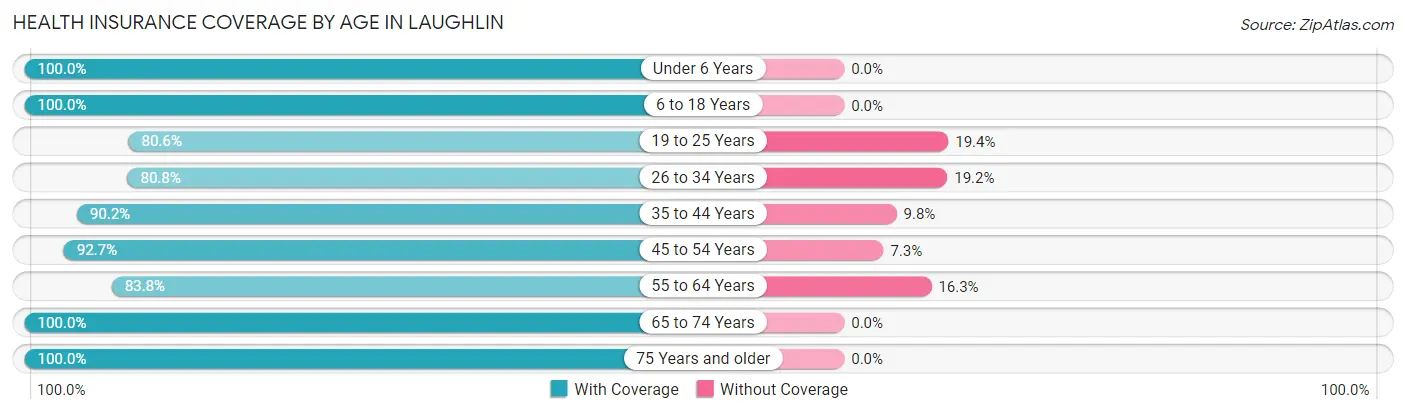
| Age Bracket | With Coverage | Without Coverage |
| Under 6 Years | 340 (100.0%) | 0 (0.0%) |
| 6 to 18 Years | 414 (100.0%) | 0 (0.0%) |
| 19 to 25 Years | 420 (80.6%) | 101 (19.4%) |
| 26 to 34 Years | 656 (80.8%) | 156 (19.2%) |
| 35 to 44 Years | 490 (90.2%) | 53 (9.8%) |
| 45 to 54 Years | 621 (92.7%) | 49 (7.3%) |
| 55 to 64 Years | 1,232 (83.8%) | 239 (16.3%) |
| 65 to 74 Years | 2,055 (100.0%) | 0 (0.0%) |
| 75 Years and older | 1,358 (100.0%) | 0 (0.0%) |
| Total | 7,586 (92.7%) | 598 (7.3%) |
Health Insurance Coverage by Citizenship Status in Laughlin
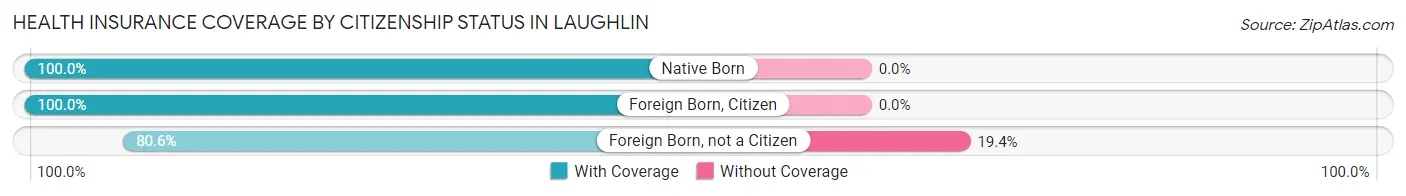
| Citizenship Status | With Coverage | Without Coverage |
| Native Born | 340 (100.0%) | 0 (0.0%) |
| Foreign Born, Citizen | 414 (100.0%) | 0 (0.0%) |
| Foreign Born, not a Citizen | 420 (80.6%) | 101 (19.4%) |
Health Insurance Coverage by Household Income in Laughlin
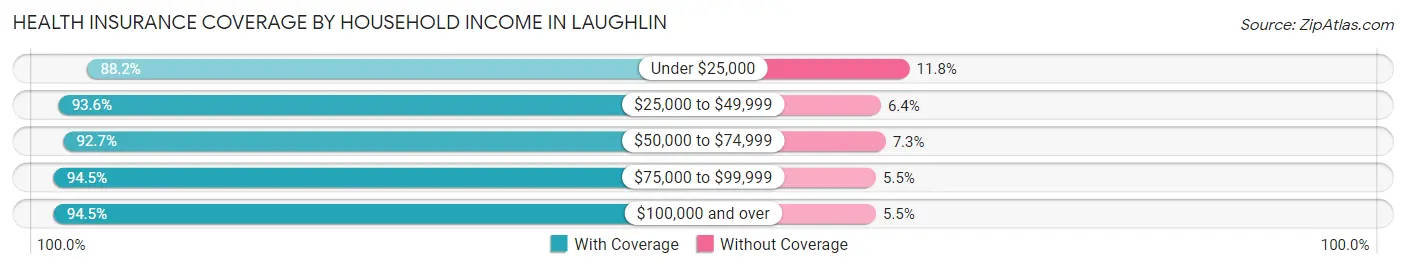
| Household Income | With Coverage | Without Coverage |
| Under $25,000 | 1,408 (88.2%) | 188 (11.8%) |
| $25,000 to $49,999 | 2,295 (93.6%) | 157 (6.4%) |
| $50,000 to $74,999 | 1,348 (92.7%) | 106 (7.3%) |
| $75,000 to $99,999 | 982 (94.5%) | 57 (5.5%) |
| $100,000 and over | 1,553 (94.5%) | 90 (5.5%) |
Public vs Private Health Insurance Coverage by Age in Laughlin
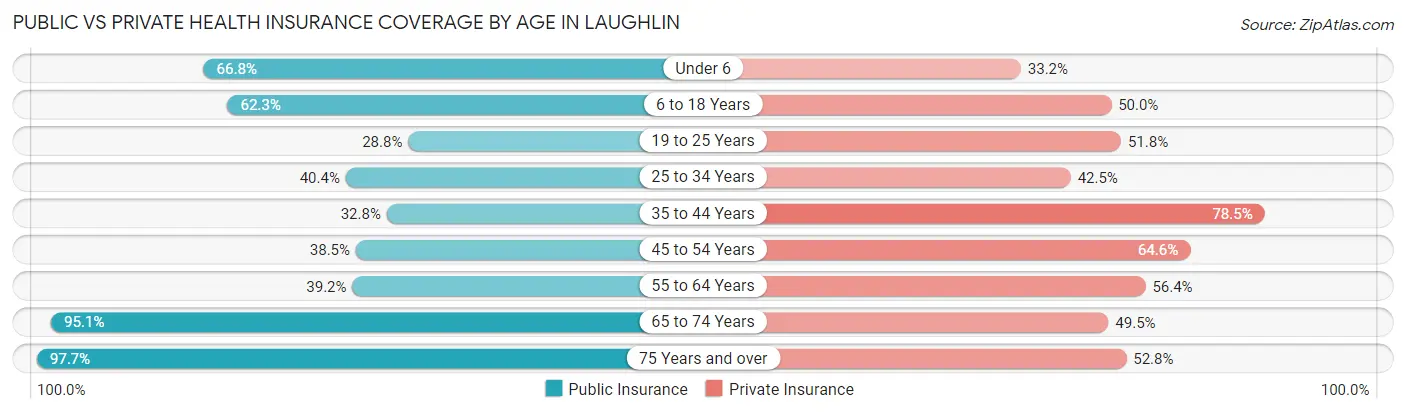
| Age Bracket | Public Insurance | Private Insurance |
| Under 6 | 227 (66.8%) | 113 (33.2%) |
| 6 to 18 Years | 258 (62.3%) | 207 (50.0%) |
| 19 to 25 Years | 150 (28.8%) | 270 (51.8%) |
| 25 to 34 Years | 328 (40.4%) | 345 (42.5%) |
| 35 to 44 Years | 178 (32.8%) | 426 (78.4%) |
| 45 to 54 Years | 258 (38.5%) | 433 (64.6%) |
| 55 to 64 Years | 576 (39.2%) | 829 (56.4%) |
| 65 to 74 Years | 1,954 (95.1%) | 1,017 (49.5%) |
| 75 Years and over | 1,327 (97.7%) | 717 (52.8%) |
| Total | 5,256 (64.2%) | 4,357 (53.2%) |
Disability Status by Sex by Age in Laughlin
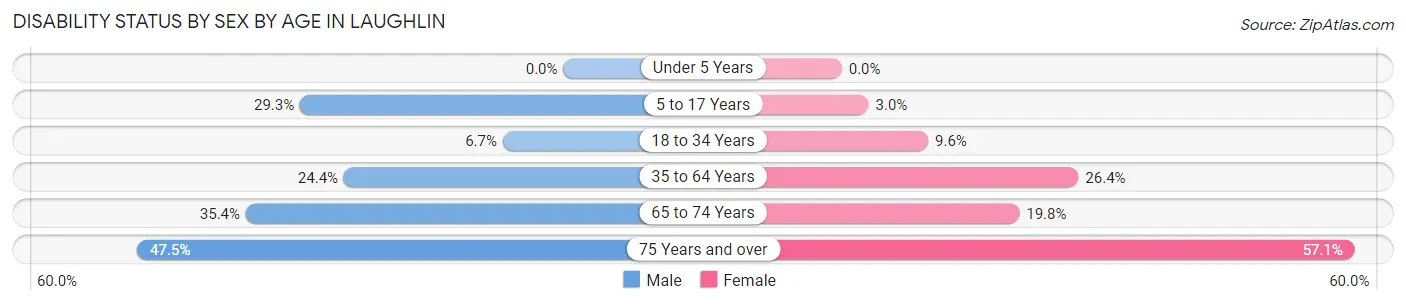
| Age Bracket | Male | Female |
| Under 5 Years | 0 (0.0%) | 0 (0.0%) |
| 5 to 17 Years | 78 (29.3%) | 7 (3.0%) |
| 18 to 34 Years | 46 (6.7%) | 64 (9.6%) |
| 35 to 64 Years | 362 (24.4%) | 317 (26.4%) |
| 65 to 74 Years | 360 (35.4%) | 205 (19.8%) |
| 75 Years and over | 348 (47.5%) | 357 (57.1%) |
Disability Class by Sex by Age in Laughlin
Disability Class: Hearing Difficulty
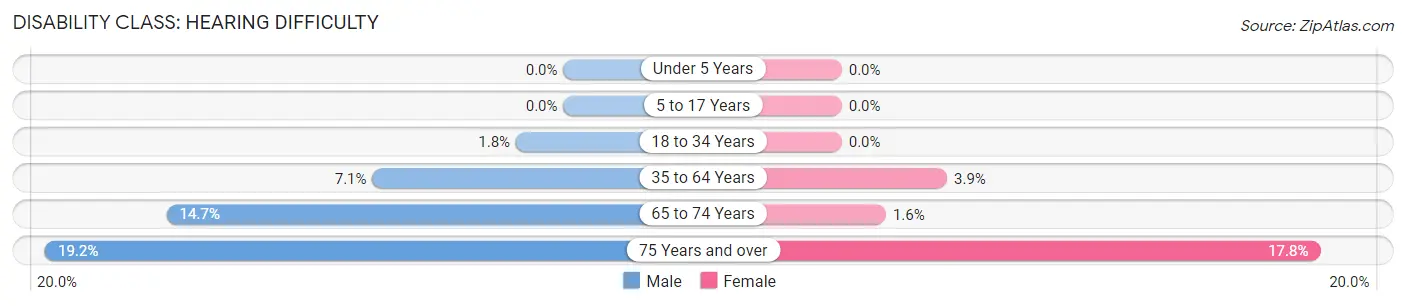
| Age Bracket | Male | Female |
| Under 5 Years | 0 (0.0%) | 0 (0.0%) |
| 5 to 17 Years | 0 (0.0%) | 0 (0.0%) |
| 18 to 34 Years | 12 (1.8%) | 0 (0.0%) |
| 35 to 64 Years | 105 (7.1%) | 47 (3.9%) |
| 65 to 74 Years | 150 (14.7%) | 17 (1.6%) |
| 75 Years and over | 141 (19.2%) | 111 (17.8%) |
Disability Class: Vision Difficulty
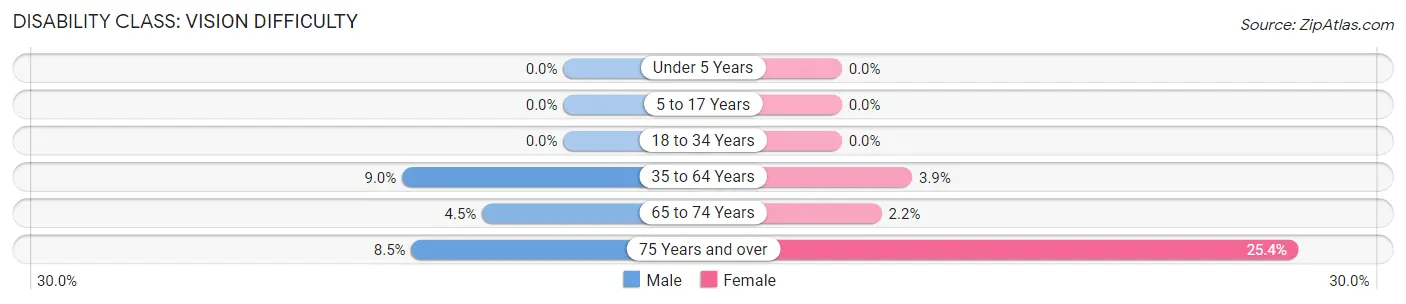
| Age Bracket | Male | Female |
| Under 5 Years | 0 (0.0%) | 0 (0.0%) |
| 5 to 17 Years | 0 (0.0%) | 0 (0.0%) |
| 18 to 34 Years | 0 (0.0%) | 0 (0.0%) |
| 35 to 64 Years | 133 (9.0%) | 47 (3.9%) |
| 65 to 74 Years | 46 (4.5%) | 23 (2.2%) |
| 75 Years and over | 62 (8.5%) | 159 (25.4%) |
Disability Class: Cognitive Difficulty
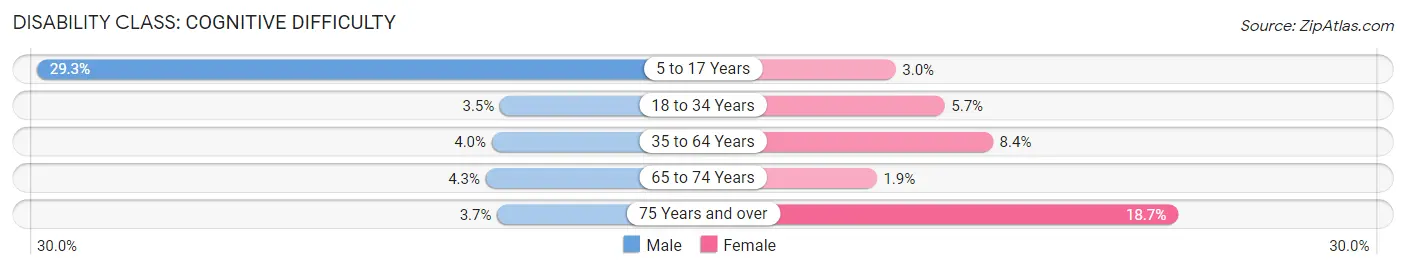
| Age Bracket | Male | Female |
| 5 to 17 Years | 78 (29.3%) | 7 (3.0%) |
| 18 to 34 Years | 24 (3.5%) | 38 (5.7%) |
| 35 to 64 Years | 59 (4.0%) | 101 (8.4%) |
| 65 to 74 Years | 44 (4.3%) | 20 (1.9%) |
| 75 Years and over | 27 (3.7%) | 117 (18.7%) |
Disability Class: Ambulatory Difficulty
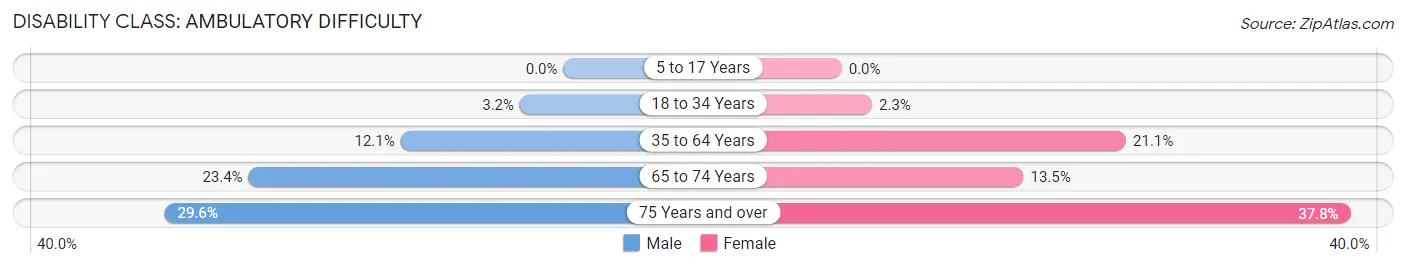
| Age Bracket | Male | Female |
| 5 to 17 Years | 0 (0.0%) | 0 (0.0%) |
| 18 to 34 Years | 22 (3.2%) | 15 (2.2%) |
| 35 to 64 Years | 179 (12.1%) | 254 (21.1%) |
| 65 to 74 Years | 238 (23.4%) | 140 (13.5%) |
| 75 Years and over | 217 (29.6%) | 236 (37.8%) |
Disability Class: Self-Care Difficulty
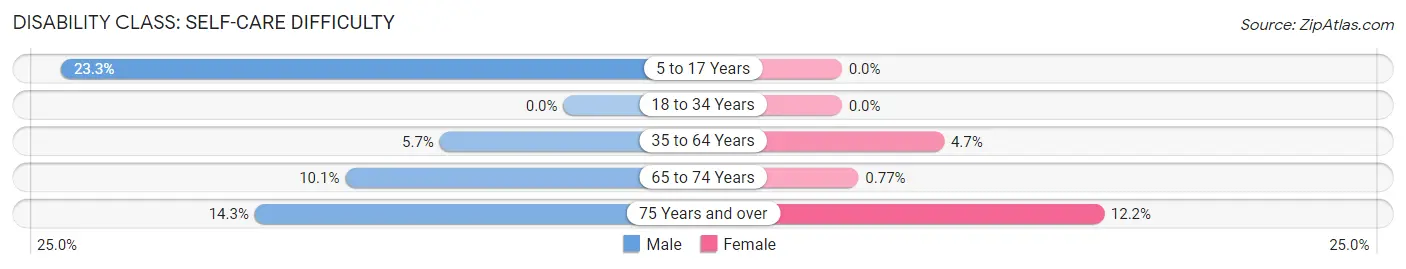
| Age Bracket | Male | Female |
| 5 to 17 Years | 62 (23.3%) | 0 (0.0%) |
| 18 to 34 Years | 0 (0.0%) | 0 (0.0%) |
| 35 to 64 Years | 85 (5.7%) | 57 (4.7%) |
| 65 to 74 Years | 103 (10.1%) | 8 (0.8%) |
| 75 Years and over | 105 (14.3%) | 76 (12.2%) |
Technology Access in Laughlin
Computing Device Access in Laughlin
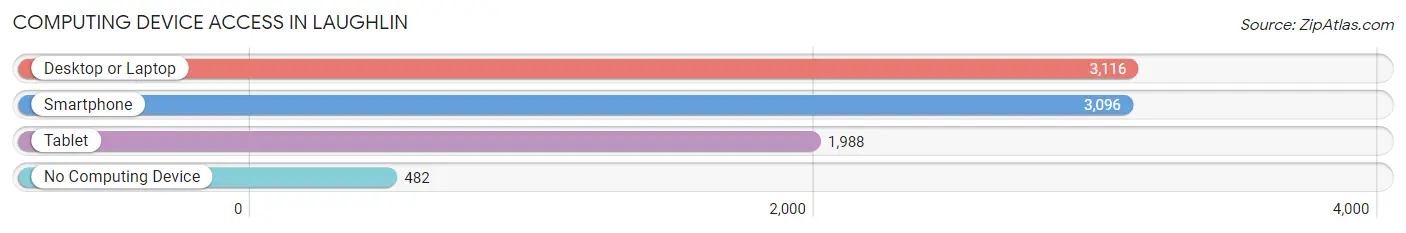
| Device Type | # Households | % Households |
| Desktop or Laptop | 3,116 | 73.4% |
| Smartphone | 3,096 | 72.9% |
| Tablet | 1,988 | 46.8% |
| No Computing Device | 482 | 11.4% |
| Total | 4,248 | 100.0% |
Internet Access in Laughlin
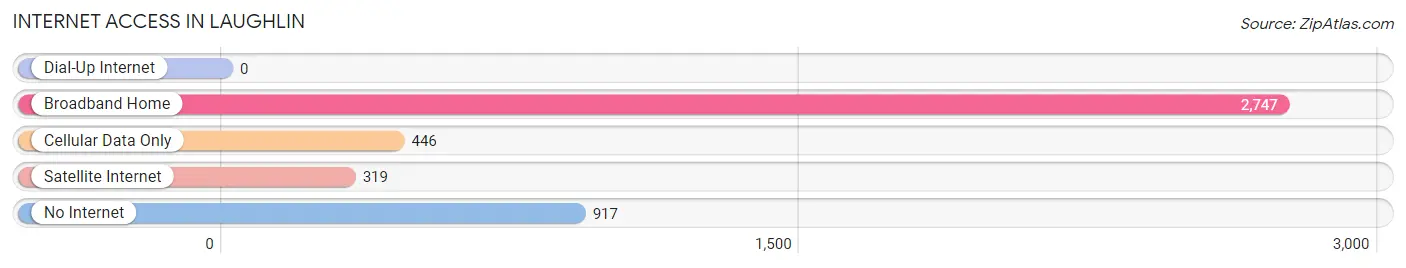
| Internet Type | # Households | % Households |
| Dial-Up Internet | 0 | 0.0% |
| Broadband Home | 2,747 | 64.7% |
| Cellular Data Only | 446 | 10.5% |
| Satellite Internet | 319 | 7.5% |
| No Internet | 917 | 21.6% |
| Total | 4,248 | 100.0% |
Laughlin Summary
Laughlin, Nevada is a small town located in Clark County, Nevada, on the Colorado River. It is situated on the Arizona-Nevada border, approximately 90 miles south of Las Vegas. The town was founded in 1964 by Don Laughlin, an entrepreneur from Las Vegas who purchased the southern tip of Nevada in order to create a town. Laughlin is now a popular tourist destination, with a population of approximately 7,500 people.
Geography
Laughlin is located in the Mojave Desert, at an elevation of approximately 1,000 feet. The town is situated on the Colorado River, which forms the border between Nevada and Arizona. The town is surrounded by mountains, including the Black Mountains to the north and the Spirit Mountain Range to the south. The climate in Laughlin is arid, with hot summers and mild winters.
Economy
Laughlin's economy is largely based on tourism. The town is home to several casinos, hotels, and resorts, which attract visitors from all over the world. The casinos offer a variety of gaming options, including slots, table games, and sports betting. In addition to the casinos, Laughlin is home to a variety of restaurants, bars, and shops. The town also has a number of recreational activities, such as golf courses, fishing, and boating.
Demographics
As of the 2010 census, the population of Laughlin was 7,323. The racial makeup of the town was 79.3% White, 1.3% African American, 0.7% Native American, 0.7% Asian, 0.1% Pacific Islander, and 17.9% from other races. The median household income in Laughlin was $37,917, and the median family income was $45,917. The per capita income in Laughlin was $20,917.
Conclusion
Laughlin, Nevada is a small town located in Clark County, Nevada, on the Colorado River. It is situated on the Arizona-Nevada border, approximately 90 miles south of Las Vegas. The town was founded in 1964 by Don Laughlin, an entrepreneur from Las Vegas who purchased the southern tip of Nevada in order to create a town. Laughlin is now a popular tourist destination, with a population of approximately 7,500 people. The town's economy is largely based on tourism, with casinos, hotels, and resorts attracting visitors from all over the world. The population of Laughlin is diverse, with a majority of White residents and a significant minority population. The median household income in Laughlin is $37,917, and the median family income is $45,917.
Common Questions
What is the Total Population of Laughlin?
Total Population of Laughlin is 8,184.
What is the Total Male Population of Laughlin?
Total Male Population of Laughlin is 4,295.
What is the Total Female Population of Laughlin?
Total Female Population of Laughlin is 3,889.
What is the Ratio of Males per 100 Females in Laughlin?
There are 110.44 Males per 100 Females in Laughlin.
What is the Ratio of Females per 100 Males in Laughlin?
There are 90.55 Females per 100 Males in Laughlin.
What is the Median Population Age in Laughlin?
Median Population Age in Laughlin is 59.9 Years.
What is the Average Family Size in Laughlin
Average Family Size in Laughlin is 2.5 People.
What is the Average Household Size in Laughlin
Average Household Size in Laughlin is 1.9 People.
What is Per Capita Income in Laughlin?
Per Capita income in Laughlin is $31,531.
What is the Median Family Income in Laughlin?
Median Family Income in Laughlin is $63,064.
What is the Median Household income in Laughlin?
Median Household Income in Laughlin is $44,359.
What is Income or Wage Gap in Laughlin?
Income or Wage Gap in Laughlin is 33.3%.
Women in Laughlin earn 66.7 cents for every dollar earned by a man.
What is Inequality or Gini Index in Laughlin?
Inequality or Gini Index in Laughlin is 0.44.
How Large is the Labor Force in Laughlin?
There are 2,990 People in the Labor Forcein in Laughlin.
What is the Percentage of People in the Labor Force in Laughlin?
39.8% of People are in the Labor Force in Laughlin.
What is the Unemployment Rate in Laughlin?
Unemployment Rate in Laughlin is 11.7%.