Indian Hills, NV
Indian Hills Map
Indian Hills Overview
5,955
TOTAL POPULATION
2,811
MALE POPULATION
3,144
FEMALE POPULATION
89.41
MALES / 100 FEMALES
111.85
FEMALES / 100 MALES
49.0
MEDIAN AGE
2.7
AVG FAMILY SIZE
2.4
AVG HOUSEHOLD SIZE
$40,502
PER CAPITA INCOME
$91,304
AVG FAMILY INCOME
$77,256
AVG HOUSEHOLD INCOME
21.3%
WAGE / INCOME GAP [ % ]
78.7¢/ $1
WAGE / INCOME GAP [ $ ]
$9,773
FAMILY INCOME DEFICIT
0.38
INEQUALITY / GINI INDEX
2,965
LABOR FORCE [ PEOPLE ]
58.6%
PERCENT IN LABOR FORCE
2.5%
UNEMPLOYMENT RATE
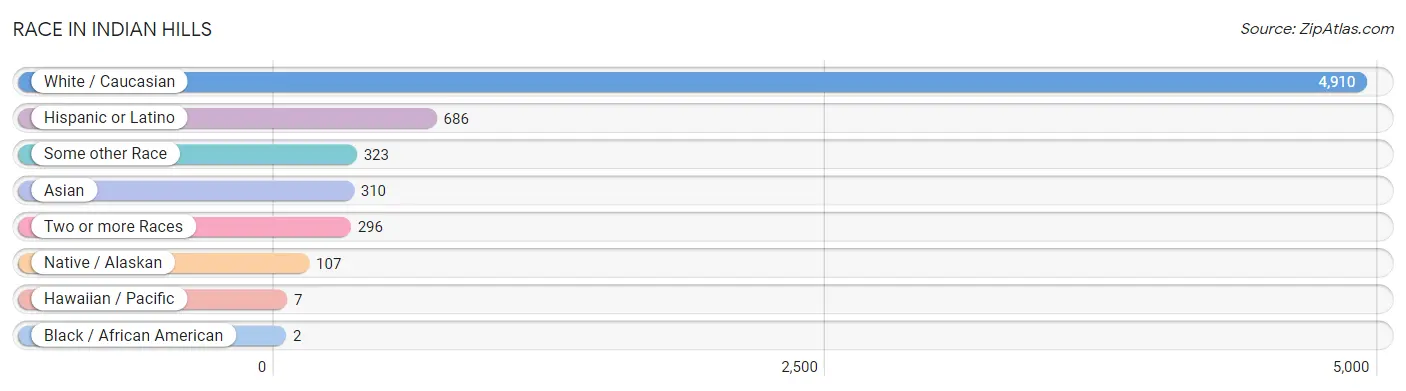
Race in Indian Hills
The most populous races in Indian Hills are White / Caucasian (4,910 | 82.5%), Hispanic or Latino (686 | 11.5%), and Some other Race (323 | 5.4%).
| Race | # Population | % Population |
| Asian | 310 | 5.2% |
| Black / African American | 2 | 0.0% |
| Hawaiian / Pacific | 7 | 0.1% |
| Hispanic or Latino | 686 | 11.5% |
| Native / Alaskan | 107 | 1.8% |
| White / Caucasian | 4,910 | 82.5% |
| Two or more Races | 296 | 5.0% |
| Some other Race | 323 | 5.4% |
| Total | 5,955 | 100.0% |
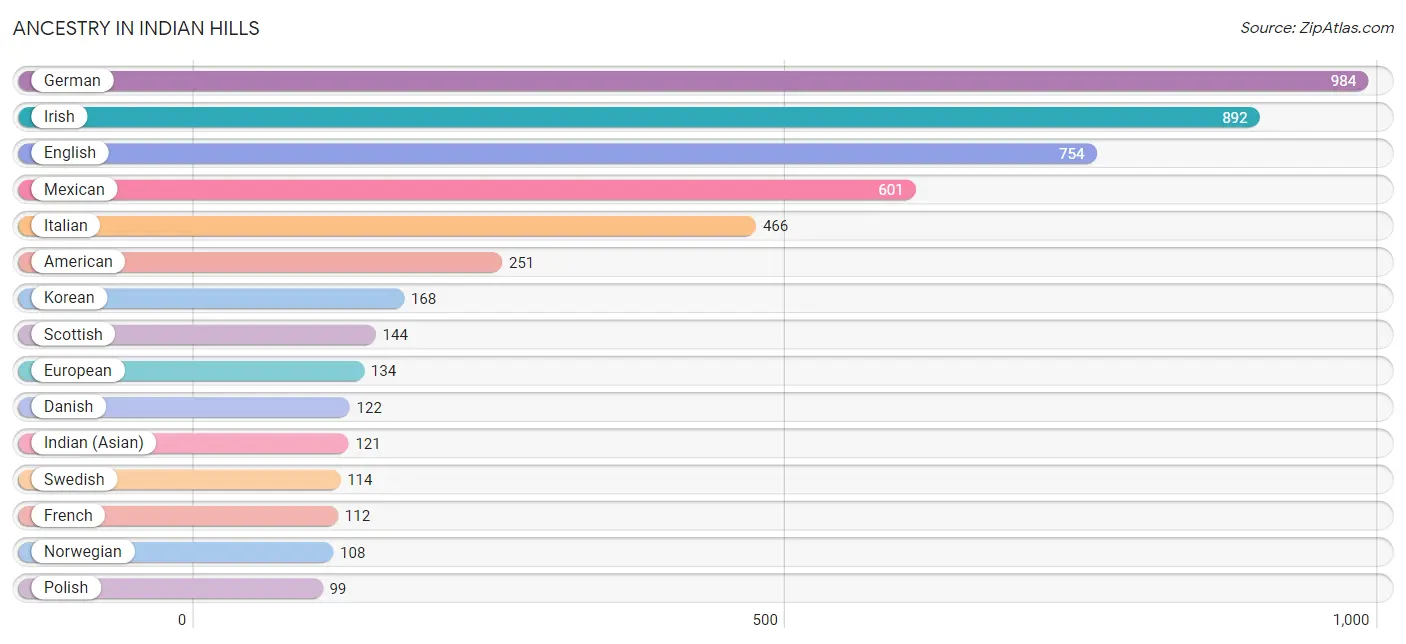
Ancestry in Indian Hills
The most populous ancestries reported in Indian Hills are German (984 | 16.5%), Irish (892 | 15.0%), English (754 | 12.7%), Mexican (601 | 10.1%), and Italian (466 | 7.8%), together accounting for 62.1% of all Indian Hills residents.
| Ancestry | # Population | % Population |
| Albanian | 12 | 0.2% |
| American | 251 | 4.2% |
| Armenian | 43 | 0.7% |
| Basque | 17 | 0.3% |
| Belgian | 14 | 0.2% |
| Bhutanese | 55 | 0.9% |
| Brazilian | 18 | 0.3% |
| British | 48 | 0.8% |
| Cajun | 24 | 0.4% |
| Central American | 17 | 0.3% |
| Cherokee | 16 | 0.3% |
| Croatian | 13 | 0.2% |
| Czech | 58 | 1.0% |
| Czechoslovakian | 5 | 0.1% |
| Danish | 122 | 2.1% |
| Dominican | 5 | 0.1% |
| Dutch | 61 | 1.0% |
| Eastern European | 13 | 0.2% |
| English | 754 | 12.7% |
| European | 134 | 2.2% |
| Finnish | 46 | 0.8% |
| French | 112 | 1.9% |
| French Canadian | 61 | 1.0% |
| German | 984 | 16.5% |
| Greek | 94 | 1.6% |
| Hopi | 12 | 0.2% |
| Hungarian | 27 | 0.4% |
| Indian (Asian) | 121 | 2.0% |
| Iranian | 30 | 0.5% |
| Irish | 892 | 15.0% |
| Italian | 466 | 7.8% |
| Korean | 168 | 2.8% |
| Mexican | 601 | 10.1% |
| Mexican American Indian | 50 | 0.8% |
| Native Hawaiian | 13 | 0.2% |
| Norwegian | 108 | 1.8% |
| Paiute | 6 | 0.1% |
| Polish | 99 | 1.7% |
| Portuguese | 49 | 0.8% |
| Puerto Rican | 6 | 0.1% |
| Russian | 3 | 0.1% |
| Salvadoran | 17 | 0.3% |
| Scandinavian | 78 | 1.3% |
| Scotch-Irish | 27 | 0.4% |
| Scottish | 144 | 2.4% |
| Slovene | 14 | 0.2% |
| Spaniard | 24 | 0.4% |
| Spanish | 33 | 0.5% |
| Sri Lankan | 13 | 0.2% |
| Swedish | 114 | 1.9% |
| Swiss | 31 | 0.5% |
| Thai | 13 | 0.2% |
| Tsimshian | 37 | 0.6% |
| Turkish | 11 | 0.2% |
| Welsh | 80 | 1.3% | View All 55 Rows |
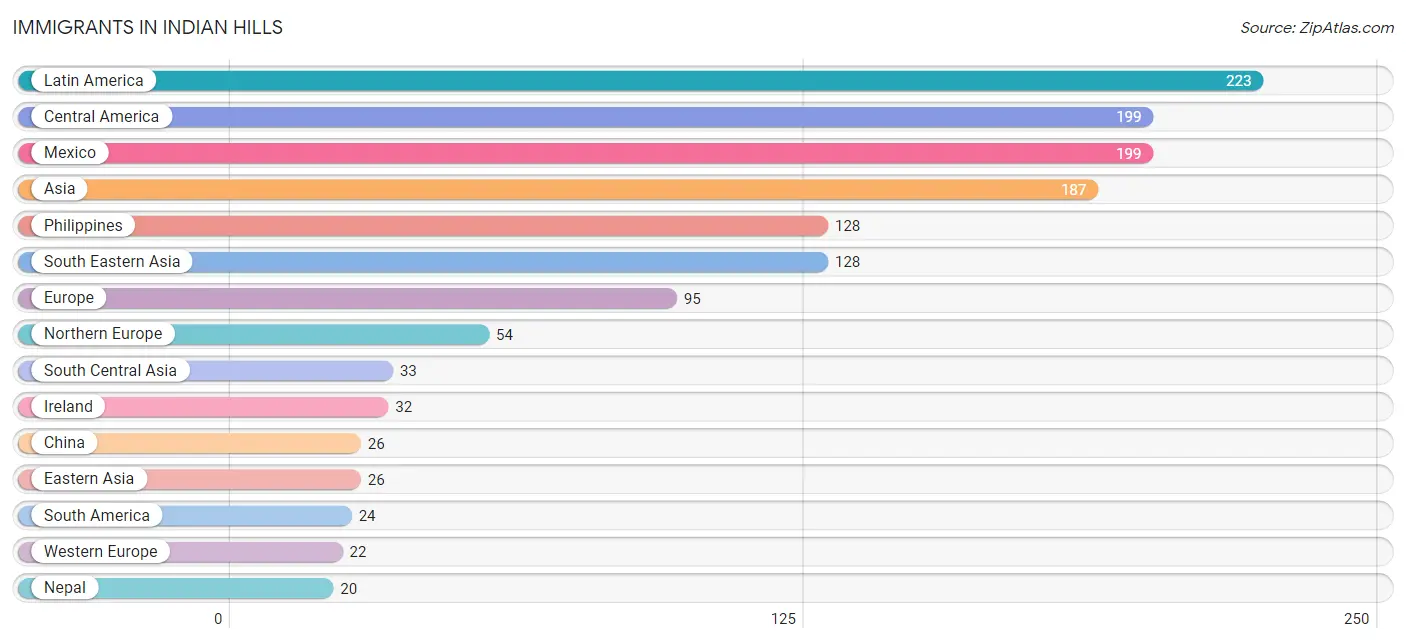
Immigrants in Indian Hills
The most numerous immigrant groups reported in Indian Hills came from Latin America (223 | 3.7%), Central America (199 | 3.3%), Mexico (199 | 3.3%), Asia (187 | 3.1%), and Philippines (128 | 2.1%), together accounting for 15.7% of all Indian Hills residents.
| Immigration Origin | # Population | % Population |
| Asia | 187 | 3.1% |
| Brazil | 6 | 0.1% |
| Canada | 13 | 0.2% |
| Central America | 199 | 3.3% |
| China | 26 | 0.4% |
| Colombia | 5 | 0.1% |
| Eastern Asia | 26 | 0.4% |
| Eastern Europe | 12 | 0.2% |
| England | 11 | 0.2% |
| Europe | 95 | 1.6% |
| Germany | 16 | 0.3% |
| Guyana | 13 | 0.2% |
| Iran | 13 | 0.2% |
| Ireland | 32 | 0.5% |
| Italy | 7 | 0.1% |
| Latin America | 223 | 3.7% |
| Mexico | 199 | 3.3% |
| Nepal | 20 | 0.3% |
| Netherlands | 6 | 0.1% |
| Northern Europe | 54 | 0.9% |
| Norway | 11 | 0.2% |
| Philippines | 128 | 2.1% |
| South America | 24 | 0.4% |
| South Central Asia | 33 | 0.5% |
| South Eastern Asia | 128 | 2.1% |
| Southern Europe | 7 | 0.1% |
| Western Europe | 22 | 0.4% | View All 27 Rows |
Sex and Age in Indian Hills
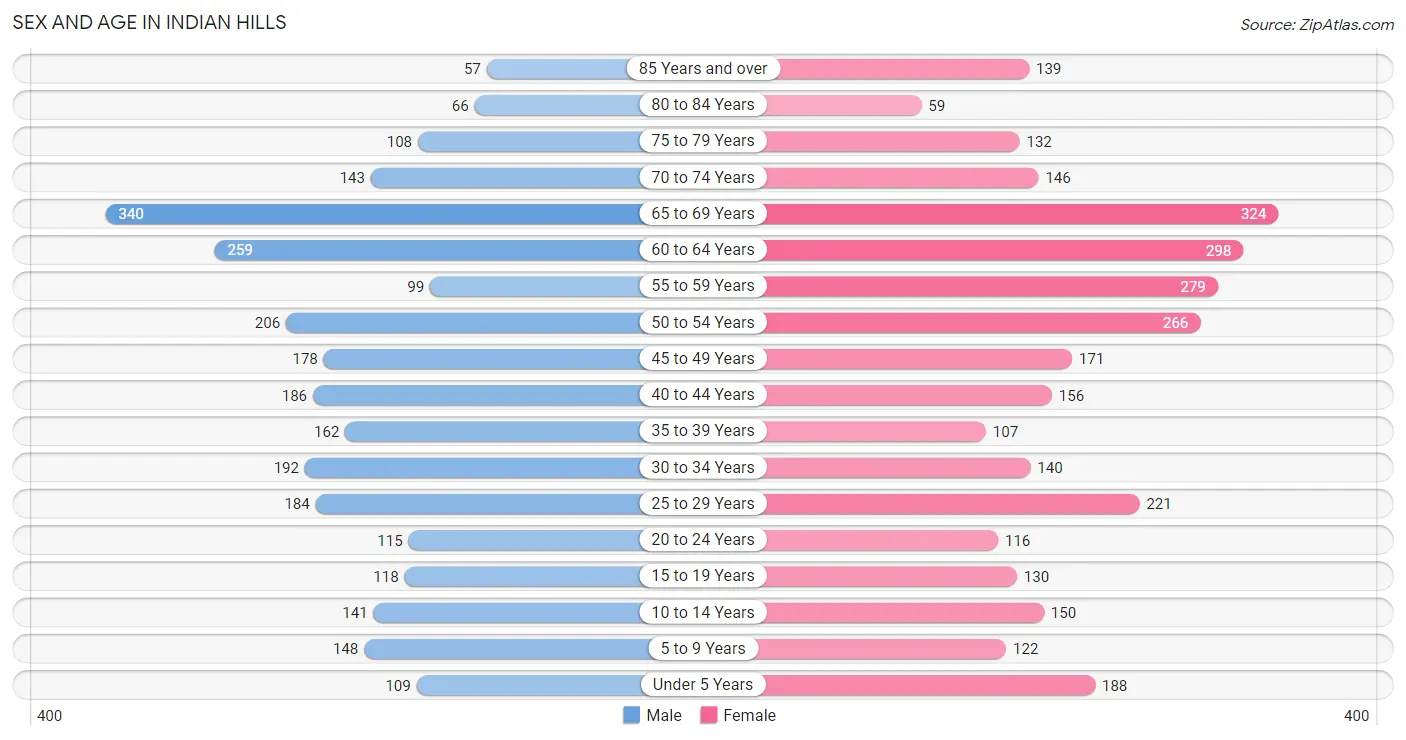
Sex and Age in Indian Hills
The most populous age groups in Indian Hills are 65 to 69 Years (340 | 12.1%) for men and 65 to 69 Years (324 | 10.3%) for women.
| Age Bracket | Male | Female |
| Under 5 Years | 109 (3.9%) | 188 (6.0%) |
| 5 to 9 Years | 148 (5.3%) | 122 (3.9%) |
| 10 to 14 Years | 141 (5.0%) | 150 (4.8%) |
| 15 to 19 Years | 118 (4.2%) | 130 (4.1%) |
| 20 to 24 Years | 115 (4.1%) | 116 (3.7%) |
| 25 to 29 Years | 184 (6.6%) | 221 (7.0%) |
| 30 to 34 Years | 192 (6.8%) | 140 (4.4%) |
| 35 to 39 Years | 162 (5.8%) | 107 (3.4%) |
| 40 to 44 Years | 186 (6.6%) | 156 (5.0%) |
| 45 to 49 Years | 178 (6.3%) | 171 (5.4%) |
| 50 to 54 Years | 206 (7.3%) | 266 (8.5%) |
| 55 to 59 Years | 99 (3.5%) | 279 (8.9%) |
| 60 to 64 Years | 259 (9.2%) | 298 (9.5%) |
| 65 to 69 Years | 340 (12.1%) | 324 (10.3%) |
| 70 to 74 Years | 143 (5.1%) | 146 (4.6%) |
| 75 to 79 Years | 108 (3.8%) | 132 (4.2%) |
| 80 to 84 Years | 66 (2.4%) | 59 (1.9%) |
| 85 Years and over | 57 (2.0%) | 139 (4.4%) |
| Total | 2,811 (100.0%) | 3,144 (100.0%) |
Families and Households in Indian Hills
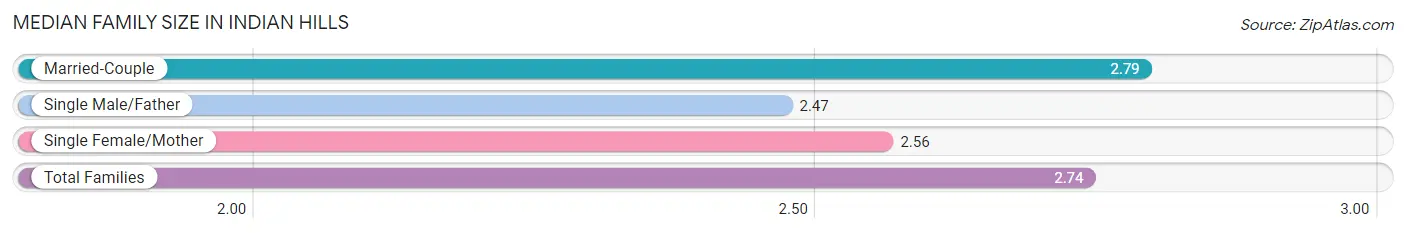
Median Family Size in Indian Hills
The median family size in Indian Hills is 2.74 persons per family, with married-couple families (1,439 | 80.1%) accounting for the largest median family size of 2.79 persons per family. On the other hand, single male/father families (95 | 5.3%) represent the smallest median family size with 2.47 persons per family.
| Family Type | # Families | Family Size |
| Married-Couple | 1,439 (80.1%) | 2.79 |
| Single Male/Father | 95 (5.3%) | 2.47 |
| Single Female/Mother | 262 (14.6%) | 2.56 |
| Total Families | 1,796 (100.0%) | 2.74 |
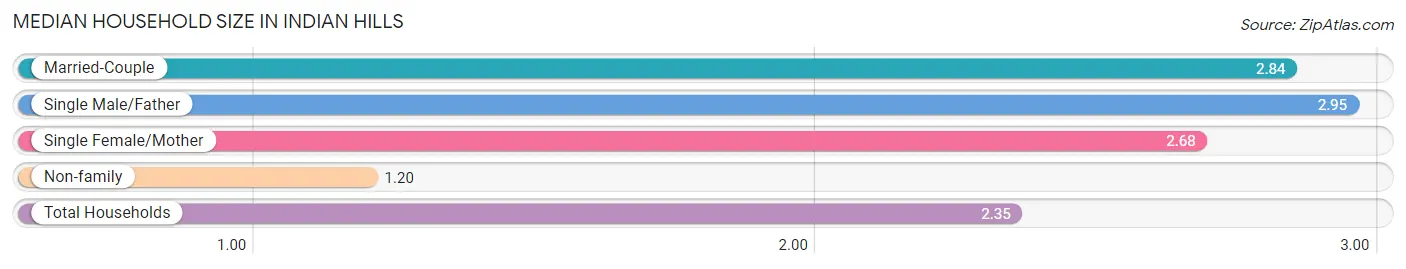
Median Household Size in Indian Hills
The median household size in Indian Hills is 2.35 persons per household, with single male/father households (95 | 3.7%) accounting for the largest median household size of 2.95 persons per household. non-family households (735 | 29.0%) represent the smallest median household size with 1.20 persons per household.
| Household Type | # Households | Household Size |
| Married-Couple | 1,439 (56.9%) | 2.84 |
| Single Male/Father | 95 (3.7%) | 2.95 |
| Single Female/Mother | 262 (10.3%) | 2.68 |
| Non-family | 735 (29.0%) | 1.20 |
| Total Households | 2,531 (100.0%) | 2.35 |
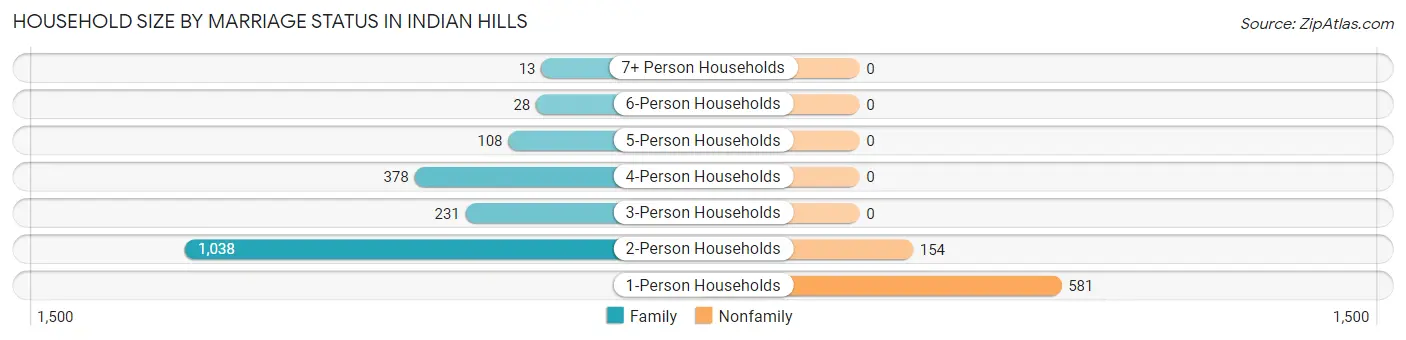
Household Size by Marriage Status in Indian Hills
Out of a total of 2,531 households in Indian Hills, 1,796 (71.0%) are family households, while 735 (29.0%) are nonfamily households. The most numerous type of family households are 2-person households, comprising 1,038, and the most common type of nonfamily households are 1-person households, comprising 581.
| Household Size | Family Households | Nonfamily Households |
| 1-Person Households | - | 581 (23.0%) |
| 2-Person Households | 1,038 (41.0%) | 154 (6.1%) |
| 3-Person Households | 231 (9.1%) | 0 (0.0%) |
| 4-Person Households | 378 (14.9%) | 0 (0.0%) |
| 5-Person Households | 108 (4.3%) | 0 (0.0%) |
| 6-Person Households | 28 (1.1%) | 0 (0.0%) |
| 7+ Person Households | 13 (0.5%) | 0 (0.0%) |
| Total | 1,796 (71.0%) | 735 (29.0%) |
Female Fertility in Indian Hills
Fertility by Age in Indian Hills
Average fertility rate in Indian Hills is 59.0 births per 1,000 women. Women in the age bracket of 20 to 34 years have the highest fertility rate with 94.0 births per 1,000 women. Women in the age bracket of 20 to 34 years acount for 72.6% of all women with births.
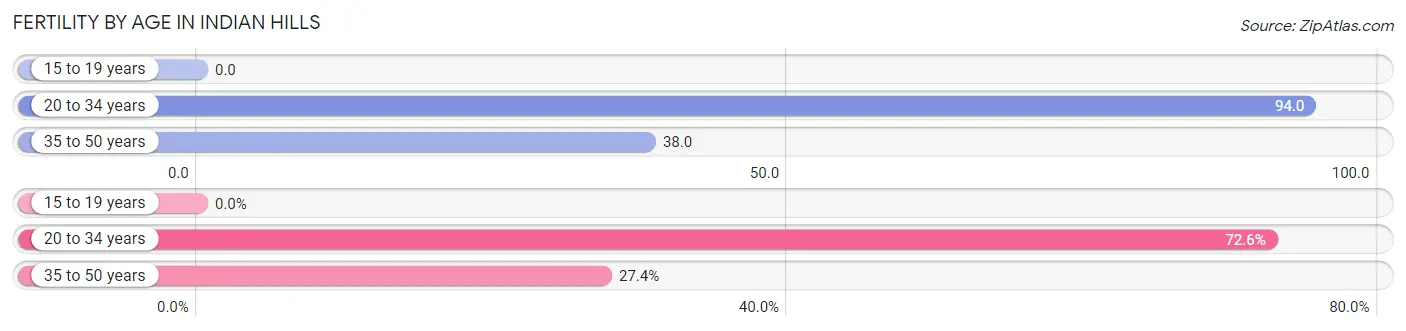
| Age Bracket | Women with Births | Births / 1,000 Women |
| 15 to 19 years | 0 (0.0%) | 0.0 |
| 20 to 34 years | 45 (72.6%) | 94.0 |
| 35 to 50 years | 17 (27.4%) | 38.0 |
| Total | 62 (100.0%) | 59.0 |
Fertility by Age by Marriage Status in Indian Hills
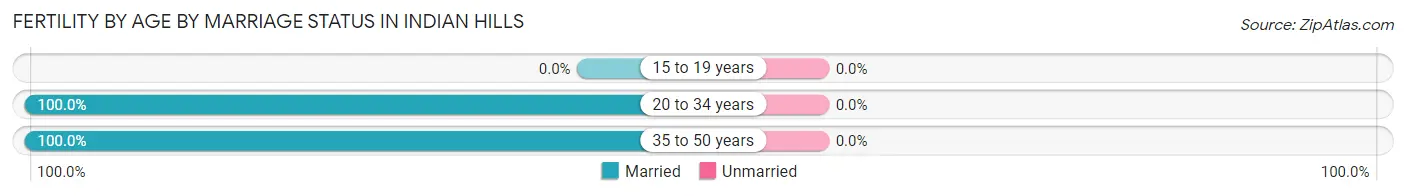
| Age Bracket | Married | Unmarried |
| 15 to 19 years | 0 (0.0%) | 0 (0.0%) |
| 20 to 34 years | 45 (100.0%) | 0 (0.0%) |
| 35 to 50 years | 17 (100.0%) | 0 (0.0%) |
| Total | 62 (100.0%) | 0 (0.0%) |
Fertility by Education in Indian Hills
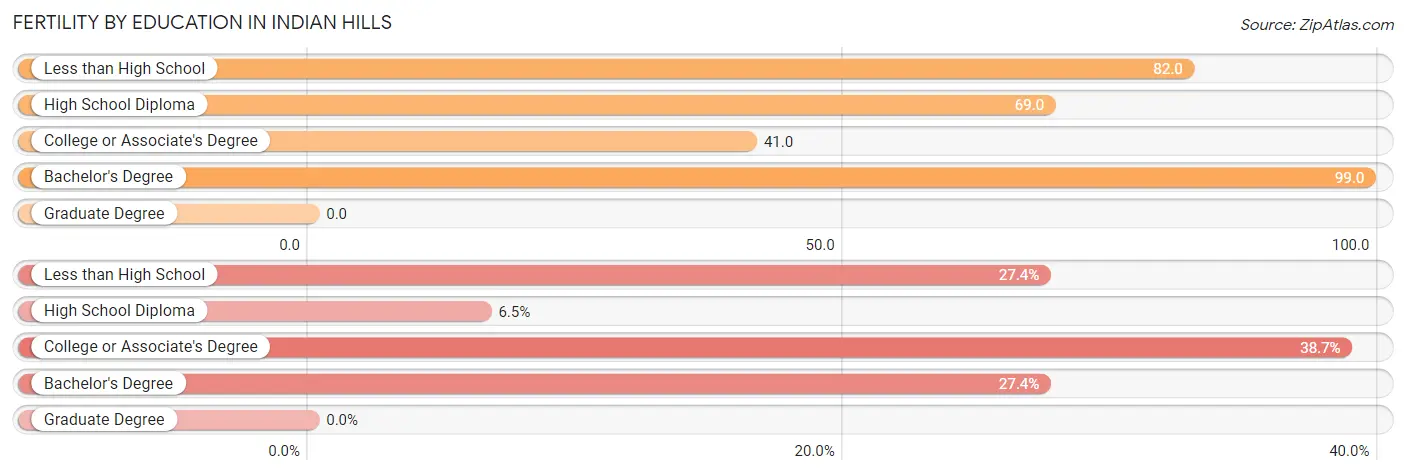
| Educational Attainment | Women with Births | Births / 1,000 Women |
| Less than High School | 17 (27.4%) | 82.0 |
| High School Diploma | 4 (6.5%) | 69.0 |
| College or Associate's Degree | 24 (38.7%) | 41.0 |
| Bachelor's Degree | 17 (27.4%) | 99.0 |
| Graduate Degree | 0 (0.0%) | 0.0 |
| Total | 62 (100.0%) | 59.0 |
Fertility by Education by Marriage Status in Indian Hills
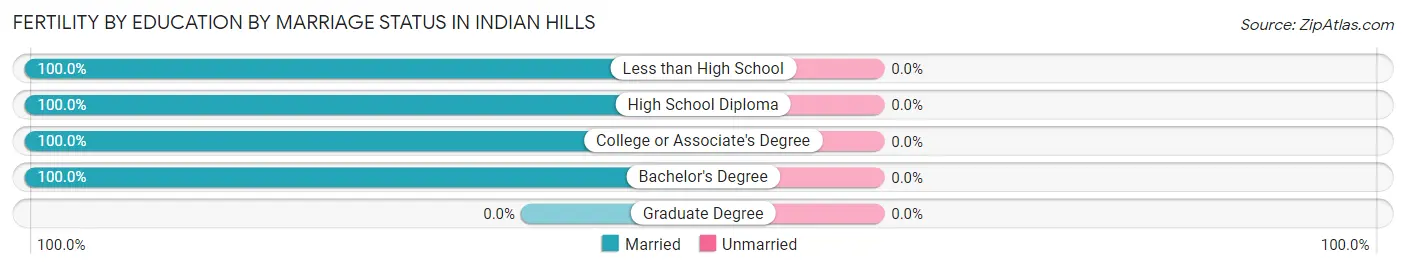
| Educational Attainment | Married | Unmarried |
| Less than High School | 17 (100.0%) | 0 (0.0%) |
| High School Diploma | 4 (100.0%) | 0 (0.0%) |
| College or Associate's Degree | 24 (100.0%) | 0 (0.0%) |
| Bachelor's Degree | 17 (100.0%) | 0 (0.0%) |
| Graduate Degree | 0 (0.0%) | 0 (0.0%) |
| Total | 62 (100.0%) | 0 (0.0%) |
Income in Indian Hills
Income Overview in Indian Hills
Per Capita Income in Indian Hills is $40,502, while median incomes of families and households are $91,304 and $77,256 respectively.
| Characteristic | Number | Measure |
| Per Capita Income | 5,955 | $40,502 |
| Median Family Income | 1,796 | $91,304 |
| Mean Family Income | 1,796 | $105,170 |
| Median Household Income | 2,531 | $77,256 |
| Mean Household Income | 2,531 | $95,847 |
| Income Deficit | 1,796 | $9,773 |
| Wage / Income Gap (%) | 5,955 | 21.32% |
| Wage / Income Gap ($) | 5,955 | 78.68¢ per $1 |
| Gini / Inequality Index | 5,955 | 0.38 |
Earnings by Sex in Indian Hills
Average Earnings in Indian Hills are $48,416, $53,329 for men and $41,957 for women, a difference of 21.3%.
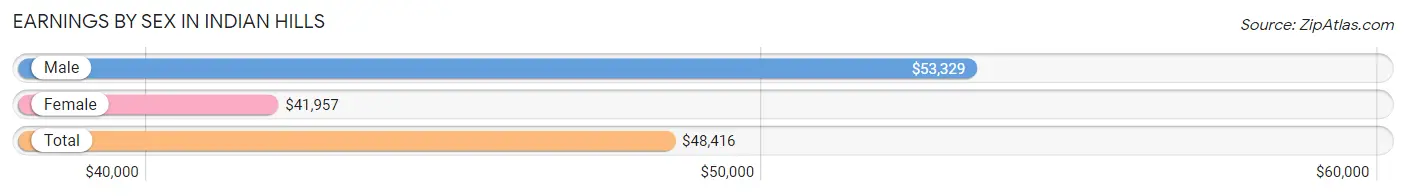
| Sex | Number | Average Earnings |
| Male | 1,557 (48.0%) | $53,329 |
| Female | 1,687 (52.0%) | $41,957 |
| Total | 3,244 (100.0%) | $48,416 |
Earnings by Sex by Income Bracket in Indian Hills
The most common earnings brackets in Indian Hills are $100,000+ for men (243 | 15.6%) and $65,000 to $74,999 for women (187 | 11.1%).
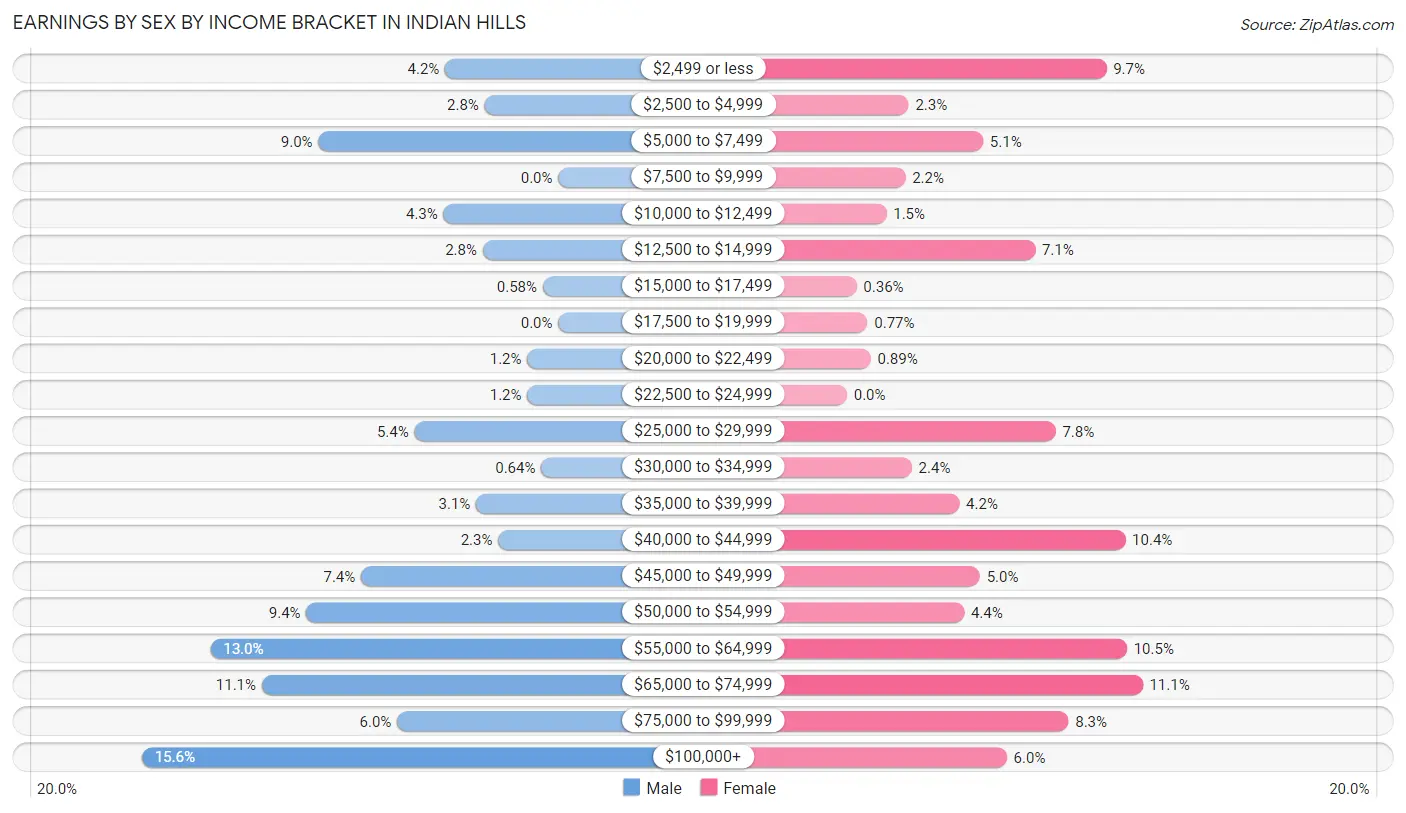
| Income | Male | Female |
| $2,499 or less | 66 (4.2%) | 164 (9.7%) |
| $2,500 to $4,999 | 43 (2.8%) | 39 (2.3%) |
| $5,000 to $7,499 | 140 (9.0%) | 86 (5.1%) |
| $7,500 to $9,999 | 0 (0.0%) | 37 (2.2%) |
| $10,000 to $12,499 | 67 (4.3%) | 25 (1.5%) |
| $12,500 to $14,999 | 44 (2.8%) | 119 (7.0%) |
| $15,000 to $17,499 | 9 (0.6%) | 6 (0.4%) |
| $17,500 to $19,999 | 0 (0.0%) | 13 (0.8%) |
| $20,000 to $22,499 | 18 (1.2%) | 15 (0.9%) |
| $22,500 to $24,999 | 18 (1.2%) | 0 (0.0%) |
| $25,000 to $29,999 | 84 (5.4%) | 132 (7.8%) |
| $30,000 to $34,999 | 10 (0.6%) | 41 (2.4%) |
| $35,000 to $39,999 | 48 (3.1%) | 71 (4.2%) |
| $40,000 to $44,999 | 35 (2.2%) | 176 (10.4%) |
| $45,000 to $49,999 | 115 (7.4%) | 84 (5.0%) |
| $50,000 to $54,999 | 147 (9.4%) | 74 (4.4%) |
| $55,000 to $64,999 | 203 (13.0%) | 177 (10.5%) |
| $65,000 to $74,999 | 173 (11.1%) | 187 (11.1%) |
| $75,000 to $99,999 | 94 (6.0%) | 140 (8.3%) |
| $100,000+ | 243 (15.6%) | 101 (6.0%) |
| Total | 1,557 (100.0%) | 1,687 (100.0%) |
Earnings by Sex by Educational Attainment in Indian Hills
Average earnings in Indian Hills are $54,401 for men and $45,313 for women, a difference of 16.7%. Men with an educational attainment of graduate degree enjoy the highest average annual earnings of $101,023, while those with high school diploma education earn the least with $43,600. Women with an educational attainment of graduate degree earn the most with the average annual earnings of $56,563, while those with high school diploma education have the smallest earnings of $39,250.
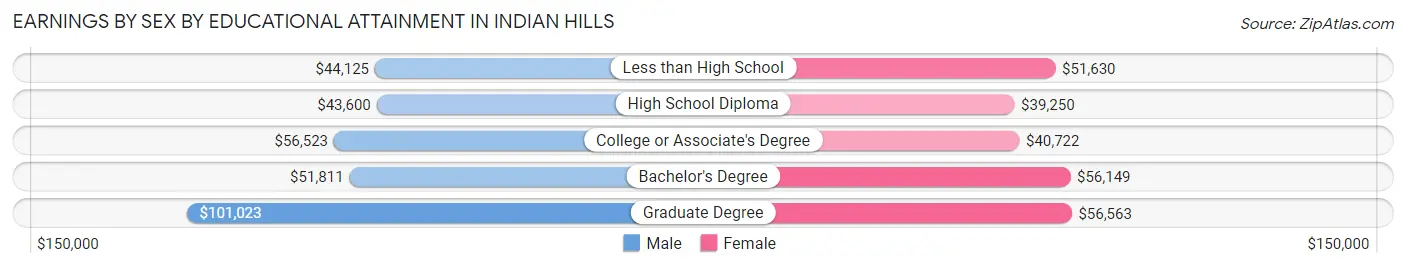
| Educational Attainment | Male Income | Female Income |
| Less than High School | $44,125 | $51,630 |
| High School Diploma | $43,600 | $39,250 |
| College or Associate's Degree | $56,523 | $40,722 |
| Bachelor's Degree | $51,811 | $56,149 |
| Graduate Degree | $101,023 | $56,563 |
| Total | $54,401 | $45,313 |
Family Income in Indian Hills
Family Income Brackets in Indian Hills
According to the Indian Hills family income data, there are 471 families falling into the $100,000 to $149,999 income range, which is the most common income bracket and makes up 26.2% of all families. Conversely, the less than $10,000 income bracket is the least frequent group with only 32 families (1.8%) belonging to this category.
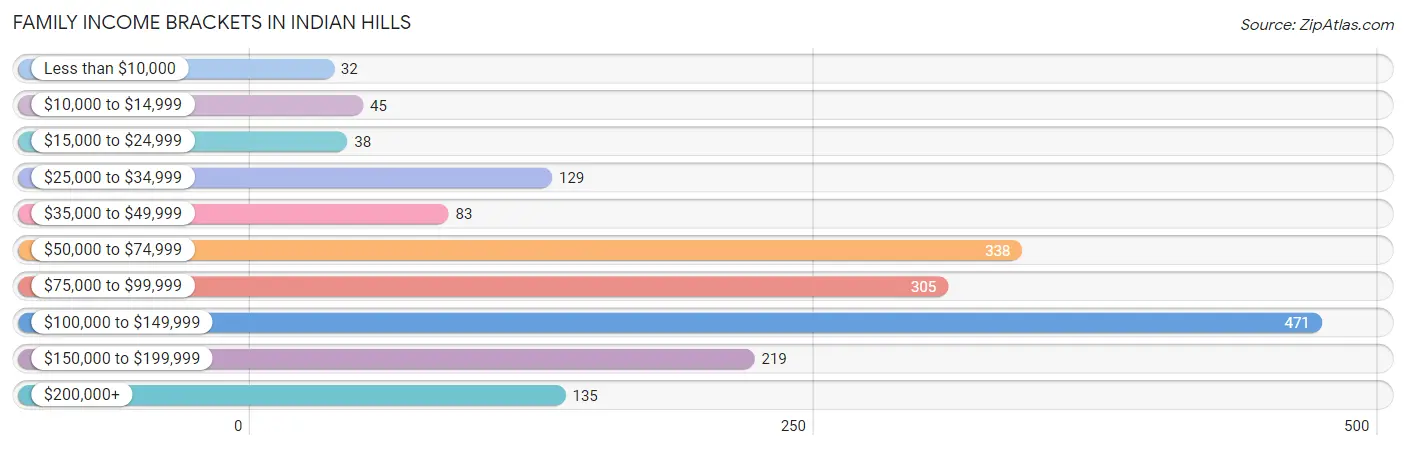
| Income Bracket | # Families | % Families |
| Less than $10,000 | 32 | 1.8% |
| $10,000 to $14,999 | 45 | 2.5% |
| $15,000 to $24,999 | 38 | 2.1% |
| $25,000 to $34,999 | 129 | 7.2% |
| $35,000 to $49,999 | 83 | 4.6% |
| $50,000 to $74,999 | 338 | 18.8% |
| $75,000 to $99,999 | 305 | 17.0% |
| $100,000 to $149,999 | 471 | 26.2% |
| $150,000 to $199,999 | 219 | 12.2% |
| $200,000+ | 135 | 7.5% |
Family Income by Famaliy Size in Indian Hills
4-person families (385 | 21.4%) account for the highest median family income in Indian Hills with $137,750 per family, while 2-person families (1,071 | 59.6%) have the highest median income of $38,238 per family member.
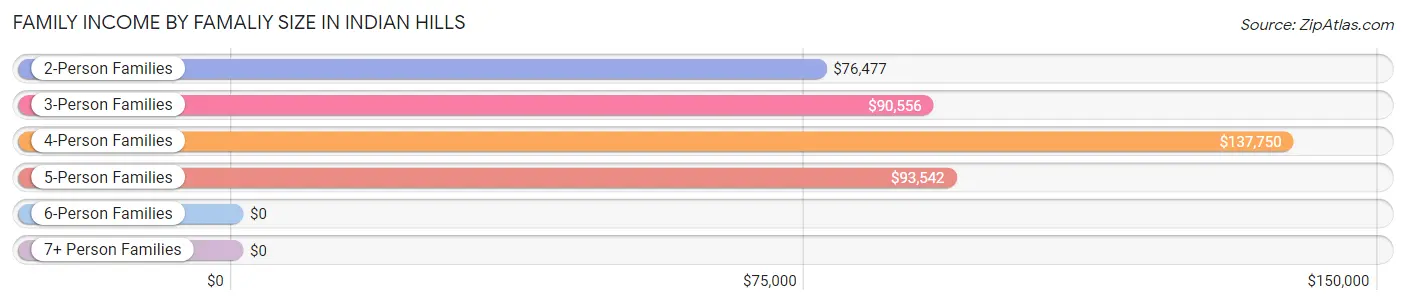
| Income Bracket | # Families | Median Income |
| 2-Person Families | 1,071 (59.6%) | $76,477 |
| 3-Person Families | 246 (13.7%) | $90,556 |
| 4-Person Families | 385 (21.4%) | $137,750 |
| 5-Person Families | 63 (3.5%) | $93,542 |
| 6-Person Families | 31 (1.7%) | $0 |
| 7+ Person Families | 0 (0.0%) | $0 |
| Total | 1,796 (100.0%) | $91,304 |
Family Income by Number of Earners in Indian Hills
The median family income in Indian Hills is $91,304, with families comprising 3+ earners (259) having the highest median family income of $160,393, while families with no earners (295) have the lowest median family income of $64,911, accounting for 14.4% and 16.4% of families, respectively.
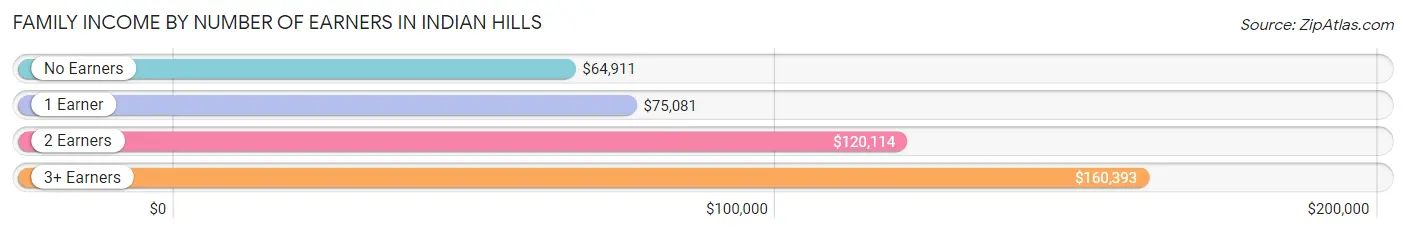
| Number of Earners | # Families | Median Income |
| No Earners | 295 (16.4%) | $64,911 |
| 1 Earner | 717 (39.9%) | $75,081 |
| 2 Earners | 525 (29.2%) | $120,114 |
| 3+ Earners | 259 (14.4%) | $160,393 |
| Total | 1,796 (100.0%) | $91,304 |
Household Income in Indian Hills
Household Income Brackets in Indian Hills
With 524 households falling in the category, the $100,000 to $149,999 income range is the most frequent in Indian Hills, accounting for 20.7% of all households. In contrast, only 56 households (2.2%) fall into the less than $10,000 income bracket, making it the least populous group.
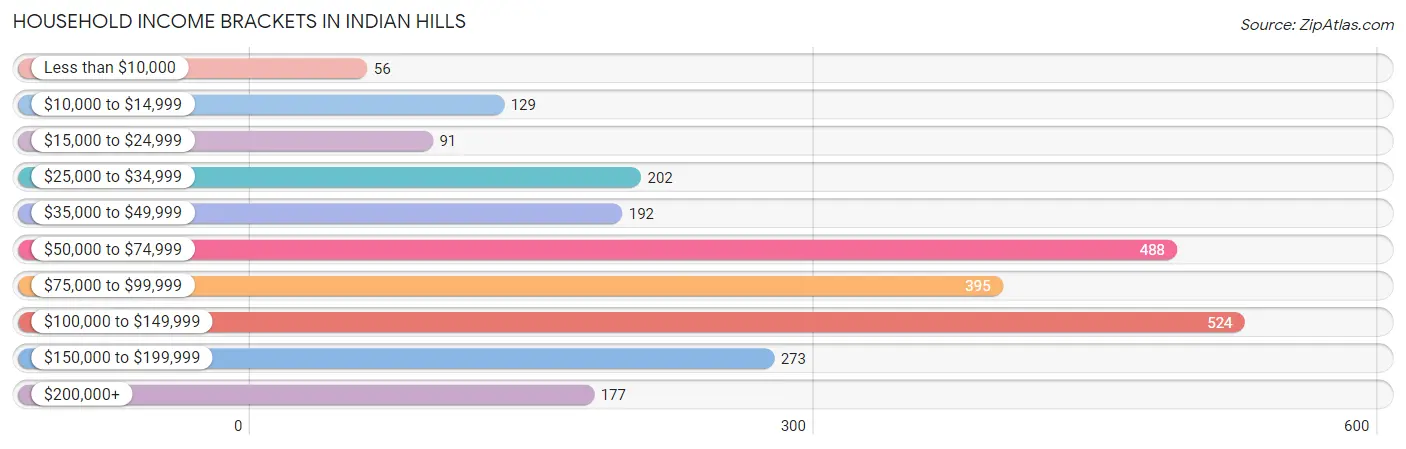
| Income Bracket | # Households | % Households |
| Less than $10,000 | 56 | 2.2% |
| $10,000 to $14,999 | 129 | 5.1% |
| $15,000 to $24,999 | 91 | 3.6% |
| $25,000 to $34,999 | 202 | 8.0% |
| $35,000 to $49,999 | 192 | 7.6% |
| $50,000 to $74,999 | 488 | 19.3% |
| $75,000 to $99,999 | 395 | 15.6% |
| $100,000 to $149,999 | 524 | 20.7% |
| $150,000 to $199,999 | 273 | 10.8% |
| $200,000+ | 177 | 7.0% |
Household Income by Householder Age in Indian Hills
The median household income in Indian Hills is $77,256, with the highest median household income of $110,296 found in the 45 to 64 years age bracket for the primary householder. A total of 921 households (36.4%) fall into this category.
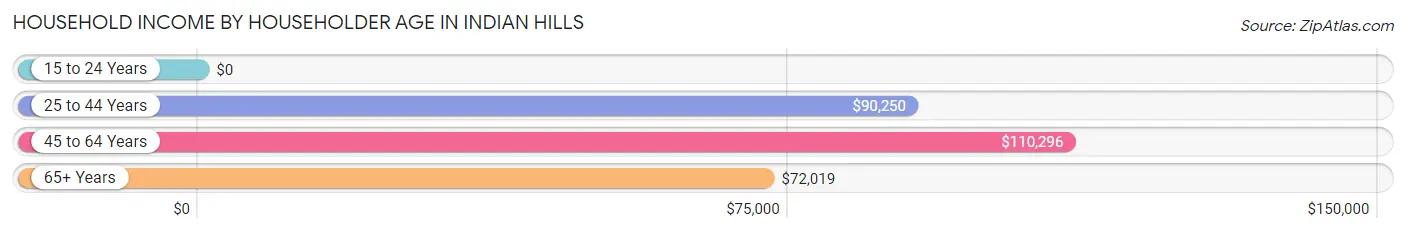
| Income Bracket | # Households | Median Income |
| 15 to 24 Years | 0 (0.0%) | $0 |
| 25 to 44 Years | 663 (26.2%) | $90,250 |
| 45 to 64 Years | 921 (36.4%) | $110,296 |
| 65+ Years | 947 (37.4%) | $72,019 |
| Total | 2,531 (100.0%) | $77,256 |
Poverty in Indian Hills
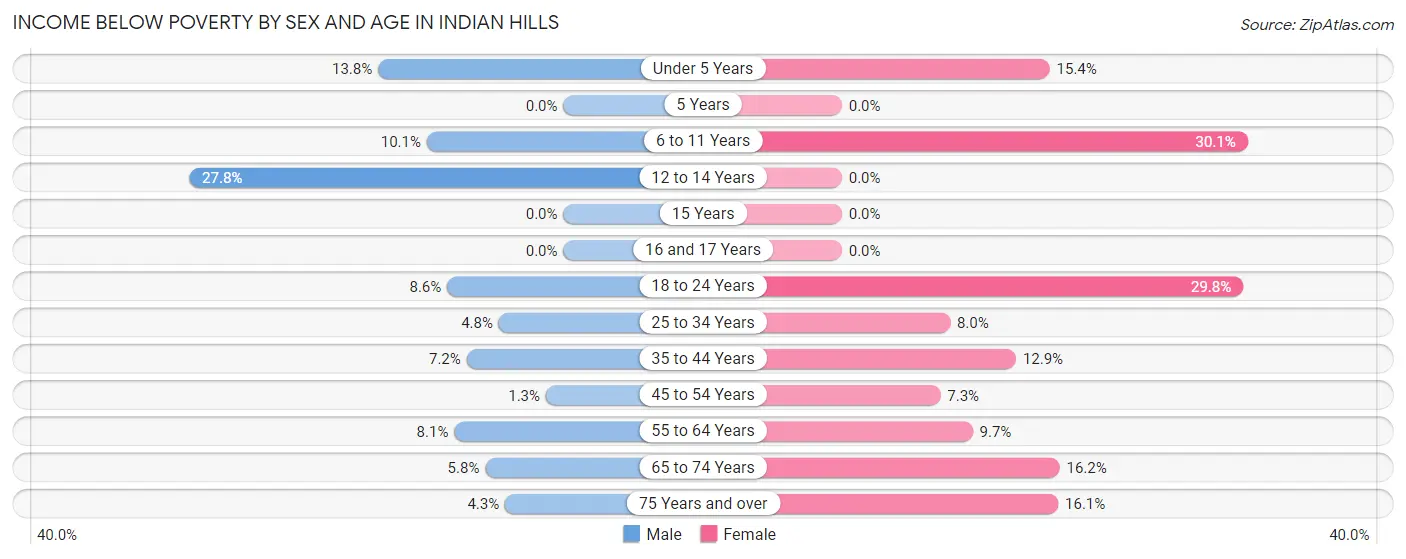
Income Below Poverty by Sex and Age in Indian Hills
With 6.5% poverty level for males and 12.7% for females among the residents of Indian Hills, 12 to 14 year old males and 6 to 11 year old females are the most vulnerable to poverty, with 20 males (27.8%) and 47 females (30.1%) in their respective age groups living below the poverty level.
| Age Bracket | Male | Female |
| Under 5 Years | 15 (13.8%) | 29 (15.4%) |
| 5 Years | 0 (0.0%) | 0 (0.0%) |
| 6 to 11 Years | 21 (10.1%) | 47 (30.1%) |
| 12 to 14 Years | 20 (27.8%) | 0 (0.0%) |
| 15 Years | 0 (0.0%) | 0 (0.0%) |
| 16 and 17 Years | 0 (0.0%) | 0 (0.0%) |
| 18 to 24 Years | 12 (8.6%) | 42 (29.8%) |
| 25 to 34 Years | 18 (4.8%) | 29 (8.0%) |
| 35 to 44 Years | 25 (7.2%) | 34 (12.9%) |
| 45 to 54 Years | 5 (1.3%) | 32 (7.3%) |
| 55 to 64 Years | 29 (8.1%) | 56 (9.7%) |
| 65 to 74 Years | 28 (5.8%) | 76 (16.2%) |
| 75 Years and over | 10 (4.3%) | 53 (16.1%) |
| Total | 183 (6.5%) | 398 (12.7%) |
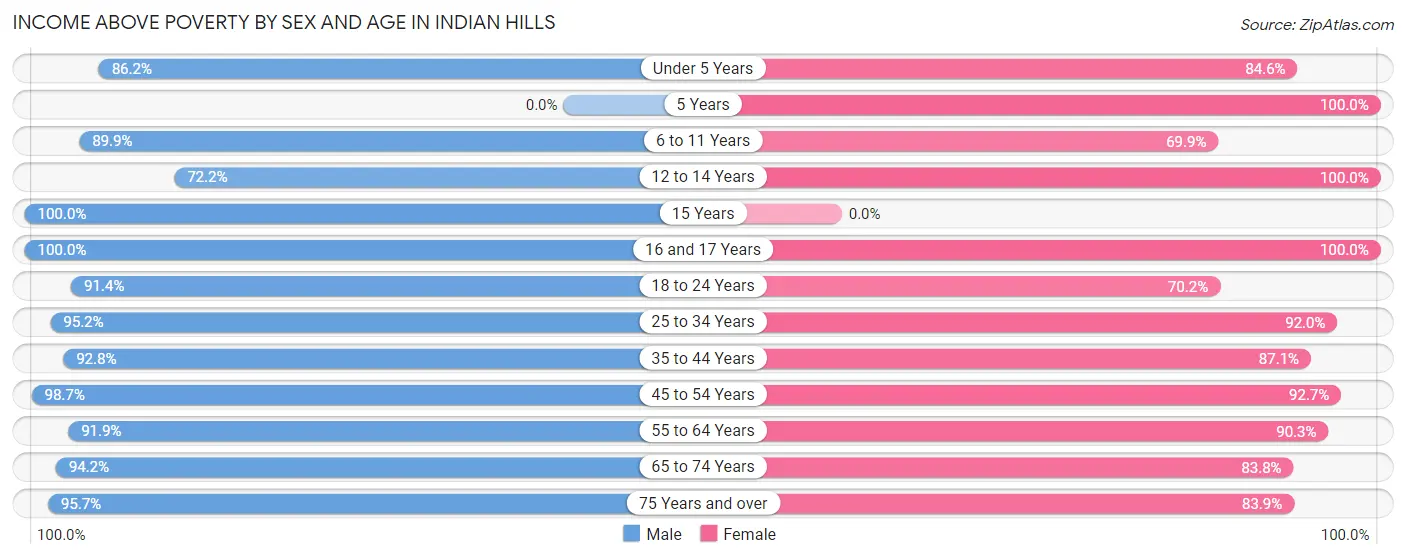
Income Above Poverty by Sex and Age in Indian Hills
According to the poverty statistics in Indian Hills, males aged 15 years and females aged 5 years are the age groups that are most secure financially, with 100.0% of males and 100.0% of females in these age groups living above the poverty line.
| Age Bracket | Male | Female |
| Under 5 Years | 94 (86.2%) | 159 (84.6%) |
| 5 Years | 0 (0.0%) | 53 (100.0%) |
| 6 to 11 Years | 186 (89.9%) | 109 (69.9%) |
| 12 to 14 Years | 52 (72.2%) | 61 (100.0%) |
| 15 Years | 38 (100.0%) | 0 (0.0%) |
| 16 and 17 Years | 56 (100.0%) | 102 (100.0%) |
| 18 to 24 Years | 127 (91.4%) | 99 (70.2%) |
| 25 to 34 Years | 358 (95.2%) | 332 (92.0%) |
| 35 to 44 Years | 323 (92.8%) | 229 (87.1%) |
| 45 to 54 Years | 379 (98.7%) | 405 (92.7%) |
| 55 to 64 Years | 329 (91.9%) | 521 (90.3%) |
| 65 to 74 Years | 455 (94.2%) | 394 (83.8%) |
| 75 Years and over | 221 (95.7%) | 277 (83.9%) |
| Total | 2,618 (93.5%) | 2,741 (87.3%) |
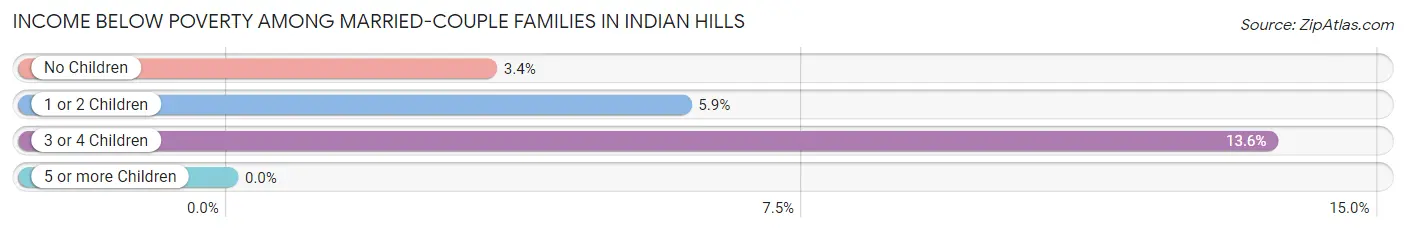
Income Below Poverty Among Married-Couple Families in Indian Hills
The poverty statistics for married-couple families in Indian Hills show that 4.5% or 65 of the total 1,439 families live below the poverty line. Families with 3 or 4 children have the highest poverty rate of 13.6%, comprising of 11 families. On the other hand, families with no children have the lowest poverty rate of 3.4%, which includes 35 families.
| Children | Above Poverty | Below Poverty |
| No Children | 1,002 (96.6%) | 35 (3.4%) |
| 1 or 2 Children | 302 (94.1%) | 19 (5.9%) |
| 3 or 4 Children | 70 (86.4%) | 11 (13.6%) |
| 5 or more Children | 0 (0.0%) | 0 (0.0%) |
| Total | 1,374 (95.5%) | 65 (4.5%) |
Income Below Poverty Among Single-Parent Households in Indian Hills
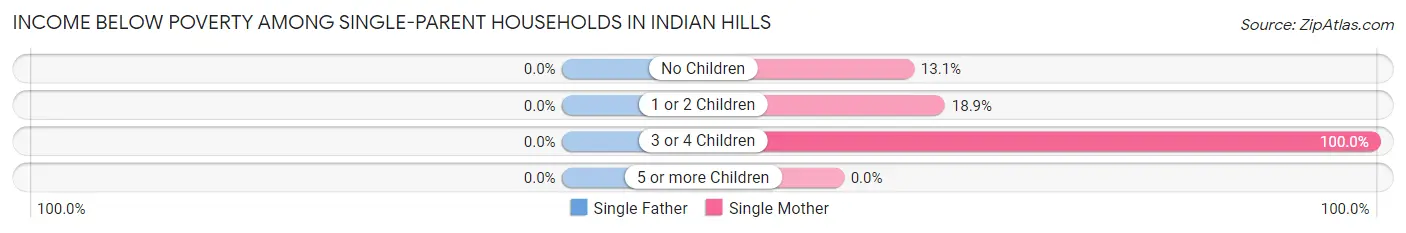
| Children | Single Father | Single Mother |
| No Children | 0 (0.0%) | 17 (13.1%) |
| 1 or 2 Children | 0 (0.0%) | 23 (18.9%) |
| 3 or 4 Children | 0 (0.0%) | 10 (100.0%) |
| 5 or more Children | 0 (0.0%) | 0 (0.0%) |
| Total | 0 (0.0%) | 50 (19.1%) |
Income Below Poverty Among Married-Couple vs Single-Parent Households in Indian Hills
The poverty data for Indian Hills shows that 65 of the married-couple family households (4.5%) and 50 of the single-parent households (14.0%) are living below the poverty level. Within the married-couple family households, those with 3 or 4 children have the highest poverty rate, with 11 households (13.6%) falling below the poverty line. Among the single-parent households, those with 3 or 4 children have the highest poverty rate, with 10 household (100.0%) living below poverty.
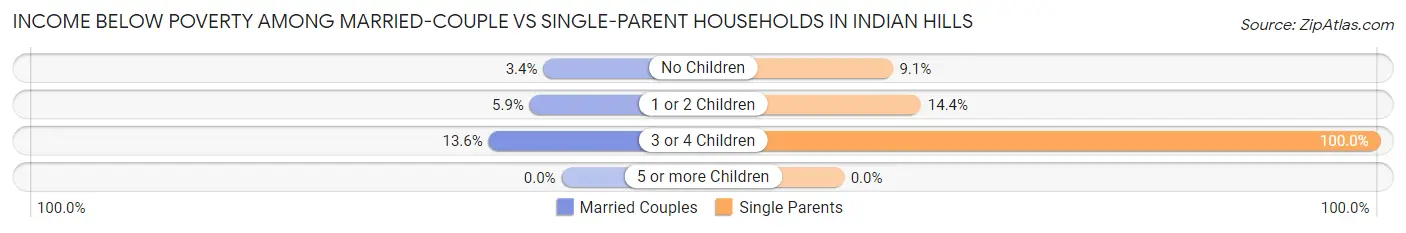
| Children | Married-Couple Families | Single-Parent Households |
| No Children | 35 (3.4%) | 17 (9.1%) |
| 1 or 2 Children | 19 (5.9%) | 23 (14.4%) |
| 3 or 4 Children | 11 (13.6%) | 10 (100.0%) |
| 5 or more Children | 0 (0.0%) | 0 (0.0%) |
| Total | 65 (4.5%) | 50 (14.0%) |
Employment Characteristics in Indian Hills
Employment by Class of Employer in Indian Hills
Among the 2,814 employed individuals in Indian Hills, private company employees (1,786 | 63.5%), local government employees (311 | 11.1%), and state government employees (284 | 10.1%) make up the most common classes of employment.
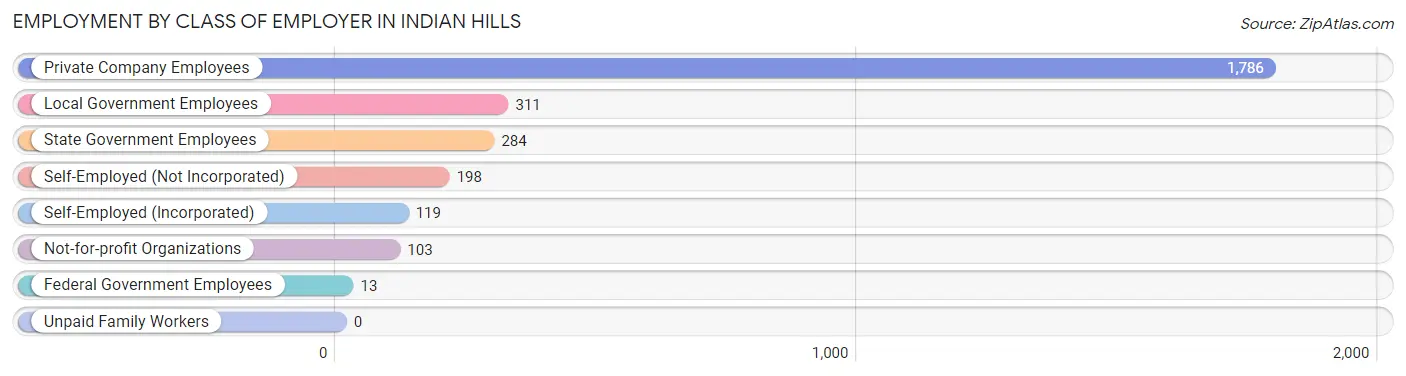
| Employer Class | # Employees | % Employees |
| Private Company Employees | 1,786 | 63.5% |
| Self-Employed (Incorporated) | 119 | 4.2% |
| Self-Employed (Not Incorporated) | 198 | 7.0% |
| Not-for-profit Organizations | 103 | 3.7% |
| Local Government Employees | 311 | 11.1% |
| State Government Employees | 284 | 10.1% |
| Federal Government Employees | 13 | 0.5% |
| Unpaid Family Workers | 0 | 0.0% |
| Total | 2,814 | 100.0% |
Employment Status by Age in Indian Hills
According to the labor force statistics for Indian Hills, out of the total population over 16 years of age (5,059), 58.6% or 2,965 individuals are in the labor force, with 2.5% or 74 of them unemployed. The age group with the highest labor force participation rate is 25 to 29 years, with 94.8% or 384 individuals in the labor force. Within the labor force, the 16 to 19 years age range has the highest percentage of unemployed individuals, with 12.4% or 14 of them being unemployed.
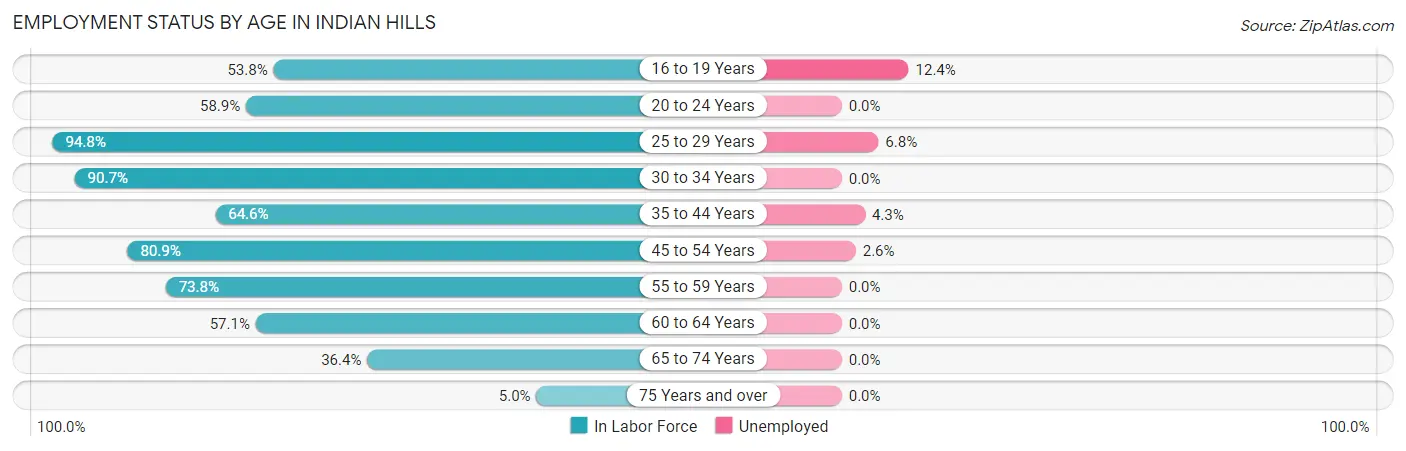
| Age Bracket | In Labor Force | Unemployed |
| 16 to 19 Years | 113 (53.8%) | 14 (12.4%) |
| 20 to 24 Years | 136 (58.9%) | 0 (0.0%) |
| 25 to 29 Years | 384 (94.8%) | 26 (6.8%) |
| 30 to 34 Years | 301 (90.7%) | 0 (0.0%) |
| 35 to 44 Years | 395 (64.6%) | 17 (4.3%) |
| 45 to 54 Years | 664 (80.9%) | 17 (2.6%) |
| 55 to 59 Years | 279 (73.8%) | 0 (0.0%) |
| 60 to 64 Years | 318 (57.1%) | 0 (0.0%) |
| 65 to 74 Years | 347 (36.4%) | 0 (0.0%) |
| 75 Years and over | 28 (5.0%) | 0 (0.0%) |
| Total | 2,965 (58.6%) | 74 (2.5%) |
Employment Status by Educational Attainment in Indian Hills
According to labor force statistics for Indian Hills, 75.4% of individuals (2,340) out of the total population between 25 and 64 years of age (3,104) are in the labor force, with 2.6% or 61 of them being unemployed. The group with the highest labor force participation rate are those with the educational attainment of bachelor's degree or higher, with 91.8% or 773 individuals in the labor force. Within the labor force, individuals with less than high school education have the highest percentage of unemployment, with 6.1% or 10 of them being unemployed.
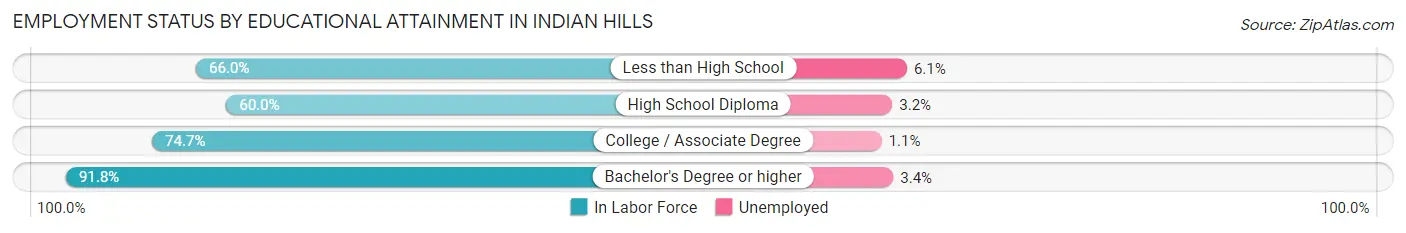
| Educational Attainment | In Labor Force | Unemployed |
| Less than High School | 165 (66.0%) | 15 (6.1%) |
| High School Diploma | 406 (60.0%) | 22 (3.2%) |
| College / Associate Degree | 997 (74.7%) | 15 (1.1%) |
| Bachelor's Degree or higher | 773 (91.8%) | 29 (3.4%) |
| Total | 2,340 (75.4%) | 81 (2.6%) |
Employment Occupations by Sex in Indian Hills
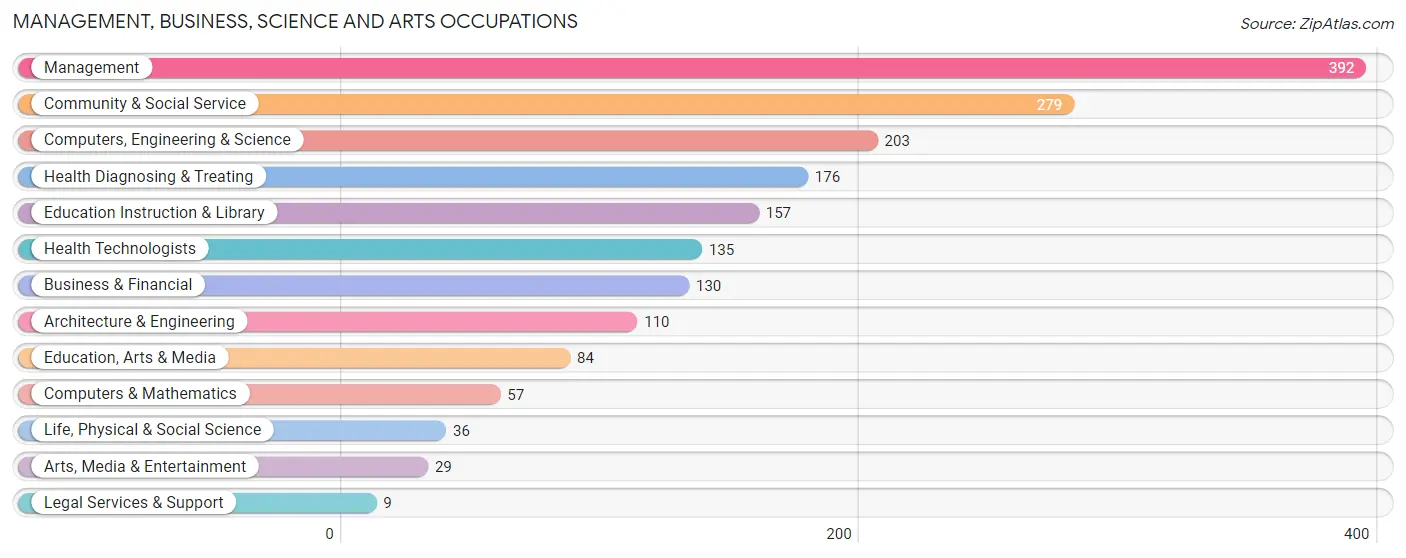
Management, Business, Science and Arts Occupations
The most common Management, Business, Science and Arts occupations in Indian Hills are Management (392 | 13.6%), Community & Social Service (279 | 9.7%), Computers, Engineering & Science (203 | 7.0%), Health Diagnosing & Treating (176 | 6.1%), and Education Instruction & Library (157 | 5.4%).
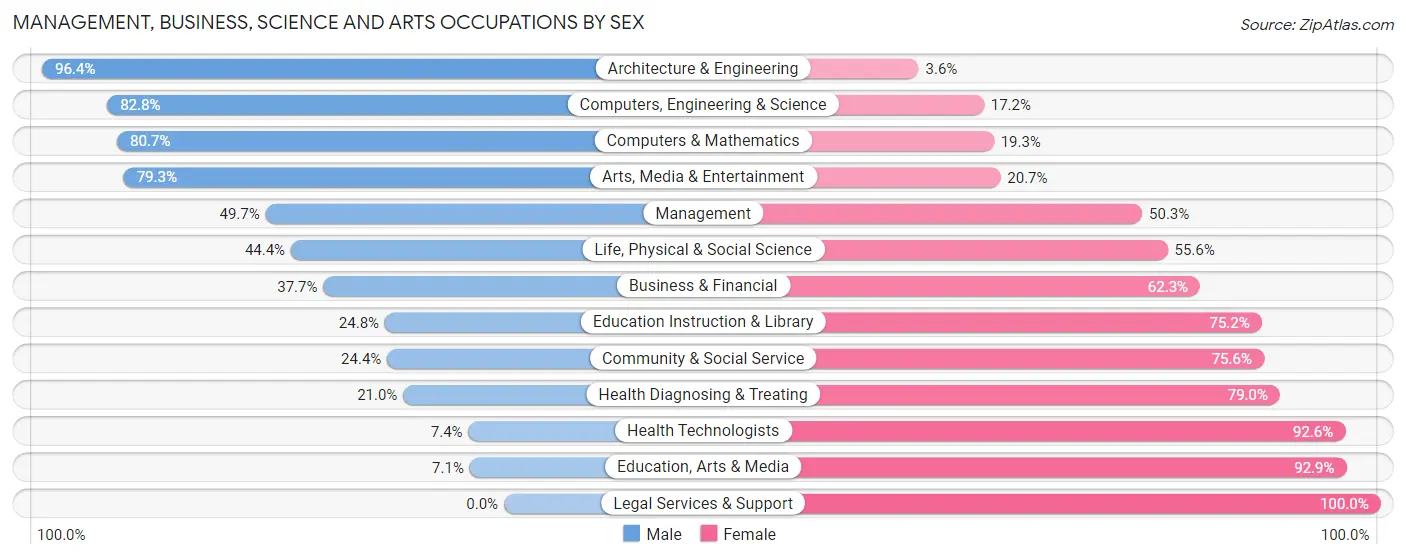
Management, Business, Science and Arts Occupations by Sex
Within the Management, Business, Science and Arts occupations in Indian Hills, the most male-oriented occupations are Architecture & Engineering (96.4%), Computers, Engineering & Science (82.8%), and Computers & Mathematics (80.7%), while the most female-oriented occupations are Legal Services & Support (100.0%), Education, Arts & Media (92.9%), and Health Technologists (92.6%).
| Occupation | Male | Female |
| Management | 195 (49.7%) | 197 (50.3%) |
| Business & Financial | 49 (37.7%) | 81 (62.3%) |
| Computers, Engineering & Science | 168 (82.8%) | 35 (17.2%) |
| Computers & Mathematics | 46 (80.7%) | 11 (19.3%) |
| Architecture & Engineering | 106 (96.4%) | 4 (3.6%) |
| Life, Physical & Social Science | 16 (44.4%) | 20 (55.6%) |
| Community & Social Service | 68 (24.4%) | 211 (75.6%) |
| Education, Arts & Media | 6 (7.1%) | 78 (92.9%) |
| Legal Services & Support | 0 (0.0%) | 9 (100.0%) |
| Education Instruction & Library | 39 (24.8%) | 118 (75.2%) |
| Arts, Media & Entertainment | 23 (79.3%) | 6 (20.7%) |
| Health Diagnosing & Treating | 37 (21.0%) | 139 (79.0%) |
| Health Technologists | 10 (7.4%) | 125 (92.6%) |
| Total (Category) | 517 (43.8%) | 663 (56.2%) |
| Total (Overall) | 1,343 (46.5%) | 1,548 (53.5%) |
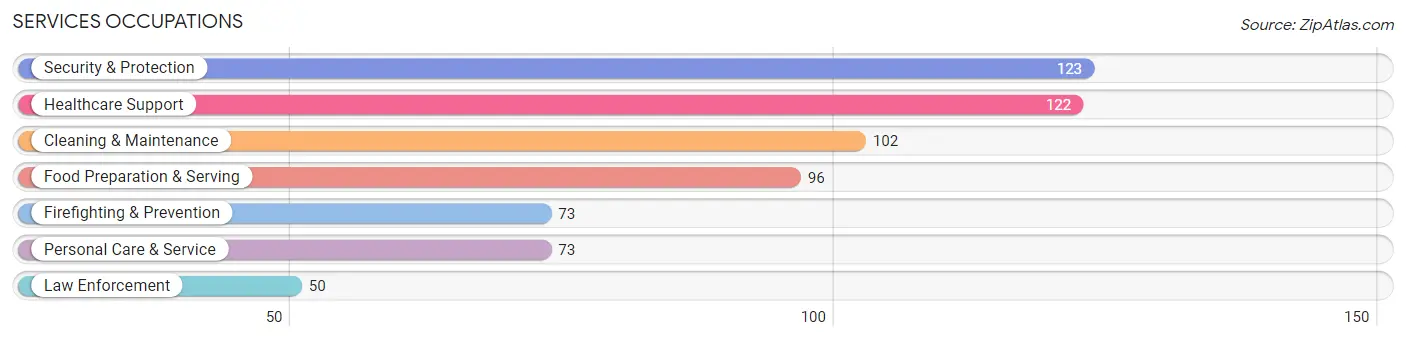
Services Occupations
The most common Services occupations in Indian Hills are Security & Protection (123 | 4.3%), Healthcare Support (122 | 4.2%), Cleaning & Maintenance (102 | 3.5%), Food Preparation & Serving (96 | 3.3%), and Firefighting & Prevention (73 | 2.5%).
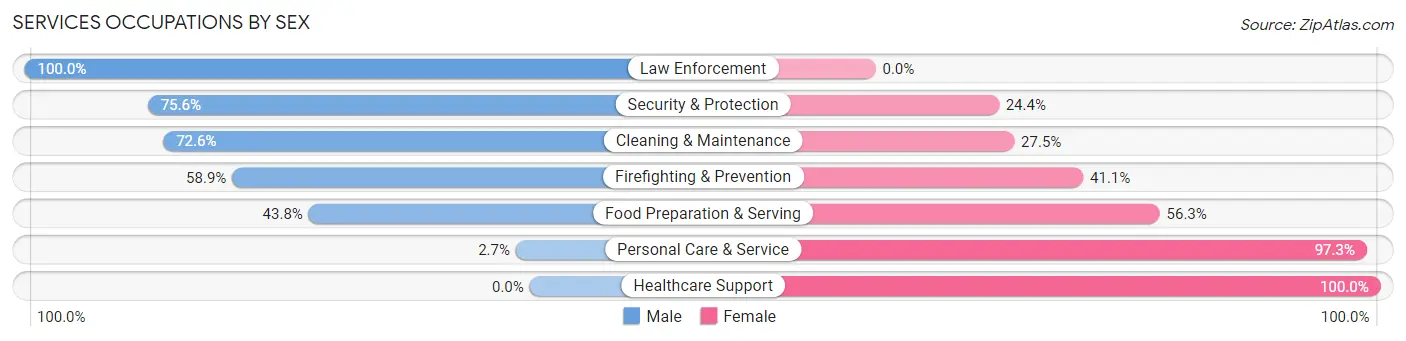
Services Occupations by Sex
Within the Services occupations in Indian Hills, the most male-oriented occupations are Law Enforcement (100.0%), Security & Protection (75.6%), and Cleaning & Maintenance (72.6%), while the most female-oriented occupations are Healthcare Support (100.0%), Personal Care & Service (97.3%), and Food Preparation & Serving (56.2%).
| Occupation | Male | Female |
| Healthcare Support | 0 (0.0%) | 122 (100.0%) |
| Security & Protection | 93 (75.6%) | 30 (24.4%) |
| Firefighting & Prevention | 43 (58.9%) | 30 (41.1%) |
| Law Enforcement | 50 (100.0%) | 0 (0.0%) |
| Food Preparation & Serving | 42 (43.8%) | 54 (56.2%) |
| Cleaning & Maintenance | 74 (72.6%) | 28 (27.5%) |
| Personal Care & Service | 2 (2.7%) | 71 (97.3%) |
| Total (Category) | 211 (40.9%) | 305 (59.1%) |
| Total (Overall) | 1,343 (46.5%) | 1,548 (53.5%) |
Sales and Office Occupations
The most common Sales and Office occupations in Indian Hills are Sales & Related (325 | 11.2%), and Office & Administration (286 | 9.9%).
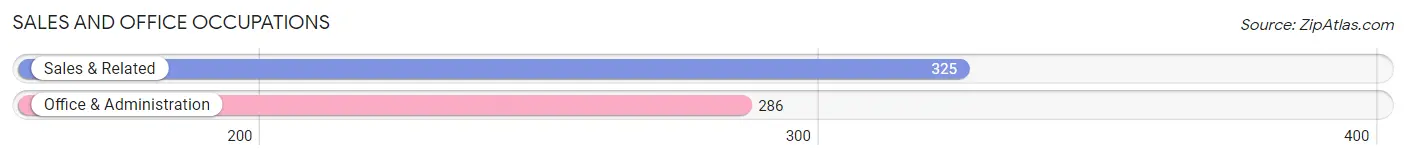
Sales and Office Occupations by Sex
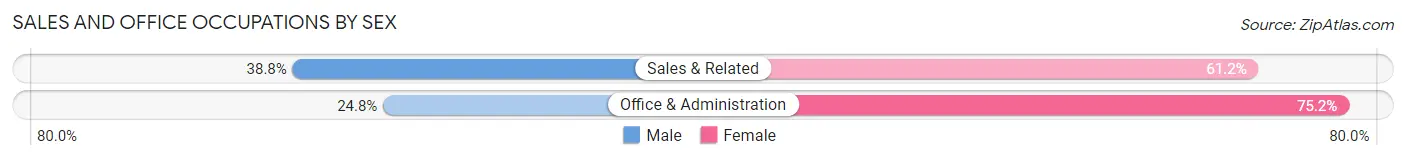
| Occupation | Male | Female |
| Sales & Related | 126 (38.8%) | 199 (61.2%) |
| Office & Administration | 71 (24.8%) | 215 (75.2%) |
| Total (Category) | 197 (32.2%) | 414 (67.8%) |
| Total (Overall) | 1,343 (46.5%) | 1,548 (53.5%) |
Natural Resources, Construction and Maintenance Occupations
The most common Natural Resources, Construction and Maintenance occupations in Indian Hills are Construction & Extraction (160 | 5.5%), and Installation, Maintenance & Repair (59 | 2.0%).
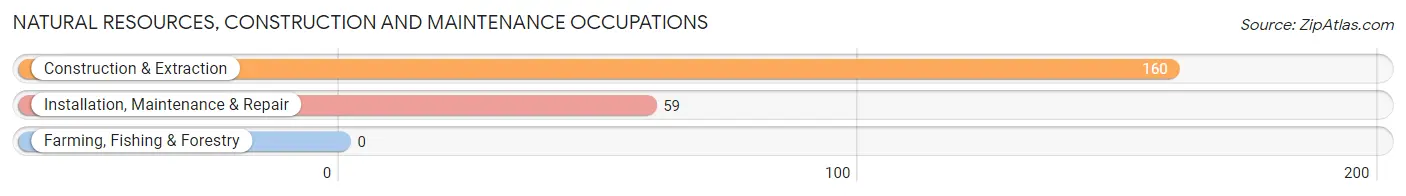
Natural Resources, Construction and Maintenance Occupations by Sex
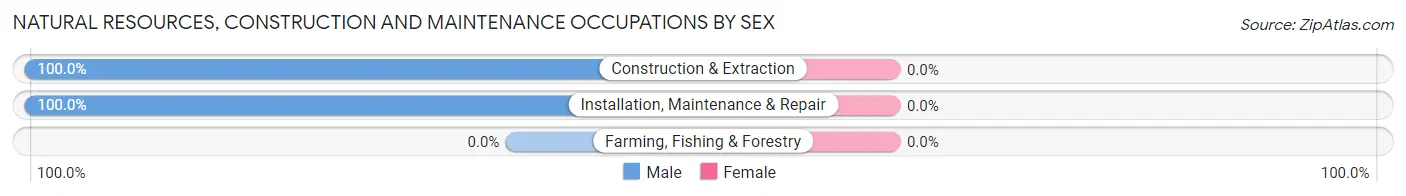
| Occupation | Male | Female |
| Farming, Fishing & Forestry | 0 (0.0%) | 0 (0.0%) |
| Construction & Extraction | 160 (100.0%) | 0 (0.0%) |
| Installation, Maintenance & Repair | 59 (100.0%) | 0 (0.0%) |
| Total (Category) | 219 (100.0%) | 0 (0.0%) |
| Total (Overall) | 1,343 (46.5%) | 1,548 (53.5%) |
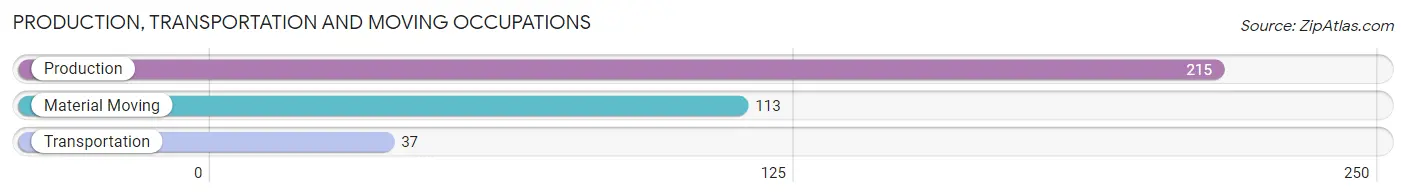
Production, Transportation and Moving Occupations
The most common Production, Transportation and Moving occupations in Indian Hills are Production (215 | 7.4%), Material Moving (113 | 3.9%), and Transportation (37 | 1.3%).
Production, Transportation and Moving Occupations by Sex
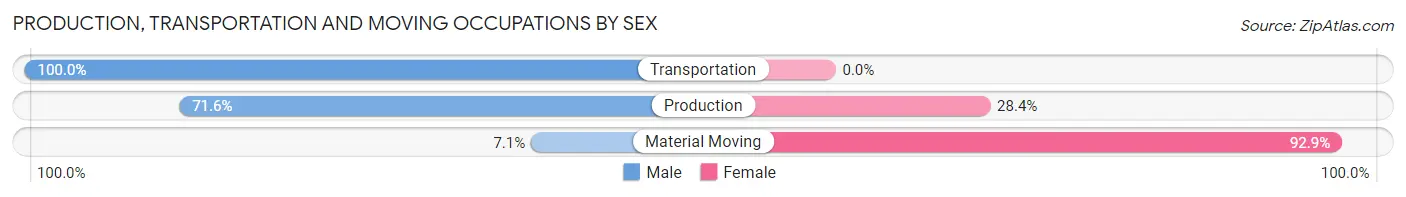
| Occupation | Male | Female |
| Production | 154 (71.6%) | 61 (28.4%) |
| Transportation | 37 (100.0%) | 0 (0.0%) |
| Material Moving | 8 (7.1%) | 105 (92.9%) |
| Total (Category) | 199 (54.5%) | 166 (45.5%) |
| Total (Overall) | 1,343 (46.5%) | 1,548 (53.5%) |
Employment Industries by Sex in Indian Hills
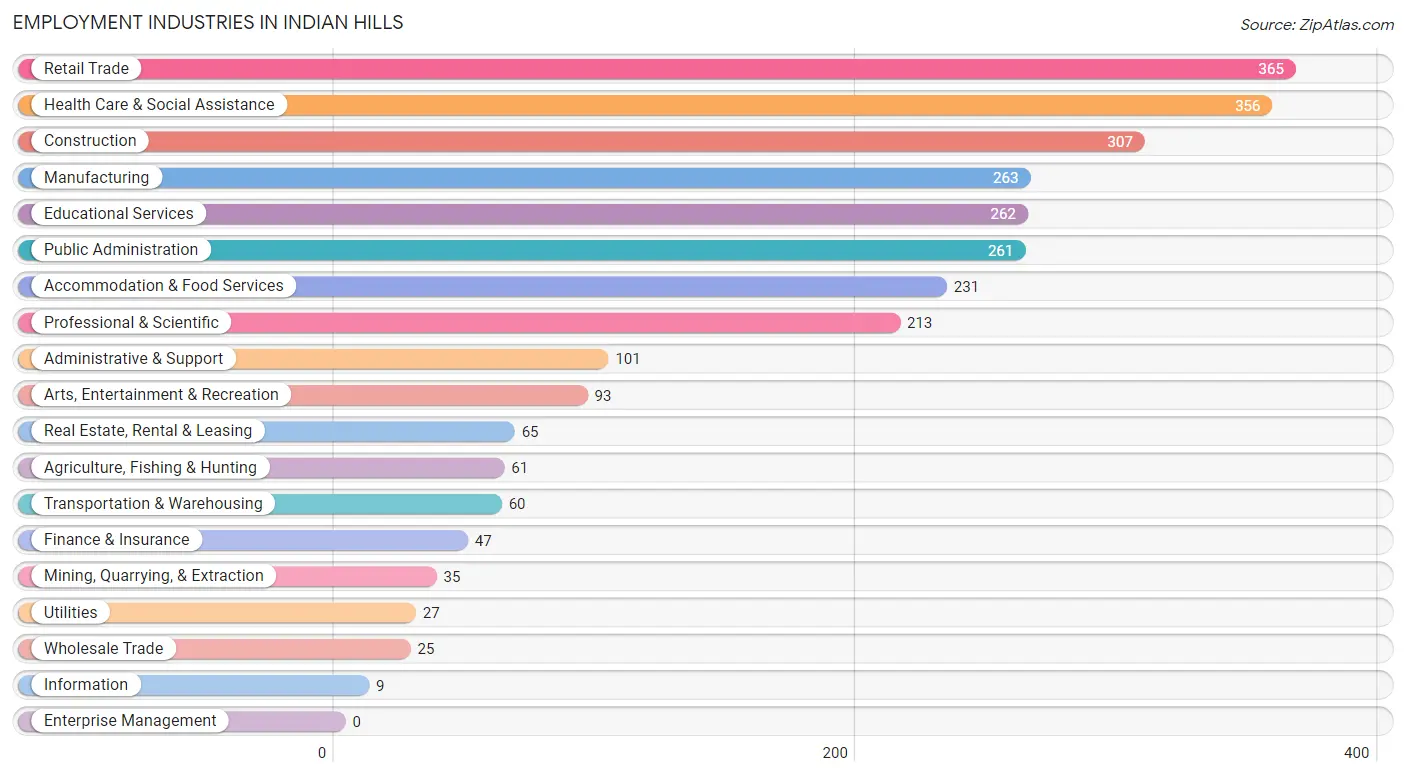
Employment Industries in Indian Hills
The major employment industries in Indian Hills include Retail Trade (365 | 12.6%), Health Care & Social Assistance (356 | 12.3%), Construction (307 | 10.6%), Manufacturing (263 | 9.1%), and Educational Services (262 | 9.1%).
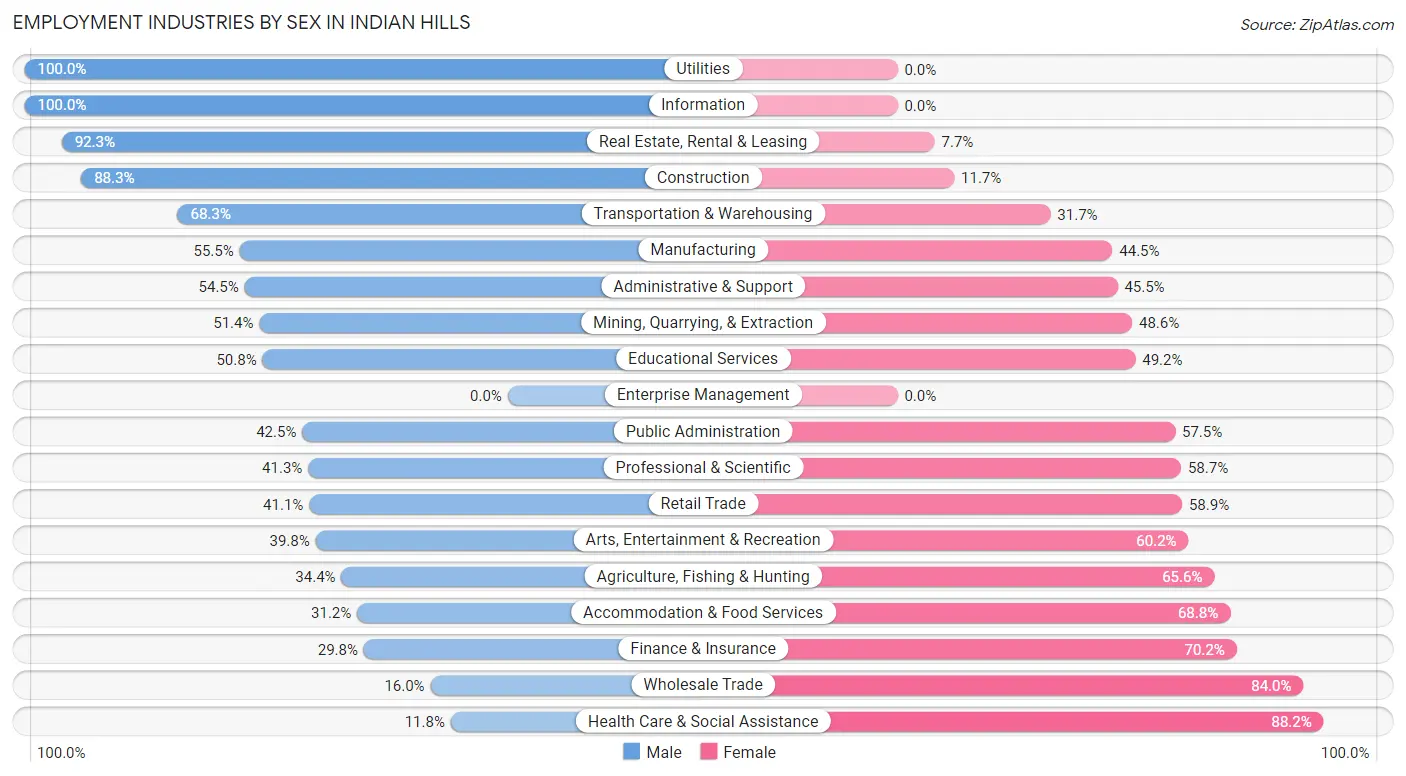
Employment Industries by Sex in Indian Hills
The Indian Hills industries that see more men than women are Utilities (100.0%), Information (100.0%), and Real Estate, Rental & Leasing (92.3%), whereas the industries that tend to have a higher number of women are Health Care & Social Assistance (88.2%), Wholesale Trade (84.0%), and Finance & Insurance (70.2%).
| Industry | Male | Female |
| Agriculture, Fishing & Hunting | 21 (34.4%) | 40 (65.6%) |
| Mining, Quarrying, & Extraction | 18 (51.4%) | 17 (48.6%) |
| Construction | 271 (88.3%) | 36 (11.7%) |
| Manufacturing | 146 (55.5%) | 117 (44.5%) |
| Wholesale Trade | 4 (16.0%) | 21 (84.0%) |
| Retail Trade | 150 (41.1%) | 215 (58.9%) |
| Transportation & Warehousing | 41 (68.3%) | 19 (31.7%) |
| Utilities | 27 (100.0%) | 0 (0.0%) |
| Information | 9 (100.0%) | 0 (0.0%) |
| Finance & Insurance | 14 (29.8%) | 33 (70.2%) |
| Real Estate, Rental & Leasing | 60 (92.3%) | 5 (7.7%) |
| Professional & Scientific | 88 (41.3%) | 125 (58.7%) |
| Enterprise Management | 0 (0.0%) | 0 (0.0%) |
| Administrative & Support | 55 (54.5%) | 46 (45.5%) |
| Educational Services | 133 (50.8%) | 129 (49.2%) |
| Health Care & Social Assistance | 42 (11.8%) | 314 (88.2%) |
| Arts, Entertainment & Recreation | 37 (39.8%) | 56 (60.2%) |
| Accommodation & Food Services | 72 (31.2%) | 159 (68.8%) |
| Public Administration | 111 (42.5%) | 150 (57.5%) |
| Total | 1,343 (46.5%) | 1,548 (53.5%) |
Education in Indian Hills
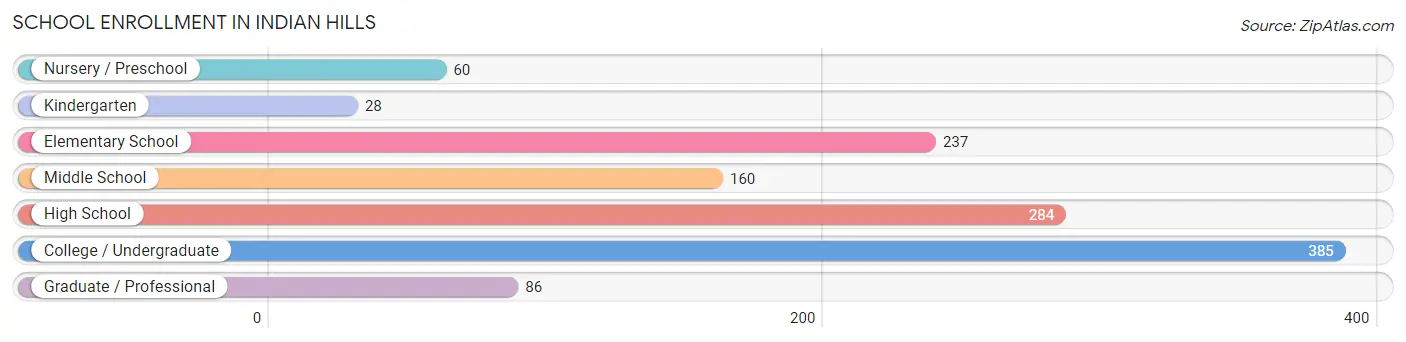
School Enrollment in Indian Hills
The most common levels of schooling among the 1,240 students in Indian Hills are college / undergraduate (385 | 31.0%), high school (284 | 22.9%), and elementary school (237 | 19.1%).
| School Level | # Students | % Students |
| Nursery / Preschool | 60 | 4.8% |
| Kindergarten | 28 | 2.3% |
| Elementary School | 237 | 19.1% |
| Middle School | 160 | 12.9% |
| High School | 284 | 22.9% |
| College / Undergraduate | 385 | 31.0% |
| Graduate / Professional | 86 | 6.9% |
| Total | 1,240 | 100.0% |
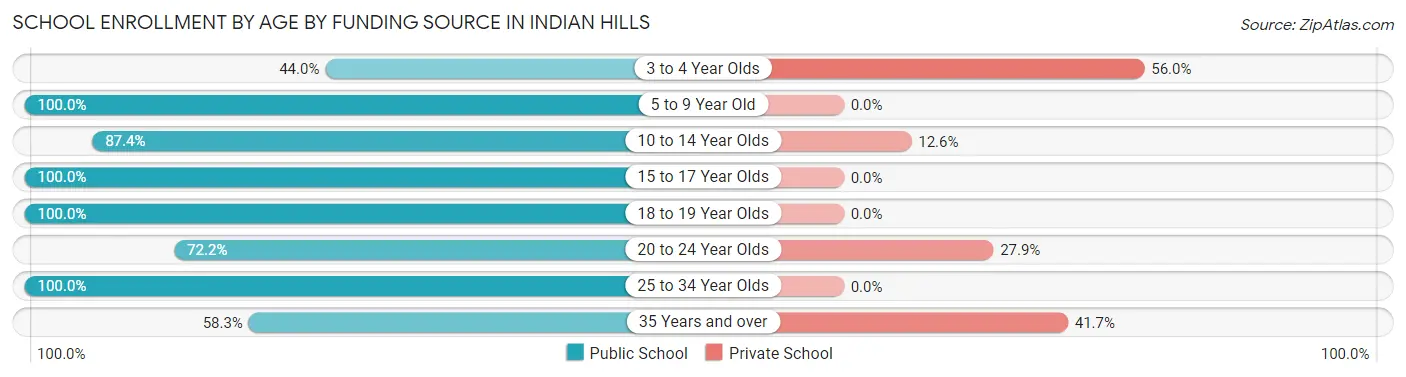
School Enrollment by Age by Funding Source in Indian Hills
Out of a total of 1,240 students who are enrolled in schools in Indian Hills, 192 (15.5%) attend a private institution, while the remaining 1,048 (84.5%) are enrolled in public schools. The age group of 3 to 4 year olds has the highest likelihood of being enrolled in private schools, with 14 (56.0% in the age bracket) enrolled. Conversely, the age group of 5 to 9 year old has the lowest likelihood of being enrolled in a private school, with 268 (100.0% in the age bracket) attending a public institution.
| Age Bracket | Public School | Private School |
| 3 to 4 Year Olds | 11 (44.0%) | 14 (56.0%) |
| 5 to 9 Year Old | 268 (100.0%) | 0 (0.0%) |
| 10 to 14 Year Olds | 229 (87.4%) | 33 (12.6%) |
| 15 to 17 Year Olds | 187 (100.0%) | 0 (0.0%) |
| 18 to 19 Year Olds | 35 (100.0%) | 0 (0.0%) |
| 20 to 24 Year Olds | 114 (72.2%) | 44 (27.9%) |
| 25 to 34 Year Olds | 63 (100.0%) | 0 (0.0%) |
| 35 Years and over | 141 (58.3%) | 101 (41.7%) |
| Total | 1,048 (84.5%) | 192 (15.5%) |
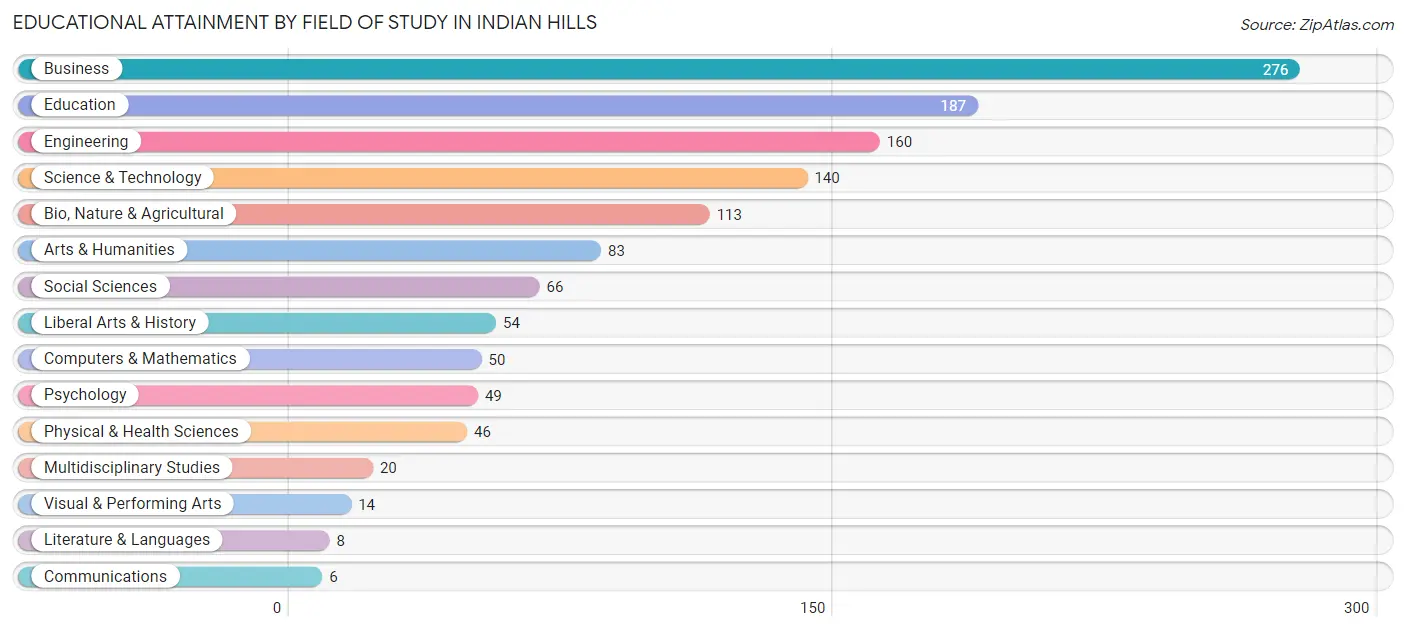
Educational Attainment by Field of Study in Indian Hills
Business (276 | 21.7%), education (187 | 14.7%), engineering (160 | 12.6%), science & technology (140 | 11.0%), and bio, nature & agricultural (113 | 8.9%) are the most common fields of study among 1,272 individuals in Indian Hills who have obtained a bachelor's degree or higher.
| Field of Study | # Graduates | % Graduates |
| Computers & Mathematics | 50 | 3.9% |
| Bio, Nature & Agricultural | 113 | 8.9% |
| Physical & Health Sciences | 46 | 3.6% |
| Psychology | 49 | 3.8% |
| Social Sciences | 66 | 5.2% |
| Engineering | 160 | 12.6% |
| Multidisciplinary Studies | 20 | 1.6% |
| Science & Technology | 140 | 11.0% |
| Business | 276 | 21.7% |
| Education | 187 | 14.7% |
| Literature & Languages | 8 | 0.6% |
| Liberal Arts & History | 54 | 4.3% |
| Visual & Performing Arts | 14 | 1.1% |
| Communications | 6 | 0.5% |
| Arts & Humanities | 83 | 6.5% |
| Total | 1,272 | 100.0% |
Transportation & Commute in Indian Hills
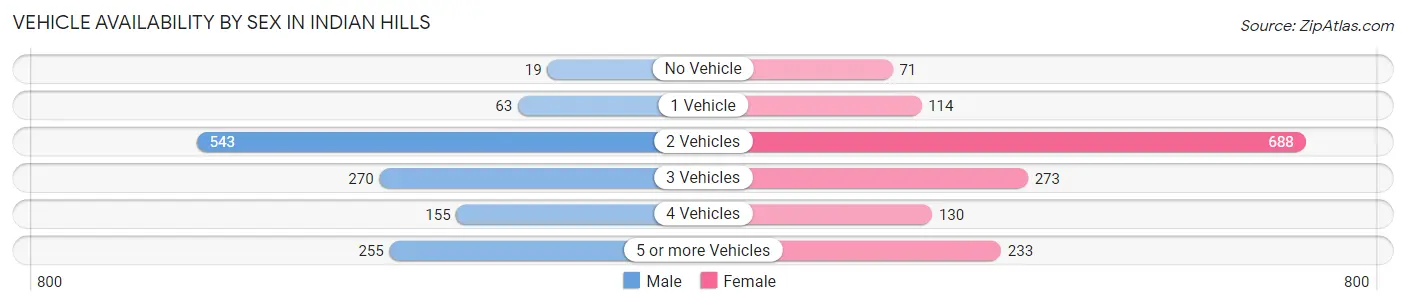
Vehicle Availability by Sex in Indian Hills
The most prevalent vehicle ownership categories in Indian Hills are males with 2 vehicles (543, accounting for 41.6%) and females with 2 vehicles (688, making up 36.0%).
| Vehicles Available | Male | Female |
| No Vehicle | 19 (1.5%) | 71 (4.7%) |
| 1 Vehicle | 63 (4.8%) | 114 (7.5%) |
| 2 Vehicles | 543 (41.6%) | 688 (45.6%) |
| 3 Vehicles | 270 (20.7%) | 273 (18.1%) |
| 4 Vehicles | 155 (11.9%) | 130 (8.6%) |
| 5 or more Vehicles | 255 (19.5%) | 233 (15.4%) |
| Total | 1,305 (100.0%) | 1,509 (100.0%) |
Commute Time in Indian Hills
The most frequently occuring commute durations in Indian Hills are 10 to 14 minutes (648 commuters, 25.3%), 15 to 19 minutes (543 commuters, 21.2%), and 30 to 34 minutes (417 commuters, 16.3%).
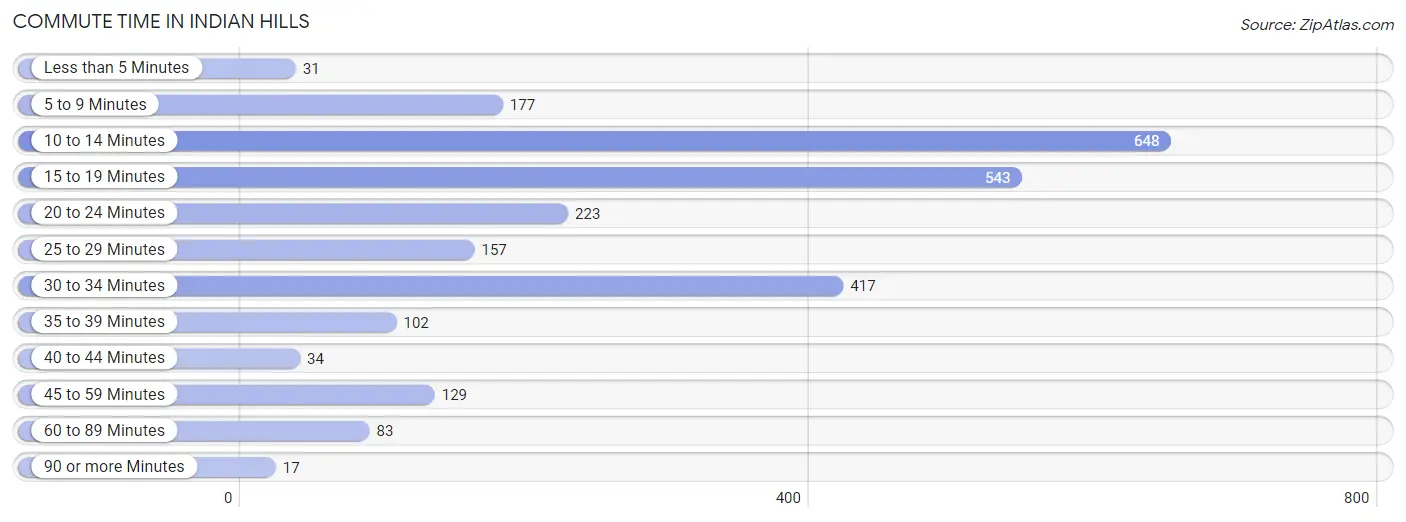
| Commute Time | # Commuters | % Commuters |
| Less than 5 Minutes | 31 | 1.2% |
| 5 to 9 Minutes | 177 | 6.9% |
| 10 to 14 Minutes | 648 | 25.3% |
| 15 to 19 Minutes | 543 | 21.2% |
| 20 to 24 Minutes | 223 | 8.7% |
| 25 to 29 Minutes | 157 | 6.1% |
| 30 to 34 Minutes | 417 | 16.3% |
| 35 to 39 Minutes | 102 | 4.0% |
| 40 to 44 Minutes | 34 | 1.3% |
| 45 to 59 Minutes | 129 | 5.0% |
| 60 to 89 Minutes | 83 | 3.2% |
| 90 or more Minutes | 17 | 0.7% |
Commute Time by Sex in Indian Hills
The most common commute times in Indian Hills are 30 to 34 minutes (279 commuters, 23.5%) for males and 10 to 14 minutes (377 commuters, 27.5%) for females.
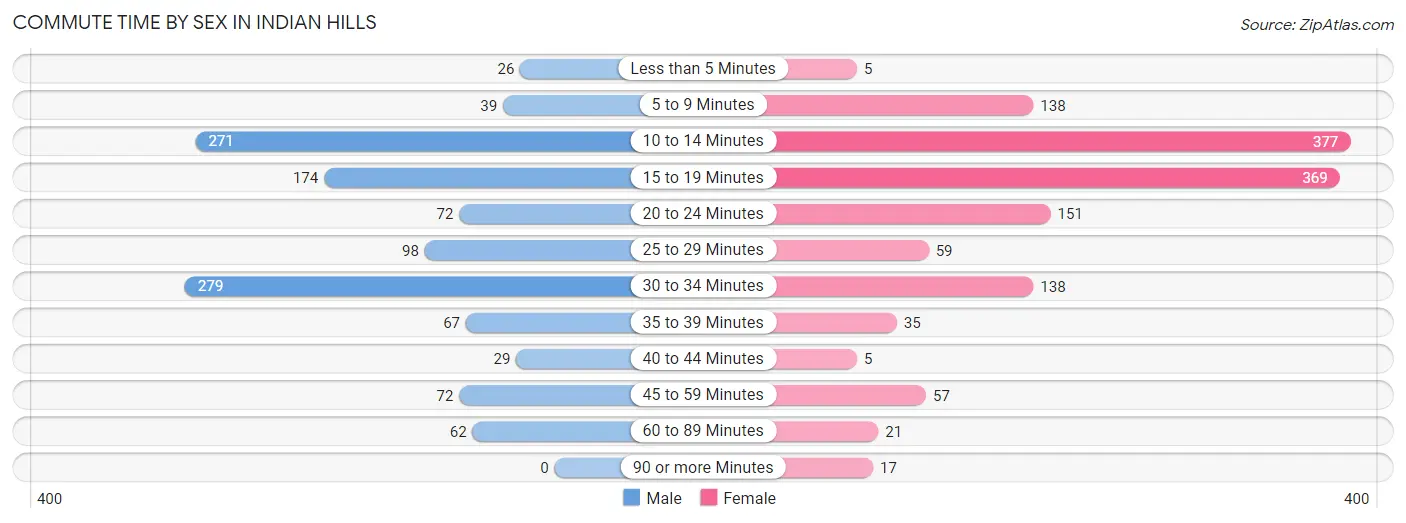
| Commute Time | Male | Female |
| Less than 5 Minutes | 26 (2.2%) | 5 (0.4%) |
| 5 to 9 Minutes | 39 (3.3%) | 138 (10.1%) |
| 10 to 14 Minutes | 271 (22.8%) | 377 (27.5%) |
| 15 to 19 Minutes | 174 (14.6%) | 369 (26.9%) |
| 20 to 24 Minutes | 72 (6.1%) | 151 (11.0%) |
| 25 to 29 Minutes | 98 (8.2%) | 59 (4.3%) |
| 30 to 34 Minutes | 279 (23.5%) | 138 (10.1%) |
| 35 to 39 Minutes | 67 (5.6%) | 35 (2.5%) |
| 40 to 44 Minutes | 29 (2.4%) | 5 (0.4%) |
| 45 to 59 Minutes | 72 (6.1%) | 57 (4.2%) |
| 60 to 89 Minutes | 62 (5.2%) | 21 (1.5%) |
| 90 or more Minutes | 0 (0.0%) | 17 (1.2%) |
Time of Departure to Work by Sex in Indian Hills
The most frequent times of departure to work in Indian Hills are 7:00 AM to 7:29 AM (269, 22.6%) for males and 6:30 AM to 6:59 AM (271, 19.8%) for females.
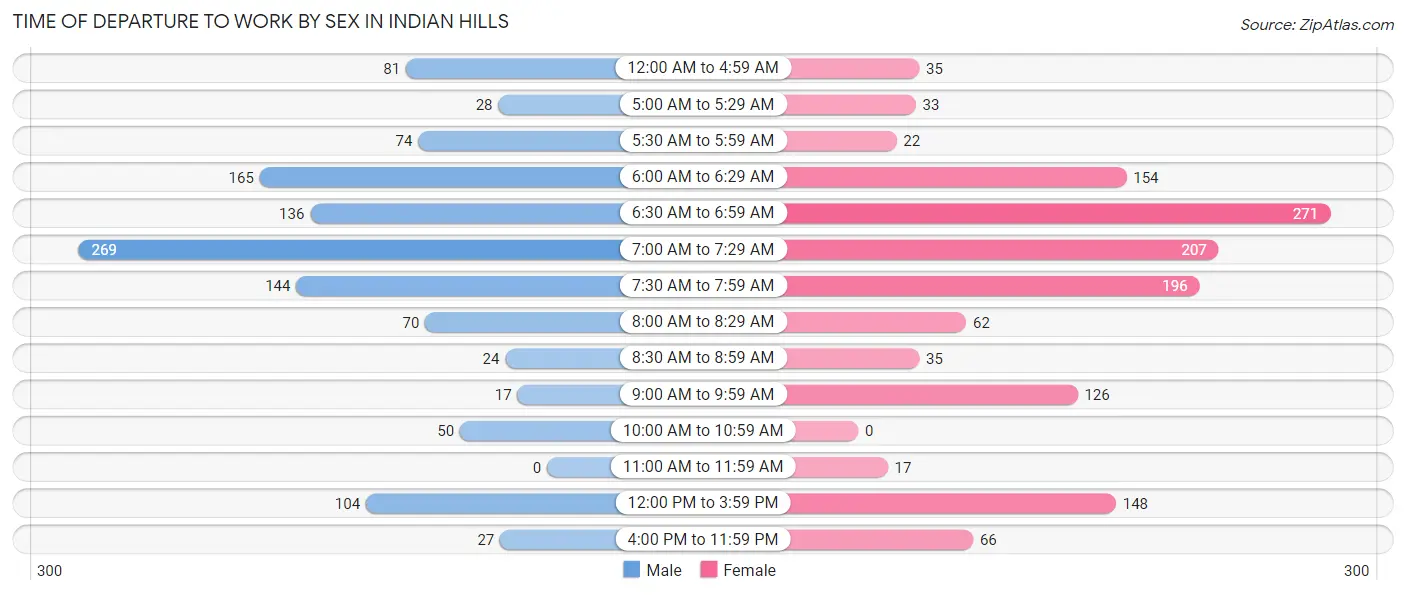
| Time of Departure | Male | Female |
| 12:00 AM to 4:59 AM | 81 (6.8%) | 35 (2.5%) |
| 5:00 AM to 5:29 AM | 28 (2.4%) | 33 (2.4%) |
| 5:30 AM to 5:59 AM | 74 (6.2%) | 22 (1.6%) |
| 6:00 AM to 6:29 AM | 165 (13.9%) | 154 (11.2%) |
| 6:30 AM to 6:59 AM | 136 (11.4%) | 271 (19.8%) |
| 7:00 AM to 7:29 AM | 269 (22.6%) | 207 (15.1%) |
| 7:30 AM to 7:59 AM | 144 (12.1%) | 196 (14.3%) |
| 8:00 AM to 8:29 AM | 70 (5.9%) | 62 (4.5%) |
| 8:30 AM to 8:59 AM | 24 (2.0%) | 35 (2.5%) |
| 9:00 AM to 9:59 AM | 17 (1.4%) | 126 (9.2%) |
| 10:00 AM to 10:59 AM | 50 (4.2%) | 0 (0.0%) |
| 11:00 AM to 11:59 AM | 0 (0.0%) | 17 (1.2%) |
| 12:00 PM to 3:59 PM | 104 (8.7%) | 148 (10.8%) |
| 4:00 PM to 11:59 PM | 27 (2.3%) | 66 (4.8%) |
| Total | 1,189 (100.0%) | 1,372 (100.0%) |
Housing Occupancy in Indian Hills
Occupancy by Ownership in Indian Hills
Of the total 2,531 dwellings in Indian Hills, owner-occupied units account for 1,986 (78.5%), while renter-occupied units make up 545 (21.5%).
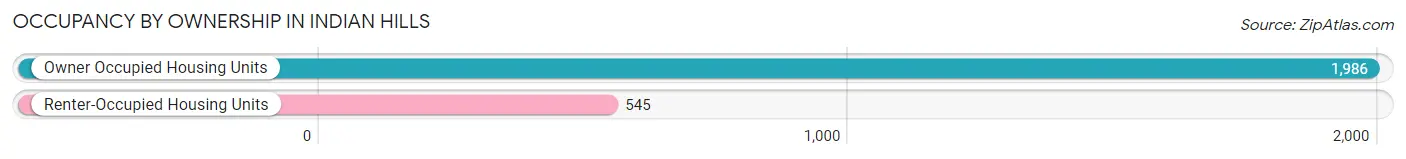
| Occupancy | # Housing Units | % Housing Units |
| Owner Occupied Housing Units | 1,986 | 78.5% |
| Renter-Occupied Housing Units | 545 | 21.5% |
| Total Occupied Housing Units | 2,531 | 100.0% |
Occupancy by Household Size in Indian Hills
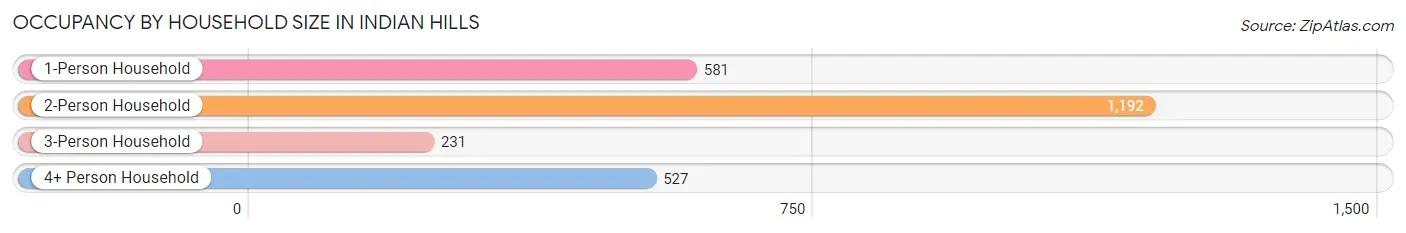
| Household Size | # Housing Units | % Housing Units |
| 1-Person Household | 581 | 23.0% |
| 2-Person Household | 1,192 | 47.1% |
| 3-Person Household | 231 | 9.1% |
| 4+ Person Household | 527 | 20.8% |
| Total Housing Units | 2,531 | 100.0% |
Occupancy by Ownership by Household Size in Indian Hills
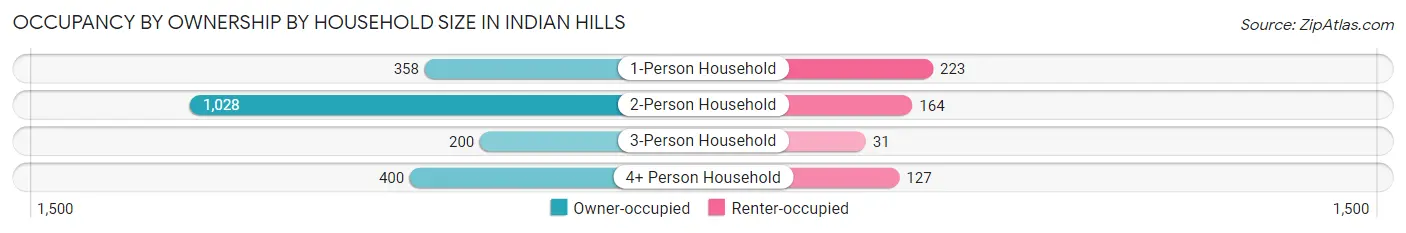
| Household Size | Owner-occupied | Renter-occupied |
| 1-Person Household | 358 (61.6%) | 223 (38.4%) |
| 2-Person Household | 1,028 (86.2%) | 164 (13.8%) |
| 3-Person Household | 200 (86.6%) | 31 (13.4%) |
| 4+ Person Household | 400 (75.9%) | 127 (24.1%) |
| Total Housing Units | 1,986 (78.5%) | 545 (21.5%) |
Occupancy by Educational Attainment in Indian Hills
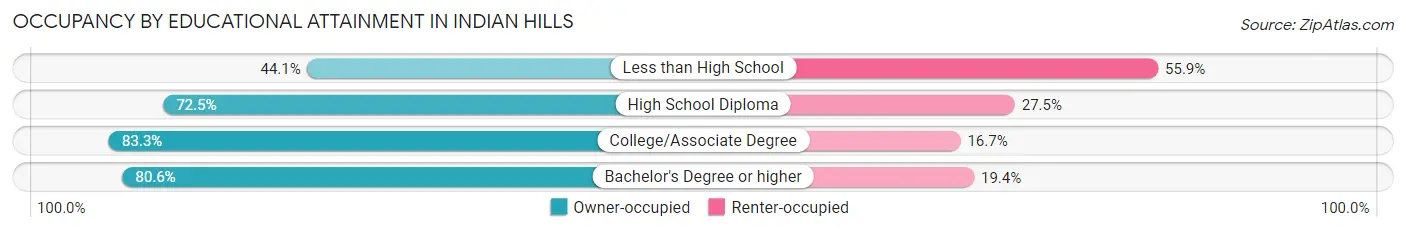
| Household Size | Owner-occupied | Renter-occupied |
| Less than High School | 71 (44.1%) | 90 (55.9%) |
| High School Diploma | 269 (72.5%) | 102 (27.5%) |
| College/Associate Degree | 1,081 (83.3%) | 217 (16.7%) |
| Bachelor's Degree or higher | 565 (80.6%) | 136 (19.4%) |
Occupancy by Age of Householder in Indian Hills
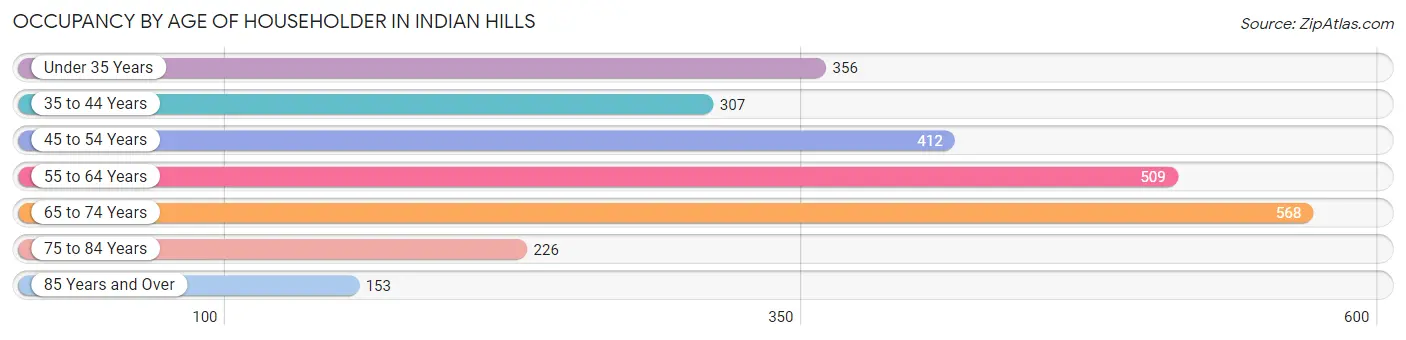
| Age Bracket | # Households | % Households |
| Under 35 Years | 356 | 14.1% |
| 35 to 44 Years | 307 | 12.1% |
| 45 to 54 Years | 412 | 16.3% |
| 55 to 64 Years | 509 | 20.1% |
| 65 to 74 Years | 568 | 22.4% |
| 75 to 84 Years | 226 | 8.9% |
| 85 Years and Over | 153 | 6.0% |
| Total | 2,531 | 100.0% |
Housing Finances in Indian Hills
Median Income by Occupancy in Indian Hills
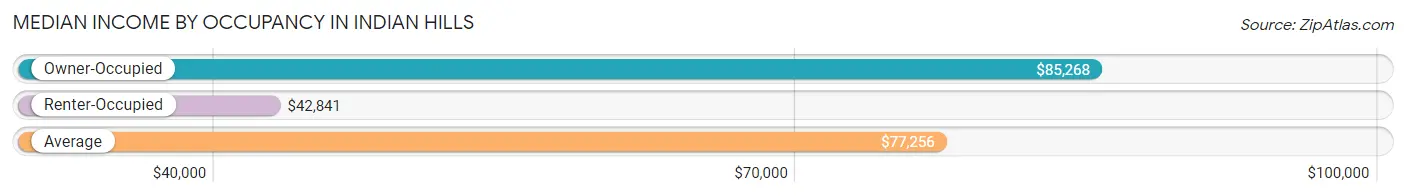
| Occupancy Type | # Households | Median Income |
| Owner-Occupied | 1,986 (78.5%) | $85,268 |
| Renter-Occupied | 545 (21.5%) | $42,841 |
| Average | 2,531 (100.0%) | $77,256 |
Occupancy by Householder Income Bracket in Indian Hills
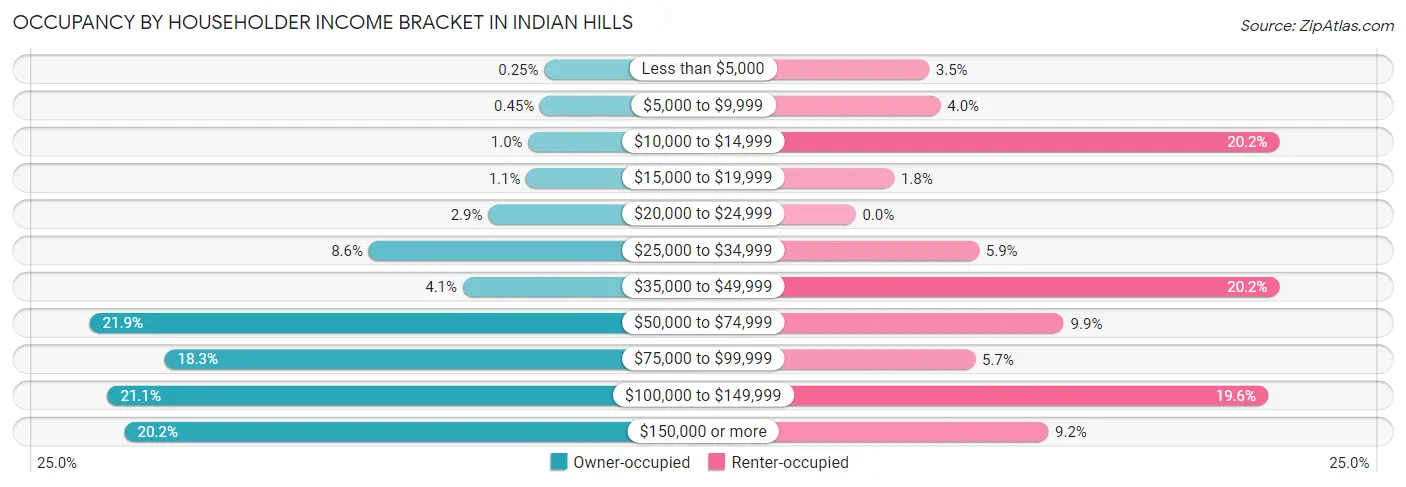
| Income Bracket | Owner-occupied | Renter-occupied |
| Less than $5,000 | 5 (0.3%) | 19 (3.5%) |
| $5,000 to $9,999 | 9 (0.4%) | 22 (4.0%) |
| $10,000 to $14,999 | 20 (1.0%) | 110 (20.2%) |
| $15,000 to $19,999 | 22 (1.1%) | 10 (1.8%) |
| $20,000 to $24,999 | 58 (2.9%) | 0 (0.0%) |
| $25,000 to $34,999 | 171 (8.6%) | 32 (5.9%) |
| $35,000 to $49,999 | 82 (4.1%) | 110 (20.2%) |
| $50,000 to $74,999 | 435 (21.9%) | 54 (9.9%) |
| $75,000 to $99,999 | 364 (18.3%) | 31 (5.7%) |
| $100,000 to $149,999 | 418 (21.0%) | 107 (19.6%) |
| $150,000 or more | 402 (20.2%) | 50 (9.2%) |
| Total | 1,986 (100.0%) | 545 (100.0%) |
Monthly Housing Cost Tiers in Indian Hills
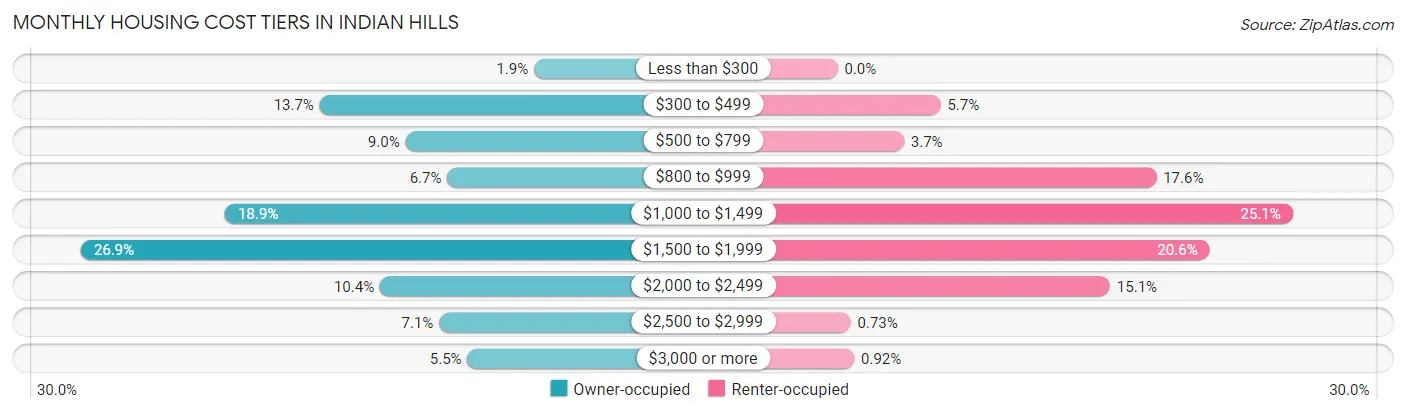
| Monthly Cost | Owner-occupied | Renter-occupied |
| Less than $300 | 37 (1.9%) | 0 (0.0%) |
| $300 to $499 | 272 (13.7%) | 31 (5.7%) |
| $500 to $799 | 178 (9.0%) | 20 (3.7%) |
| $800 to $999 | 132 (6.7%) | 96 (17.6%) |
| $1,000 to $1,499 | 376 (18.9%) | 137 (25.1%) |
| $1,500 to $1,999 | 534 (26.9%) | 112 (20.5%) |
| $2,000 to $2,499 | 206 (10.4%) | 82 (15.0%) |
| $2,500 to $2,999 | 141 (7.1%) | 4 (0.7%) |
| $3,000 or more | 110 (5.5%) | 5 (0.9%) |
| Total | 1,986 (100.0%) | 545 (100.0%) |
Physical Housing Characteristics in Indian Hills
Housing Structures in Indian Hills
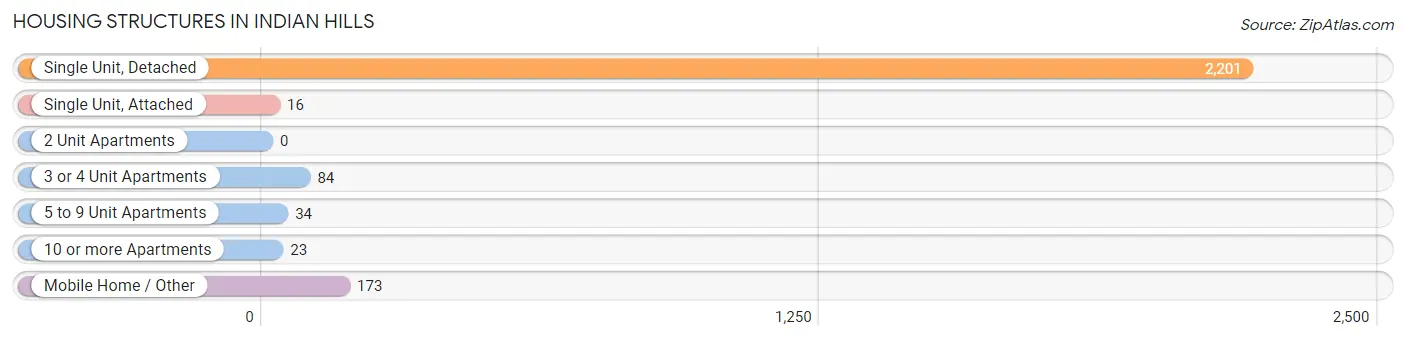
| Structure Type | # Housing Units | % Housing Units |
| Single Unit, Detached | 2,201 | 87.0% |
| Single Unit, Attached | 16 | 0.6% |
| 2 Unit Apartments | 0 | 0.0% |
| 3 or 4 Unit Apartments | 84 | 3.3% |
| 5 to 9 Unit Apartments | 34 | 1.3% |
| 10 or more Apartments | 23 | 0.9% |
| Mobile Home / Other | 173 | 6.8% |
| Total | 2,531 | 100.0% |
Housing Structures by Occupancy in Indian Hills
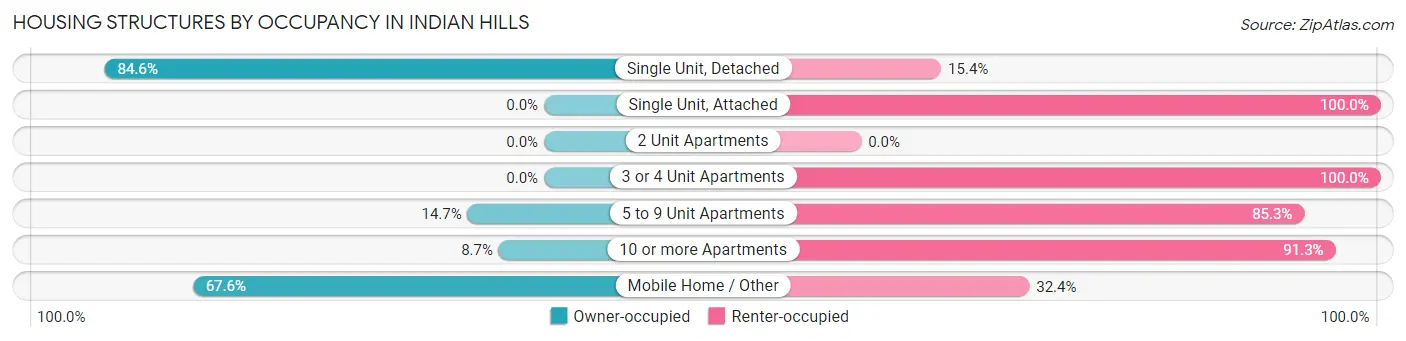
| Structure Type | Owner-occupied | Renter-occupied |
| Single Unit, Detached | 1,862 (84.6%) | 339 (15.4%) |
| Single Unit, Attached | 0 (0.0%) | 16 (100.0%) |
| 2 Unit Apartments | 0 (0.0%) | 0 (0.0%) |
| 3 or 4 Unit Apartments | 0 (0.0%) | 84 (100.0%) |
| 5 to 9 Unit Apartments | 5 (14.7%) | 29 (85.3%) |
| 10 or more Apartments | 2 (8.7%) | 21 (91.3%) |
| Mobile Home / Other | 117 (67.6%) | 56 (32.4%) |
| Total | 1,986 (78.5%) | 545 (21.5%) |
Housing Structures by Number of Rooms in Indian Hills
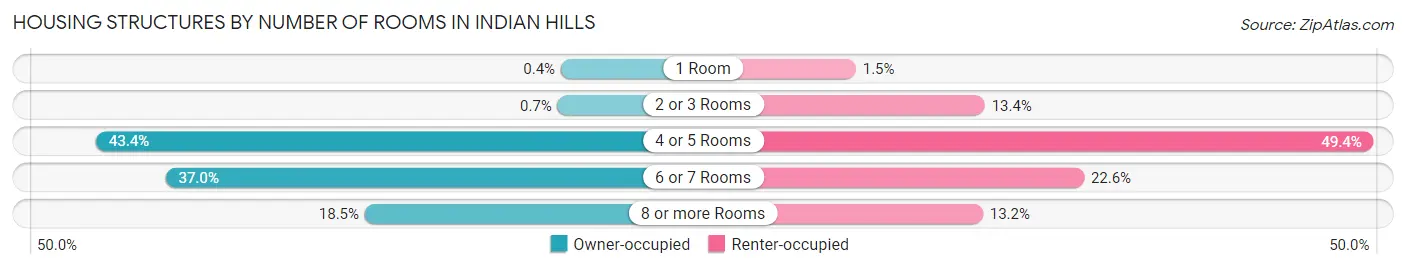
| Number of Rooms | Owner-occupied | Renter-occupied |
| 1 Room | 8 (0.4%) | 8 (1.5%) |
| 2 or 3 Rooms | 14 (0.7%) | 73 (13.4%) |
| 4 or 5 Rooms | 862 (43.4%) | 269 (49.4%) |
| 6 or 7 Rooms | 734 (37.0%) | 123 (22.6%) |
| 8 or more Rooms | 368 (18.5%) | 72 (13.2%) |
| Total | 1,986 (100.0%) | 545 (100.0%) |
Housing Structure by Heating Type in Indian Hills
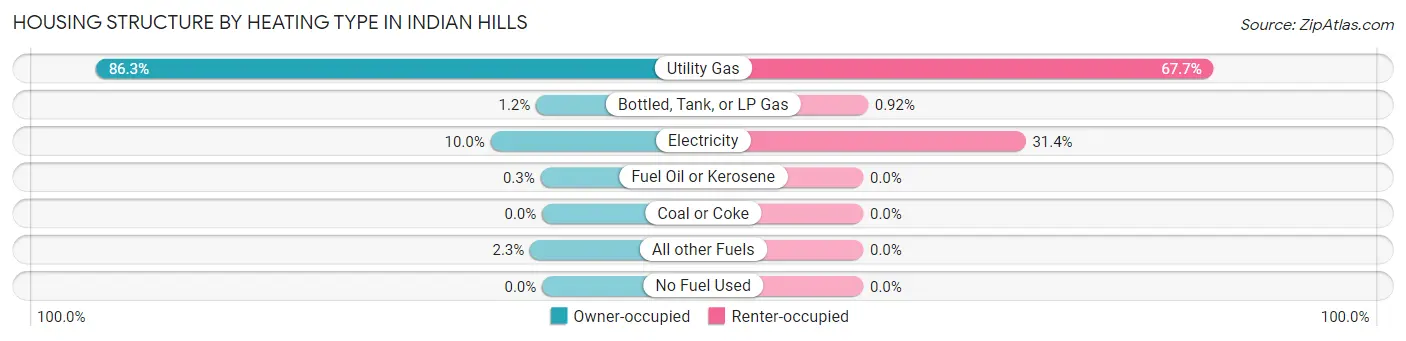
| Heating Type | Owner-occupied | Renter-occupied |
| Utility Gas | 1,713 (86.3%) | 369 (67.7%) |
| Bottled, Tank, or LP Gas | 23 (1.2%) | 5 (0.9%) |
| Electricity | 198 (10.0%) | 171 (31.4%) |
| Fuel Oil or Kerosene | 6 (0.3%) | 0 (0.0%) |
| Coal or Coke | 0 (0.0%) | 0 (0.0%) |
| All other Fuels | 46 (2.3%) | 0 (0.0%) |
| No Fuel Used | 0 (0.0%) | 0 (0.0%) |
| Total | 1,986 (100.0%) | 545 (100.0%) |
Household Vehicle Usage in Indian Hills
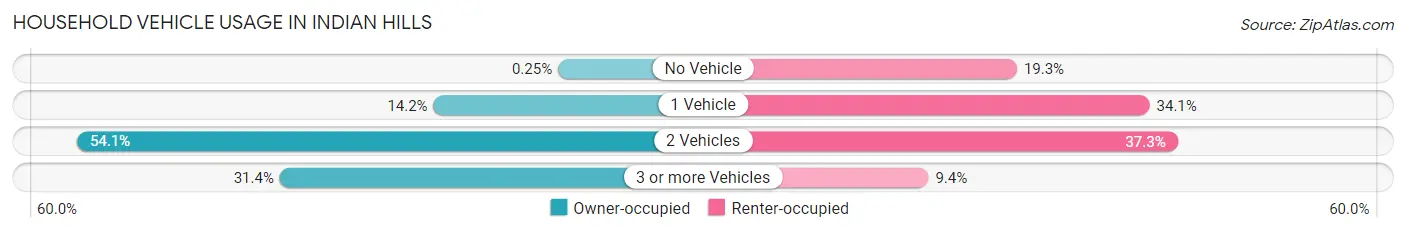
| Vehicles per Household | Owner-occupied | Renter-occupied |
| No Vehicle | 5 (0.3%) | 105 (19.3%) |
| 1 Vehicle | 282 (14.2%) | 186 (34.1%) |
| 2 Vehicles | 1,075 (54.1%) | 203 (37.2%) |
| 3 or more Vehicles | 624 (31.4%) | 51 (9.4%) |
| Total | 1,986 (100.0%) | 545 (100.0%) |
Real Estate & Mortgages in Indian Hills
Real Estate and Mortgage Overview in Indian Hills
| Characteristic | Without Mortgage | With Mortgage |
| Housing Units | 526 | 1,460 |
| Median Property Value | $470,600 | $422,300 |
| Median Household Income | $75,669 | $331 |
| Monthly Housing Costs | $483 | $105 |
| Real Estate Taxes | $2,431 | $0 |
Property Value by Mortgage Status in Indian Hills
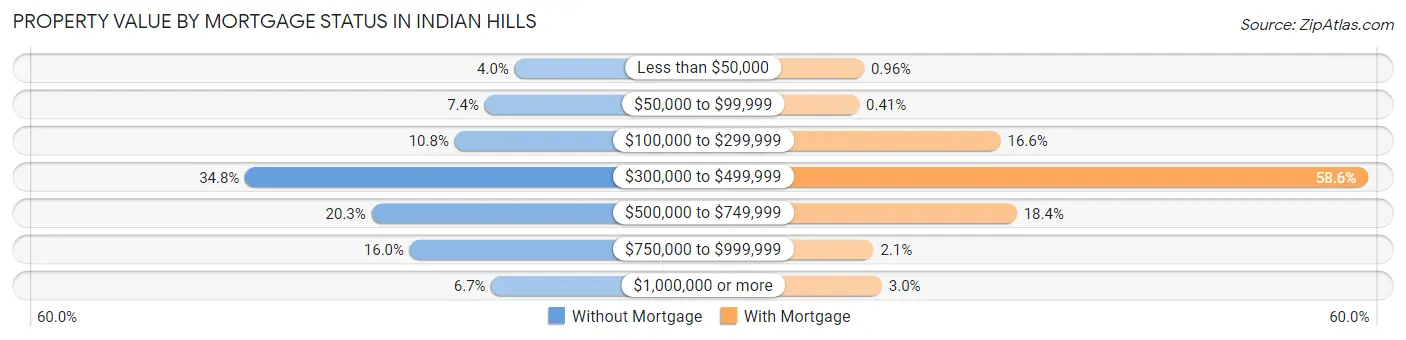
| Property Value | Without Mortgage | With Mortgage |
| Less than $50,000 | 21 (4.0%) | 14 (1.0%) |
| $50,000 to $99,999 | 39 (7.4%) | 6 (0.4%) |
| $100,000 to $299,999 | 57 (10.8%) | 242 (16.6%) |
| $300,000 to $499,999 | 183 (34.8%) | 855 (58.6%) |
| $500,000 to $749,999 | 107 (20.3%) | 269 (18.4%) |
| $750,000 to $999,999 | 84 (16.0%) | 30 (2.1%) |
| $1,000,000 or more | 35 (6.7%) | 44 (3.0%) |
| Total | 526 (100.0%) | 1,460 (100.0%) |
Household Income by Mortgage Status in Indian Hills
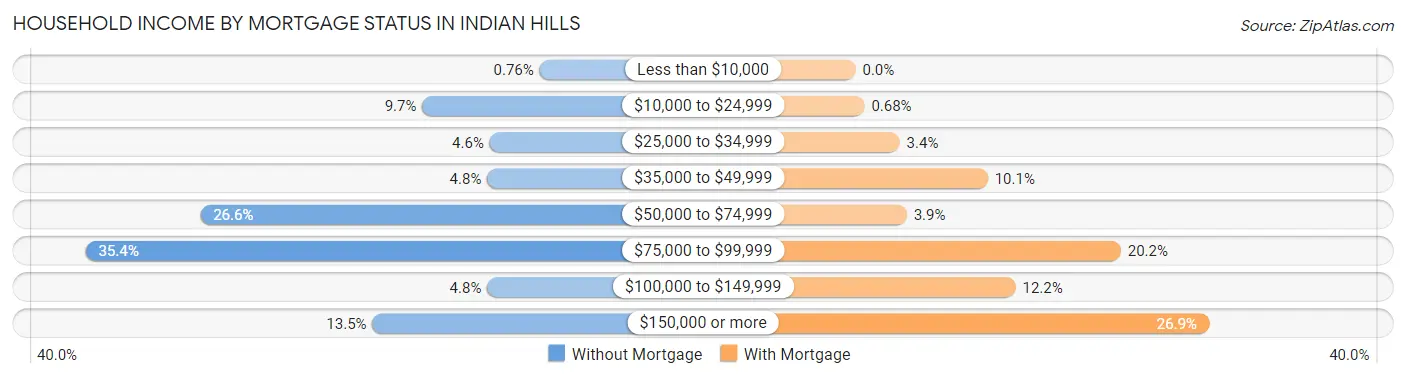
| Household Income | Without Mortgage | With Mortgage |
| Less than $10,000 | 4 (0.8%) | 0 (0.0%) |
| $10,000 to $24,999 | 51 (9.7%) | 10 (0.7%) |
| $25,000 to $34,999 | 24 (4.6%) | 49 (3.4%) |
| $35,000 to $49,999 | 25 (4.8%) | 147 (10.1%) |
| $50,000 to $74,999 | 140 (26.6%) | 57 (3.9%) |
| $75,000 to $99,999 | 186 (35.4%) | 295 (20.2%) |
| $100,000 to $149,999 | 25 (4.8%) | 178 (12.2%) |
| $150,000 or more | 71 (13.5%) | 393 (26.9%) |
| Total | 526 (100.0%) | 1,460 (100.0%) |
Property Value to Household Income Ratio in Indian Hills
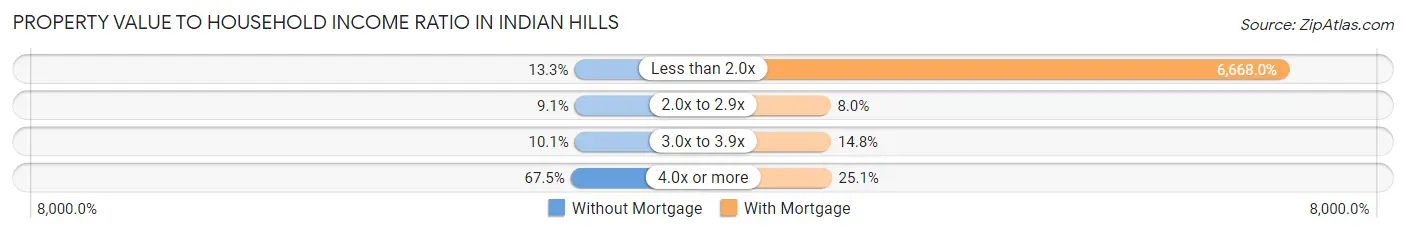
| Value-to-Income Ratio | Without Mortgage | With Mortgage |
| Less than 2.0x | 70 (13.3%) | 97,353 (6,668.0%) |
| 2.0x to 2.9x | 48 (9.1%) | 116 (8.0%) |
| 3.0x to 3.9x | 53 (10.1%) | 216 (14.8%) |
| 4.0x or more | 355 (67.5%) | 367 (25.1%) |
| Total | 526 (100.0%) | 1,460 (100.0%) |
Real Estate Taxes by Mortgage Status in Indian Hills
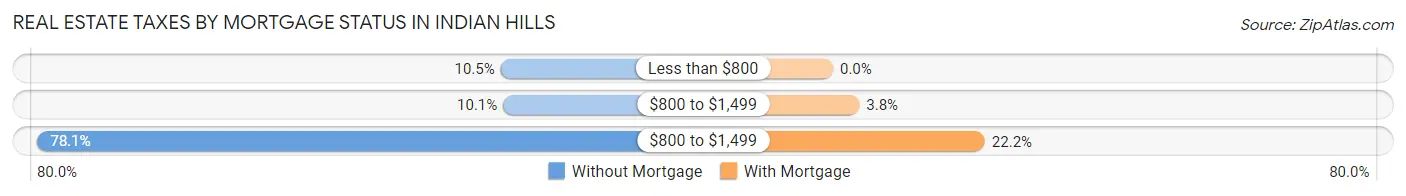
| Property Taxes | Without Mortgage | With Mortgage |
| Less than $800 | 55 (10.5%) | 0 (0.0%) |
| $800 to $1,499 | 53 (10.1%) | 56 (3.8%) |
| $800 to $1,499 | 411 (78.1%) | 324 (22.2%) |
| Total | 526 (100.0%) | 1,460 (100.0%) |
Health & Disability in Indian Hills
Health Insurance Coverage by Age in Indian Hills
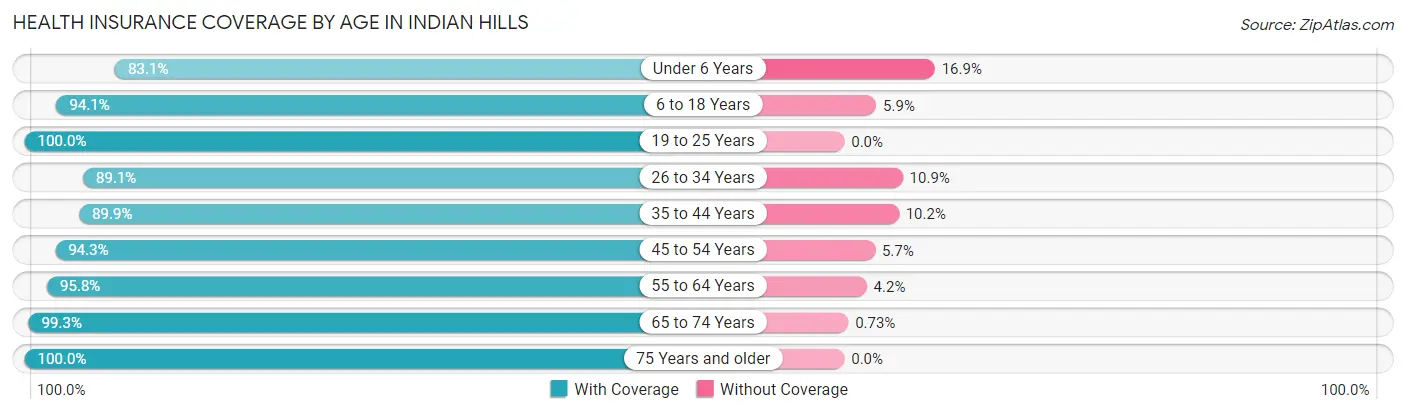
| Age Bracket | With Coverage | Without Coverage |
| Under 6 Years | 291 (83.1%) | 59 (16.9%) |
| 6 to 18 Years | 697 (94.1%) | 44 (5.9%) |
| 19 to 25 Years | 261 (100.0%) | 0 (0.0%) |
| 26 to 34 Years | 639 (89.1%) | 78 (10.9%) |
| 35 to 44 Years | 549 (89.8%) | 62 (10.2%) |
| 45 to 54 Years | 774 (94.3%) | 47 (5.7%) |
| 55 to 64 Years | 896 (95.8%) | 39 (4.2%) |
| 65 to 74 Years | 946 (99.3%) | 7 (0.7%) |
| 75 Years and older | 561 (100.0%) | 0 (0.0%) |
| Total | 5,614 (94.4%) | 336 (5.7%) |
Health Insurance Coverage by Citizenship Status in Indian Hills
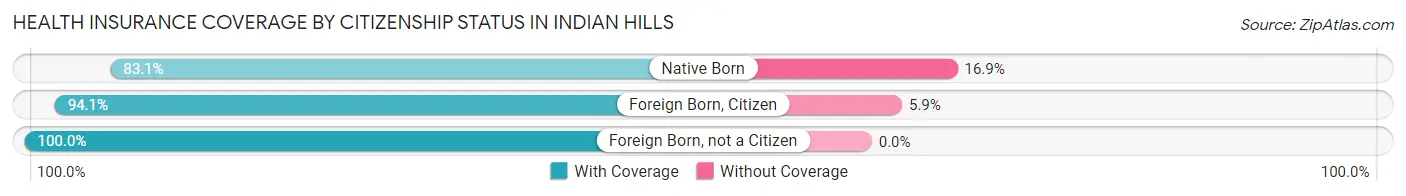
| Citizenship Status | With Coverage | Without Coverage |
| Native Born | 291 (83.1%) | 59 (16.9%) |
| Foreign Born, Citizen | 697 (94.1%) | 44 (5.9%) |
| Foreign Born, not a Citizen | 261 (100.0%) | 0 (0.0%) |
Health Insurance Coverage by Household Income in Indian Hills
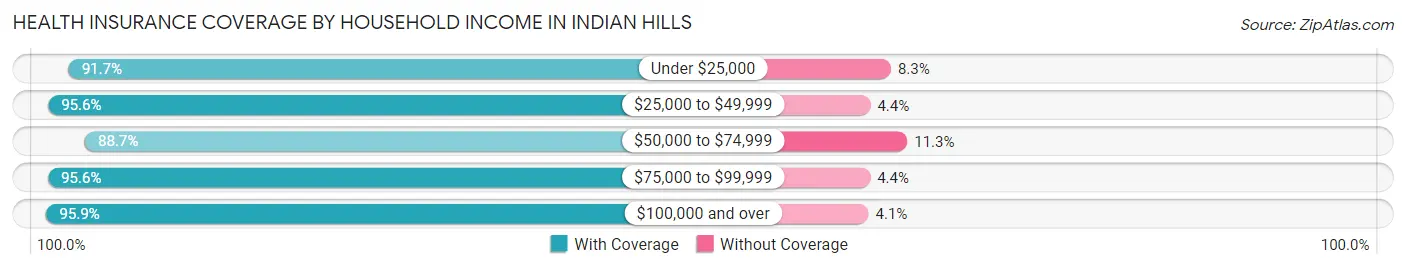
| Household Income | With Coverage | Without Coverage |
| Under $25,000 | 499 (91.7%) | 45 (8.3%) |
| $25,000 to $49,999 | 669 (95.6%) | 31 (4.4%) |
| $50,000 to $74,999 | 790 (88.7%) | 101 (11.3%) |
| $75,000 to $99,999 | 959 (95.6%) | 44 (4.4%) |
| $100,000 and over | 2,697 (95.9%) | 115 (4.1%) |
Public vs Private Health Insurance Coverage by Age in Indian Hills
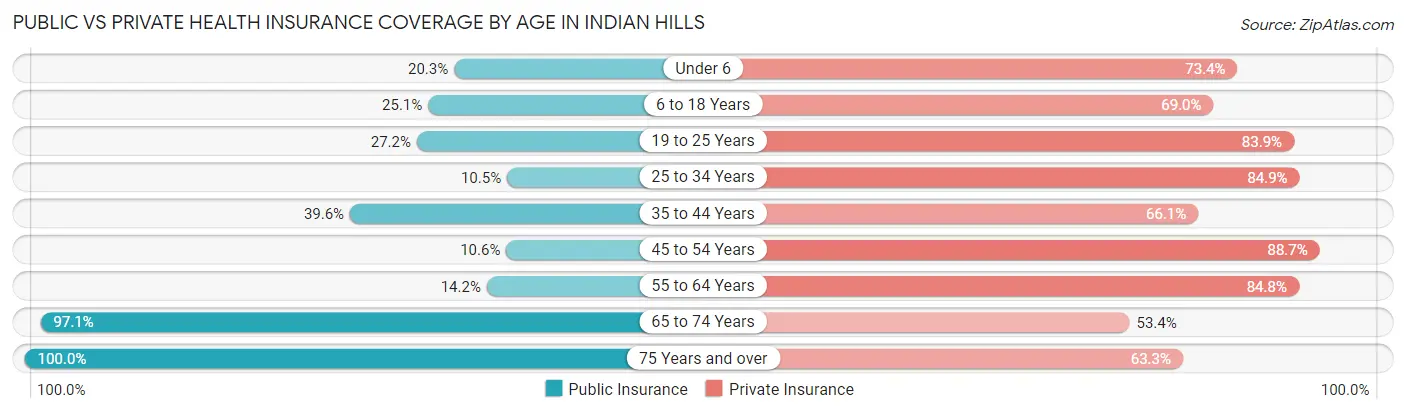
| Age Bracket | Public Insurance | Private Insurance |
| Under 6 | 71 (20.3%) | 257 (73.4%) |
| 6 to 18 Years | 186 (25.1%) | 511 (69.0%) |
| 19 to 25 Years | 71 (27.2%) | 219 (83.9%) |
| 25 to 34 Years | 75 (10.5%) | 609 (84.9%) |
| 35 to 44 Years | 242 (39.6%) | 404 (66.1%) |
| 45 to 54 Years | 87 (10.6%) | 728 (88.7%) |
| 55 to 64 Years | 133 (14.2%) | 793 (84.8%) |
| 65 to 74 Years | 925 (97.1%) | 509 (53.4%) |
| 75 Years and over | 561 (100.0%) | 355 (63.3%) |
| Total | 2,351 (39.5%) | 4,385 (73.7%) |
Disability Status by Sex by Age in Indian Hills
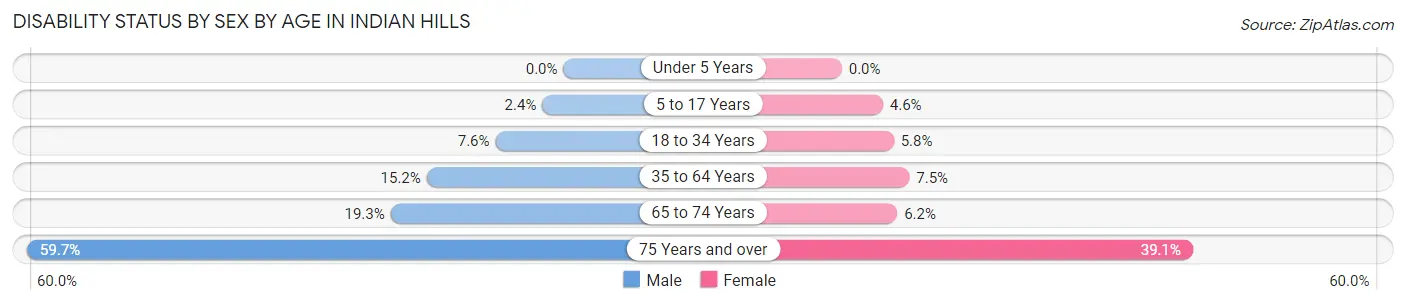
| Age Bracket | Male | Female |
| Under 5 Years | 0 (0.0%) | 0 (0.0%) |
| 5 to 17 Years | 9 (2.4%) | 17 (4.6%) |
| 18 to 34 Years | 39 (7.6%) | 29 (5.8%) |
| 35 to 64 Years | 166 (15.2%) | 96 (7.5%) |
| 65 to 74 Years | 93 (19.3%) | 29 (6.2%) |
| 75 Years and over | 138 (59.7%) | 129 (39.1%) |
Disability Class by Sex by Age in Indian Hills
Disability Class: Hearing Difficulty
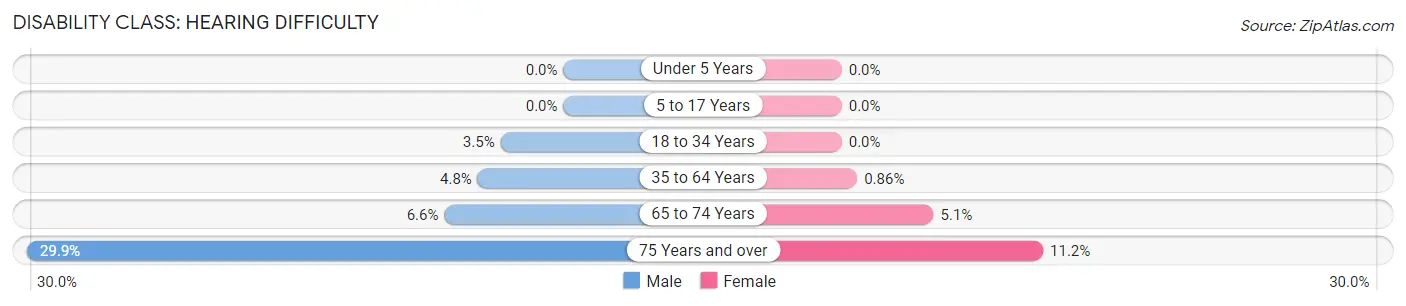
| Age Bracket | Male | Female |
| Under 5 Years | 0 (0.0%) | 0 (0.0%) |
| 5 to 17 Years | 0 (0.0%) | 0 (0.0%) |
| 18 to 34 Years | 18 (3.5%) | 0 (0.0%) |
| 35 to 64 Years | 52 (4.8%) | 11 (0.9%) |
| 65 to 74 Years | 32 (6.6%) | 24 (5.1%) |
| 75 Years and over | 69 (29.9%) | 37 (11.2%) |
Disability Class: Vision Difficulty
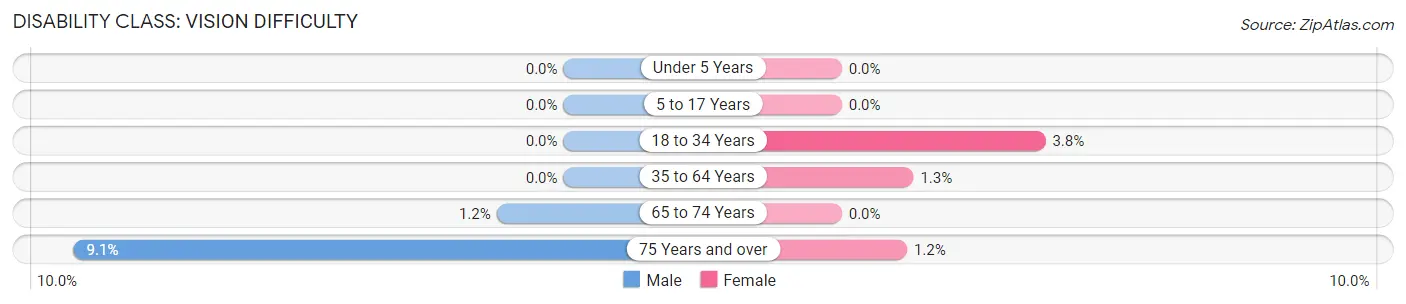
| Age Bracket | Male | Female |
| Under 5 Years | 0 (0.0%) | 0 (0.0%) |
| 5 to 17 Years | 0 (0.0%) | 0 (0.0%) |
| 18 to 34 Years | 0 (0.0%) | 19 (3.8%) |
| 35 to 64 Years | 0 (0.0%) | 17 (1.3%) |
| 65 to 74 Years | 6 (1.2%) | 0 (0.0%) |
| 75 Years and over | 21 (9.1%) | 4 (1.2%) |
Disability Class: Cognitive Difficulty
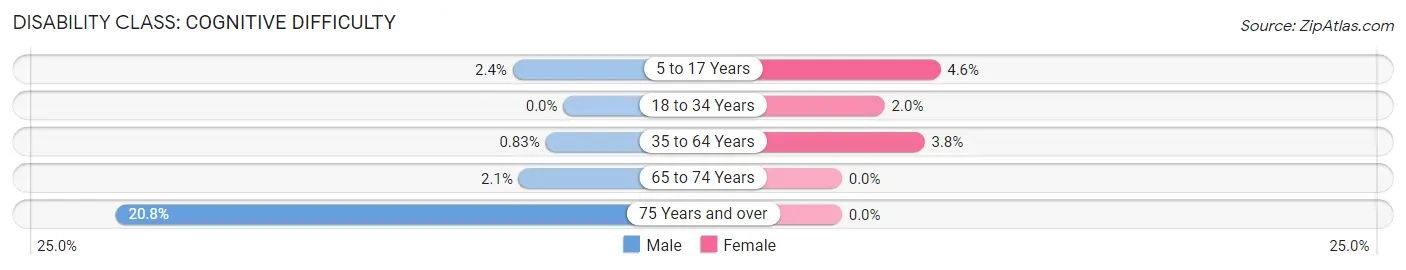
| Age Bracket | Male | Female |
| 5 to 17 Years | 9 (2.4%) | 17 (4.6%) |
| 18 to 34 Years | 0 (0.0%) | 10 (2.0%) |
| 35 to 64 Years | 9 (0.8%) | 49 (3.8%) |
| 65 to 74 Years | 10 (2.1%) | 0 (0.0%) |
| 75 Years and over | 48 (20.8%) | 0 (0.0%) |
Disability Class: Ambulatory Difficulty
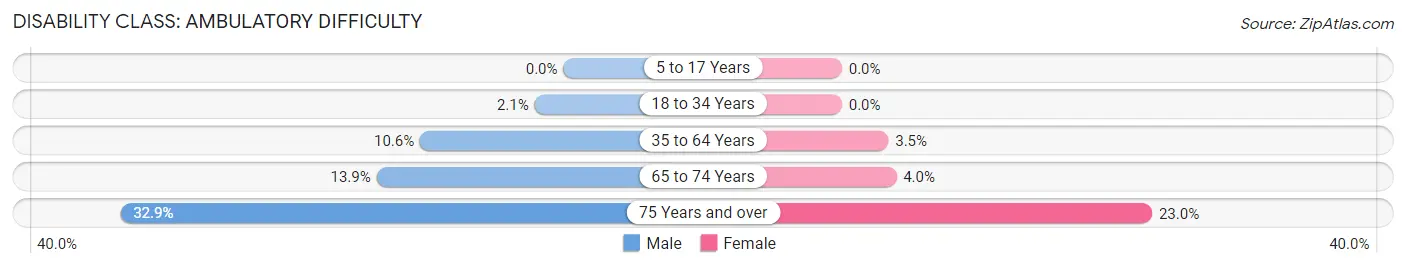
| Age Bracket | Male | Female |
| 5 to 17 Years | 0 (0.0%) | 0 (0.0%) |
| 18 to 34 Years | 11 (2.1%) | 0 (0.0%) |
| 35 to 64 Years | 116 (10.6%) | 44 (3.5%) |
| 65 to 74 Years | 67 (13.9%) | 19 (4.0%) |
| 75 Years and over | 76 (32.9%) | 76 (23.0%) |
Disability Class: Self-Care Difficulty
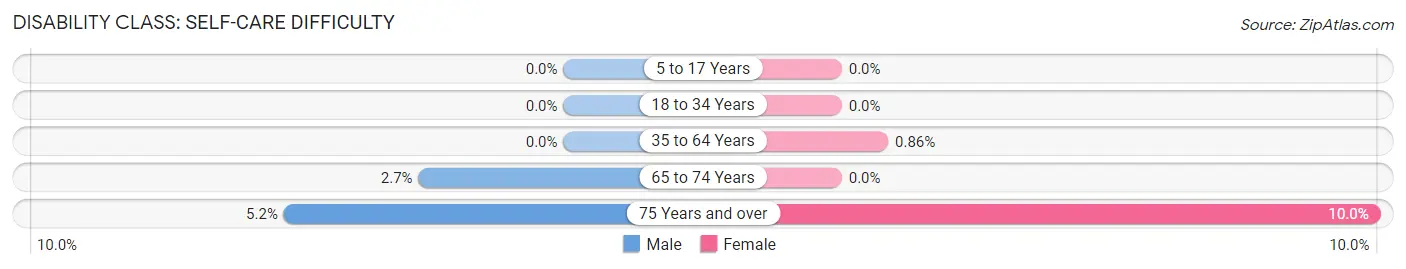
| Age Bracket | Male | Female |
| 5 to 17 Years | 0 (0.0%) | 0 (0.0%) |
| 18 to 34 Years | 0 (0.0%) | 0 (0.0%) |
| 35 to 64 Years | 0 (0.0%) | 11 (0.9%) |
| 65 to 74 Years | 13 (2.7%) | 0 (0.0%) |
| 75 Years and over | 12 (5.2%) | 33 (10.0%) |
Technology Access in Indian Hills
Computing Device Access in Indian Hills
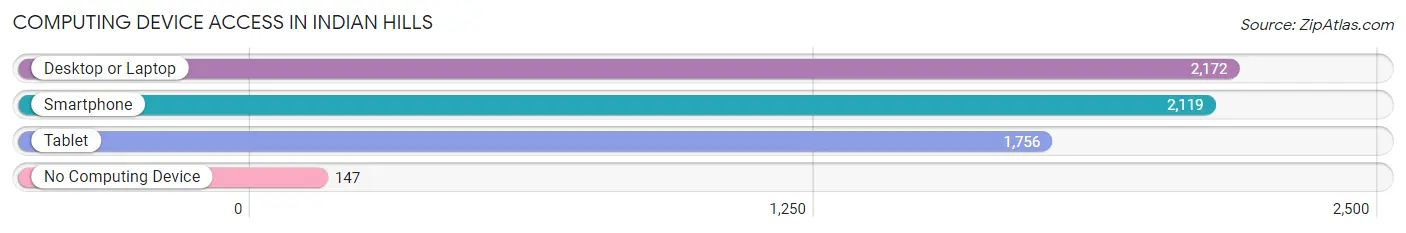
| Device Type | # Households | % Households |
| Desktop or Laptop | 2,172 | 85.8% |
| Smartphone | 2,119 | 83.7% |
| Tablet | 1,756 | 69.4% |
| No Computing Device | 147 | 5.8% |
| Total | 2,531 | 100.0% |
Internet Access in Indian Hills
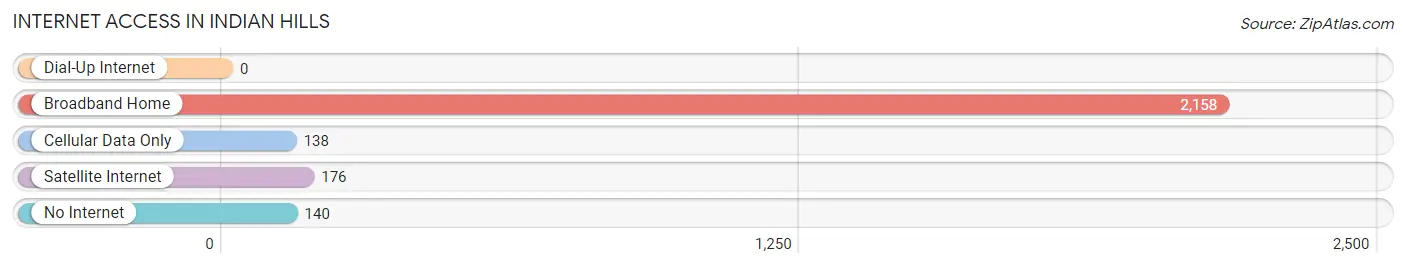
| Internet Type | # Households | % Households |
| Dial-Up Internet | 0 | 0.0% |
| Broadband Home | 2,158 | 85.3% |
| Cellular Data Only | 138 | 5.4% |
| Satellite Internet | 176 | 7.0% |
| No Internet | 140 | 5.5% |
| Total | 2,531 | 100.0% |
Indian Hills Summary
History
Indian Hills is an unincorporated town located in Douglas County, Nevada. It is situated in the Carson Valley, approximately 8 miles south of Gardnerville and 8 miles east of Minden. The town was founded in the late 1800s by a group of Native Americans who were looking for a place to settle and raise their families. The area was originally known as "Indian Hills" due to the presence of the Native American population.
The first settlers in the area were miners who were looking for gold and silver. The town was officially established in 1883 and was named after the Native American population. The town quickly grew and by the early 1900s, it had become a popular destination for tourists and travelers.
The town was also home to a number of businesses, including a hotel, a general store, a post office, and a saloon. The town was also home to a number of churches, including the Indian Hills Methodist Church, which was established in 1885.
In the early 1900s, the town was home to a number of ranches and farms. The town was also home to a number of schools, including the Indian Hills School, which was established in 1887.
The town was also home to a number of businesses, including a hotel, a general store, a post office, and a saloon. The town was also home to a number of churches, including the Indian Hills Methodist Church, which was established in 1885.
In the late 1900s, the town began to decline as the mining industry in the area began to decline. The town was also affected by the Great Depression, which caused many of the businesses in the town to close.
Geography
Indian Hills is located in Douglas County, Nevada. It is situated in the Carson Valley, approximately 8 miles south of Gardnerville and 8 miles east of Minden. The town is located at an elevation of 4,890 feet above sea level.
The town is located in a semi-arid climate, with hot summers and cold winters. The average annual temperature is around 50 degrees Fahrenheit. The average annual precipitation is around 8 inches.
Economy
The economy of Indian Hills is largely based on tourism and agriculture. The town is home to a number of tourist attractions, including the Indian Hills Museum, which is dedicated to the history of the town and the surrounding area. The town is also home to a number of wineries, which produce a variety of wines.
The town is also home to a number of agricultural businesses, including cattle ranches, alfalfa farms, and hay farms. The town is also home to a number of businesses, including a hotel, a general store, a post office, and a saloon.
Demographics
As of the 2010 census, the population of Indian Hills was 1,845. The racial makeup of the town was 94.3% White, 0.7% African American, 0.3% Native American, 0.2% Asian, 0.1% Pacific Islander, and 4.4% from other races. The median household income was $45,000. The per capita income was $20,000.
Conclusion
Indian Hills is an unincorporated town located in Douglas County, Nevada. It is situated in the Carson Valley, approximately 8 miles south of Gardnerville and 8 miles east of Minden. The town was founded in the late 1800s by a group of Native Americans who were looking for a place to settle and raise their families. The town is home to a number of tourist attractions, including the Indian Hills Museum, which is dedicated to the history of the town and the surrounding area. The town is also home to a number of agricultural businesses, including cattle ranches, alfalfa farms, and hay farms. As of the 2010 census, the population of Indian Hills was 1,845. The racial makeup of the town was 94.3% White, 0.7% African American, 0.3% Native American, 0.2% Asian, 0.1% Pacific Islander, and 4.4% from other races. The median household income was $45,000. The per capita income was $20,000.
Common Questions
What is the Total Population of Indian Hills?
Total Population of Indian Hills is 5,955.
What is the Total Male Population of Indian Hills?
Total Male Population of Indian Hills is 2,811.
What is the Total Female Population of Indian Hills?
Total Female Population of Indian Hills is 3,144.
What is the Ratio of Males per 100 Females in Indian Hills?
There are 89.41 Males per 100 Females in Indian Hills.
What is the Ratio of Females per 100 Males in Indian Hills?
There are 111.85 Females per 100 Males in Indian Hills.
What is the Median Population Age in Indian Hills?
Median Population Age in Indian Hills is 49.0 Years.
What is the Average Family Size in Indian Hills
Average Family Size in Indian Hills is 2.7 People.
What is the Average Household Size in Indian Hills
Average Household Size in Indian Hills is 2.4 People.
What is Per Capita Income in Indian Hills?
Per Capita income in Indian Hills is $40,502.
What is the Median Family Income in Indian Hills?
Median Family Income in Indian Hills is $91,304.
What is the Median Household income in Indian Hills?
Median Household Income in Indian Hills is $77,256.
What is Income or Wage Gap in Indian Hills?
Income or Wage Gap in Indian Hills is 21.3%.
Women in Indian Hills earn 78.7 cents for every dollar earned by a man.
What is Family Income Deficit in Indian Hills?
Family Income Deficit in Indian Hills is $9,773.
Families that are below poverty line in Indian Hills earn $9,773 less on average than the poverty threshold level.
What is Inequality or Gini Index in Indian Hills?
Inequality or Gini Index in Indian Hills is 0.38.
How Large is the Labor Force in Indian Hills?
There are 2,965 People in the Labor Forcein in Indian Hills.
What is the Percentage of People in the Labor Force in Indian Hills?
58.6% of People are in the Labor Force in Indian Hills.
What is the Unemployment Rate in Indian Hills?
Unemployment Rate in Indian Hills is 2.5%.