Zip Codes with the Highest Percentage of Population Employed in Architecture & Engineering in Saint Charles, MO
RELATED REPORTS & OPTIONS
Architecture & Engineering
Saint Charles
Compare Zip Codes
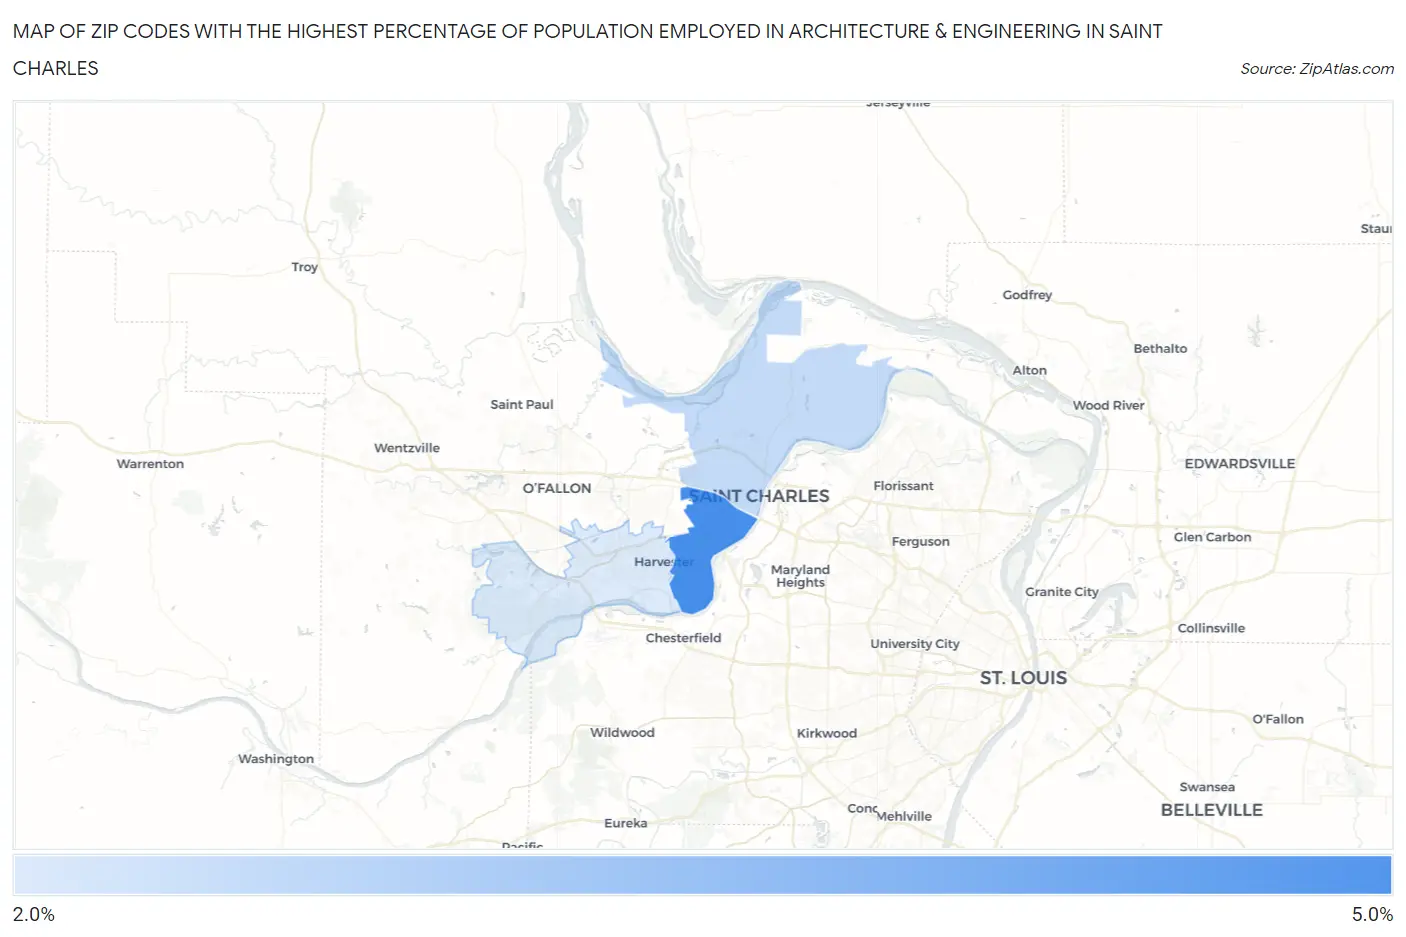
Map of Zip Codes with the Highest Percentage of Population Employed in Architecture & Engineering in Saint Charles
0.0%
5.0%
Zip Codes with the Highest Percentage of Population Employed in Architecture & Engineering in Saint Charles, MO
| Zip Code | % Employed | vs State | vs National | |
| 1. | 63303 | 4.7% | 1.7%(+3.01)#35 | 2.1%(+2.56)#1,922 |
| 2. | 63301 | 2.9% | 1.7%(+1.23)#86 | 2.1%(+0.787)#5,296 |
| 3. | 63304 | 2.6% | 1.7%(+0.857)#127 | 2.1%(+0.412)#6,739 |
1
Common Questions
What are the Top Zip Codes with the Highest Percentage of Population Employed in Architecture & Engineering in Saint Charles, MO?
Top Zip Codes with the Highest Percentage of Population Employed in Architecture & Engineering in Saint Charles, MO are:
What zip code has the Highest Percentage of Population Employed in Architecture & Engineering in Saint Charles, MO?
63303 has the Highest Percentage of Population Employed in Architecture & Engineering in Saint Charles, MO with 4.7%.
What is the Percentage of Population Employed in Architecture & Engineering in Missouri?
Percentage of Population Employed in Architecture & Engineering in Missouri is 1.7%.
What is the Percentage of Population Employed in Architecture & Engineering in the United States?
Percentage of Population Employed in Architecture & Engineering in the United States is 2.1%.