Zip Codes with the Highest Percentage of Population with a Degree in Liberal Arts and History in Battle Creek, MI
RELATED REPORTS & OPTIONS
Liberal Arts and History
Battle Creek
Compare Zip Codes
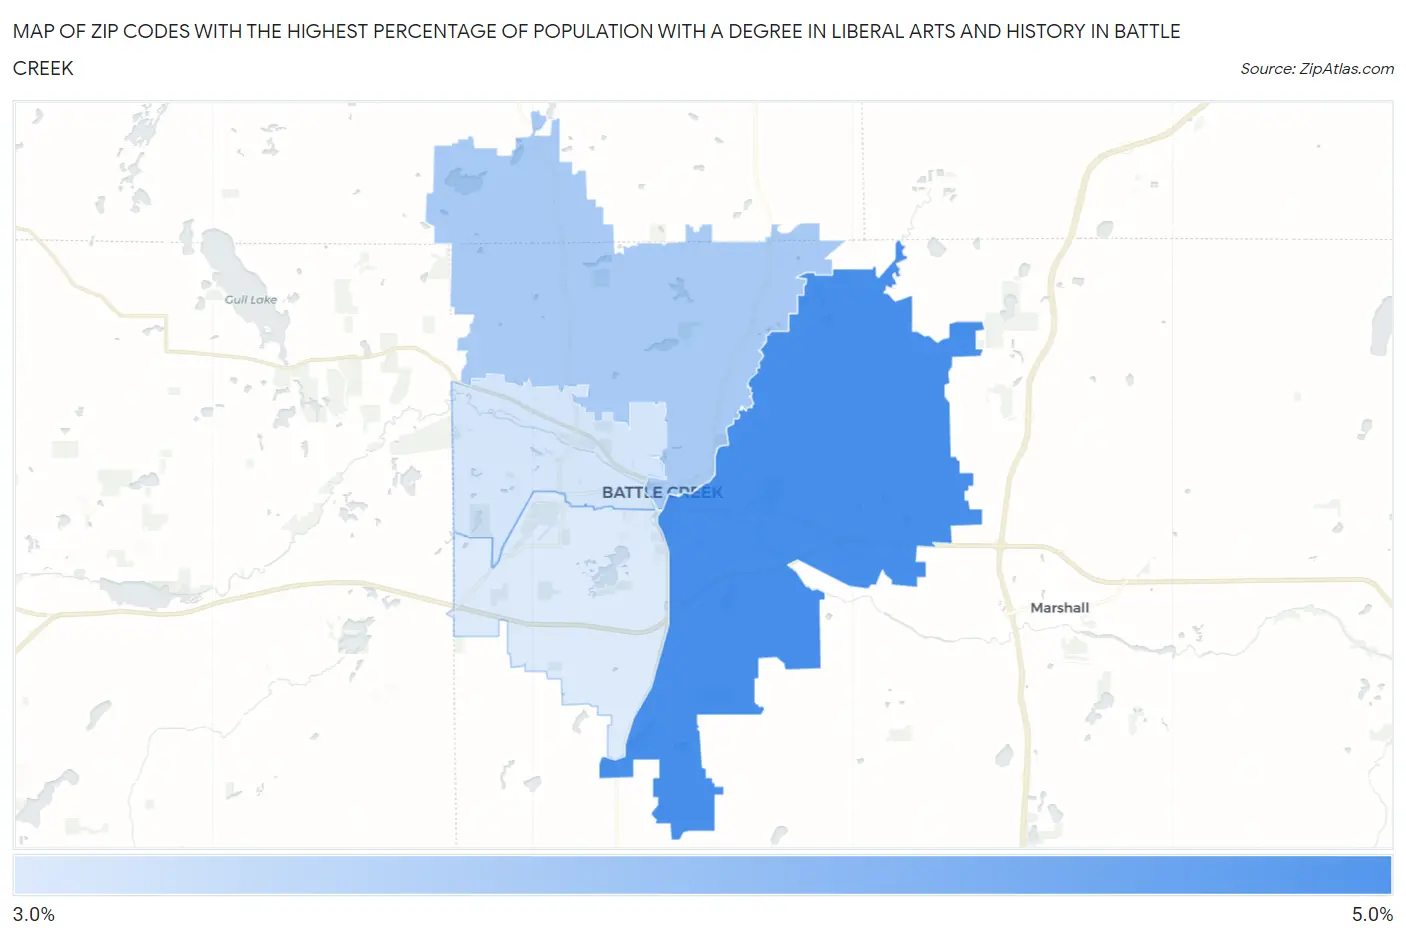
Map of Zip Codes with the Highest Percentage of Population with a Degree in Liberal Arts and History in Battle Creek
0.0%
5.0%
Zip Codes with the Highest Percentage of Population with a Degree in Liberal Arts and History in Battle Creek, MI
| Zip Code | % Graduates | vs State | vs National | |
| 1. | 49014 | 5.0% | 4.0%(+1.01)#285 | 4.9%(+0.124)#11,371 |
| 2. | 49017 | 3.7% | 4.0%(-0.272)#454 | 4.9%(-1.16)#15,848 |
| 3. | 49037 | 3.1% | 4.0%(-0.841)#562 | 4.9%(-1.73)#17,858 |
| 4. | 49015 | 3.0% | 4.0%(-0.976)#588 | 4.9%(-1.87)#18,340 |
1
Common Questions
What are the Top 3 Zip Codes with the Highest Percentage of Population with a Degree in Liberal Arts and History in Battle Creek, MI?
Top 3 Zip Codes with the Highest Percentage of Population with a Degree in Liberal Arts and History in Battle Creek, MI are:
What zip code has the Highest Percentage of Population with a Degree in Liberal Arts and History in Battle Creek, MI?
49014 has the Highest Percentage of Population with a Degree in Liberal Arts and History in Battle Creek, MI with 5.0%.
What is the Percentage of Population with a Degree in Liberal Arts and History in Battle Creek, MI?
Percentage of Population with a Degree in Liberal Arts and History in Battle Creek is 3.5%.
What is the Percentage of Population with a Degree in Liberal Arts and History in Michigan?
Percentage of Population with a Degree in Liberal Arts and History in Michigan is 4.0%.
What is the Percentage of Population with a Degree in Liberal Arts and History in the United States?
Percentage of Population with a Degree in Liberal Arts and History in the United States is 4.9%.