Zip Codes with the Highest Percentage of Households Without a Vehicle in Battle Creek, MI
RELATED REPORTS & OPTIONS
Households without a Cars
Battle Creek
Compare Zip Codes
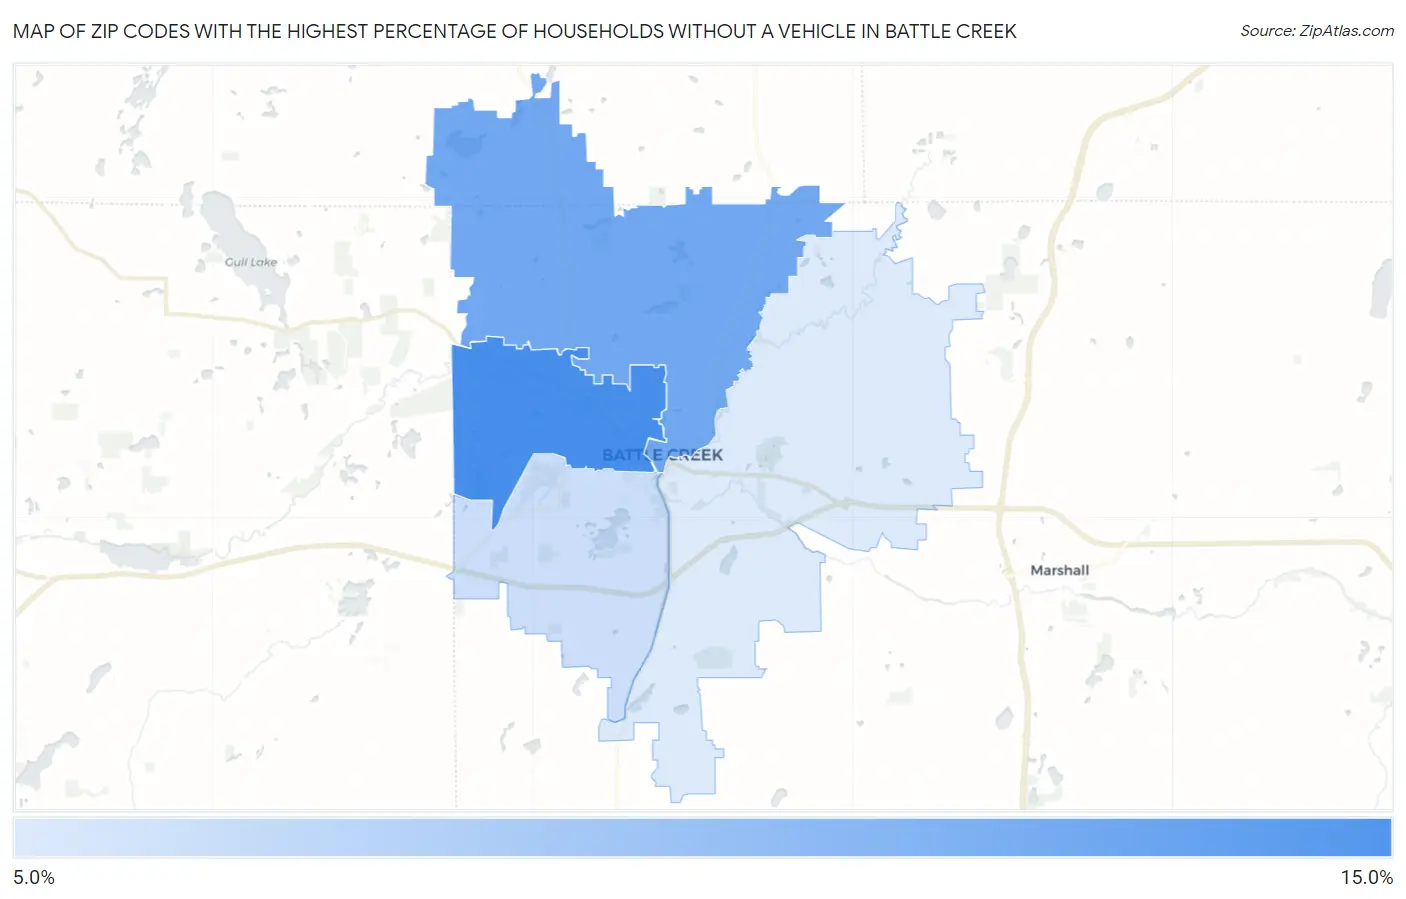
Map of Zip Codes with the Highest Percentage of Households Without a Vehicle in Battle Creek
0.0%
15.0%
Zip Codes with the Highest Percentage of Households Without a Vehicle in Battle Creek, MI
| Zip Code | Housholds Without a Car | vs State | vs National | |
| 1. | 49037 | 11.5% | 7.2%(+4.30)#89 | 8.3%(+3.20)#3,828 |
| 2. | 49017 | 9.9% | 7.2%(+2.70)#127 | 8.3%(+1.60)#4,945 |
| 3. | 49015 | 6.6% | 7.2%(-0.600)#276 | 8.3%(-1.70)#9,201 |
| 4. | 49014 | 5.9% | 7.2%(-1.30)#339 | 8.3%(-2.40)#10,702 |
1
Common Questions
What are the Top 3 Zip Codes with the Highest Percentage of Households Without a Vehicle in Battle Creek, MI?
Top 3 Zip Codes with the Highest Percentage of Households Without a Vehicle in Battle Creek, MI are:
What zip code has the Highest Percentage of Households Without a Vehicle in Battle Creek, MI?
49037 has the Highest Percentage of Households Without a Vehicle in Battle Creek, MI with 11.5%.
What is the Percentage of Households Without a Vehicle in Battle Creek, MI?
Percentage of Households Without a Vehicle in Battle Creek is 11.4%.
What is the Percentage of Households Without a Vehicle in Michigan?
Percentage of Households Without a Vehicle in Michigan is 7.2%.
What is the Percentage of Households Without a Vehicle in the United States?
Percentage of Households Without a Vehicle in the United States is 8.3%.