Zip Codes with the Highest Percentage of Population Employed in Legal Services & Support in Battle Creek, MI
RELATED REPORTS & OPTIONS
Legal Services & Support
Battle Creek
Compare Zip Codes
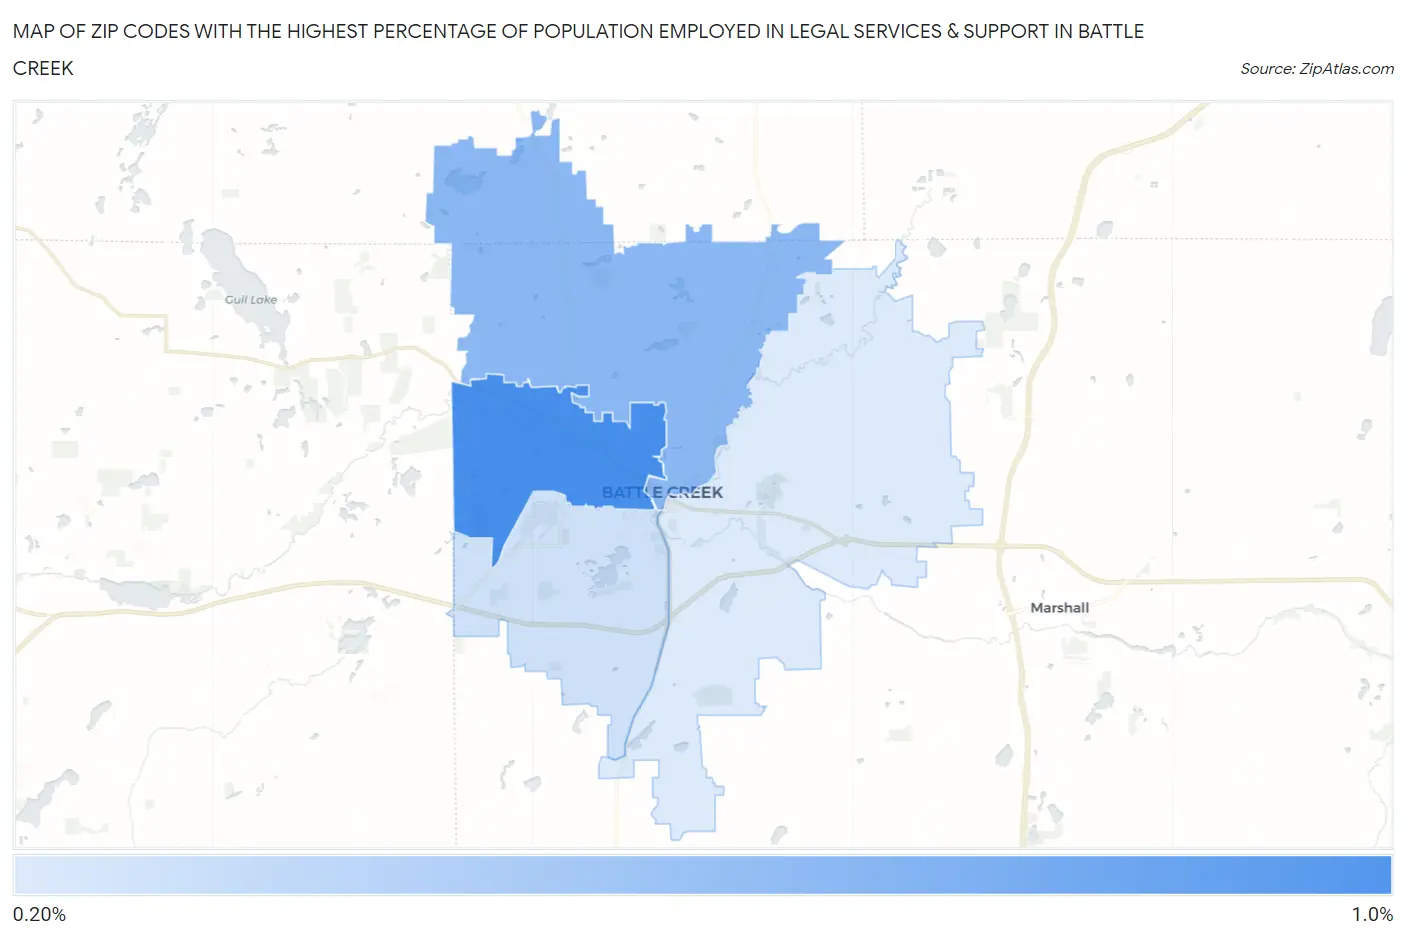
Map of Zip Codes with the Highest Percentage of Population Employed in Legal Services & Support in Battle Creek
0.0%
1.0%
Zip Codes with the Highest Percentage of Population Employed in Legal Services & Support in Battle Creek, MI
| Zip Code | % Employed | vs State | vs National | |
| 1. | 49037 | 0.83% | 0.89%(-0.059)#251 | 1.2%(-0.358)#9,222 |
| 2. | 49017 | 0.57% | 0.89%(-0.314)#352 | 1.2%(-0.612)#11,790 |
| 3. | 49015 | 0.31% | 0.89%(-0.571)#475 | 1.2%(-0.869)#14,863 |
| 4. | 49014 | 0.26% | 0.89%(-0.623)#510 | 1.2%(-0.921)#15,486 |
1
Common Questions
What are the Top 3 Zip Codes with the Highest Percentage of Population Employed in Legal Services & Support in Battle Creek, MI?
Top 3 Zip Codes with the Highest Percentage of Population Employed in Legal Services & Support in Battle Creek, MI are:
What zip code has the Highest Percentage of Population Employed in Legal Services & Support in Battle Creek, MI?
49037 has the Highest Percentage of Population Employed in Legal Services & Support in Battle Creek, MI with 0.83%.
What is the Percentage of Population Employed in Legal Services & Support in Battle Creek, MI?
Percentage of Population Employed in Legal Services & Support in Battle Creek is 0.34%.
What is the Percentage of Population Employed in Legal Services & Support in Michigan?
Percentage of Population Employed in Legal Services & Support in Michigan is 0.89%.
What is the Percentage of Population Employed in Legal Services & Support in the United States?
Percentage of Population Employed in Legal Services & Support in the United States is 1.2%.