Zip Codes with the Highest Percentage of Population with a Degree in Liberal Arts and History in Howell, MI
RELATED REPORTS & OPTIONS
Liberal Arts and History
Howell
Compare Zip Codes
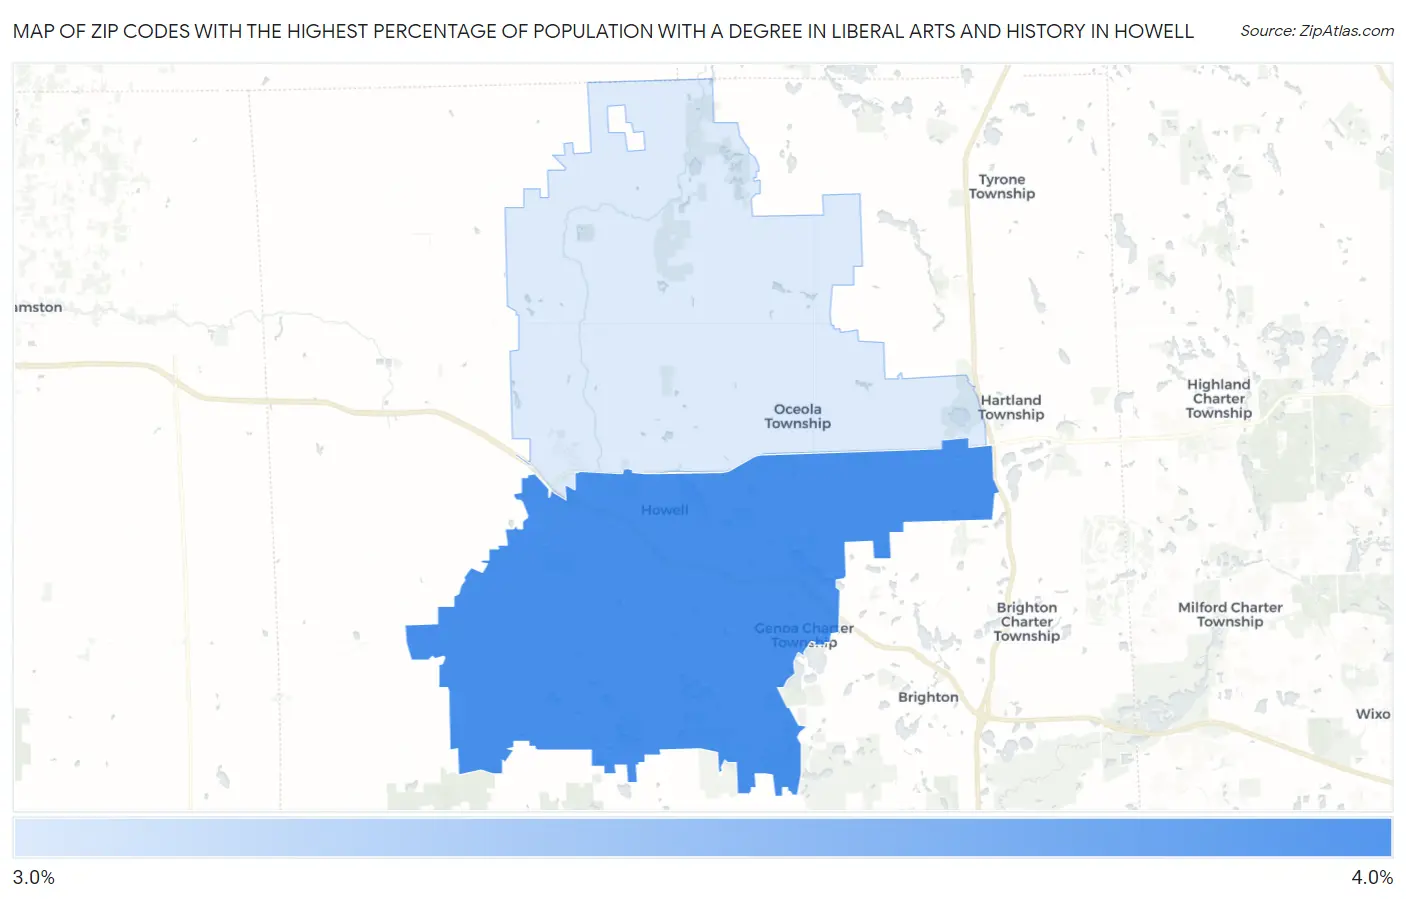
Map of Zip Codes with the Highest Percentage of Population with a Degree in Liberal Arts and History in Howell
0.0%
4.0%
Zip Codes with the Highest Percentage of Population with a Degree in Liberal Arts and History in Howell, MI
| Zip Code | % Graduates | vs State | vs National | |
| 1. | 48843 | 3.8% | 4.0%(-0.138)#432 | 4.9%(-1.03)#15,372 |
| 2. | 48855 | 3.2% | 4.0%(-0.743)#545 | 4.9%(-1.63)#17,527 |
1
Common Questions
What are the Top Zip Codes with the Highest Percentage of Population with a Degree in Liberal Arts and History in Howell, MI?
Top Zip Codes with the Highest Percentage of Population with a Degree in Liberal Arts and History in Howell, MI are:
What zip code has the Highest Percentage of Population with a Degree in Liberal Arts and History in Howell, MI?
48843 has the Highest Percentage of Population with a Degree in Liberal Arts and History in Howell, MI with 3.8%.
What is the Percentage of Population with a Degree in Liberal Arts and History in Howell, MI?
Percentage of Population with a Degree in Liberal Arts and History in Howell is 5.4%.
What is the Percentage of Population with a Degree in Liberal Arts and History in Michigan?
Percentage of Population with a Degree in Liberal Arts and History in Michigan is 4.0%.
What is the Percentage of Population with a Degree in Liberal Arts and History in the United States?
Percentage of Population with a Degree in Liberal Arts and History in the United States is 4.9%.