Zip Codes with the Highest Percentage of Population with a Degree in Liberal Arts and History in Clarkston, MI
RELATED REPORTS & OPTIONS
Liberal Arts and History
Clarkston
Compare Zip Codes
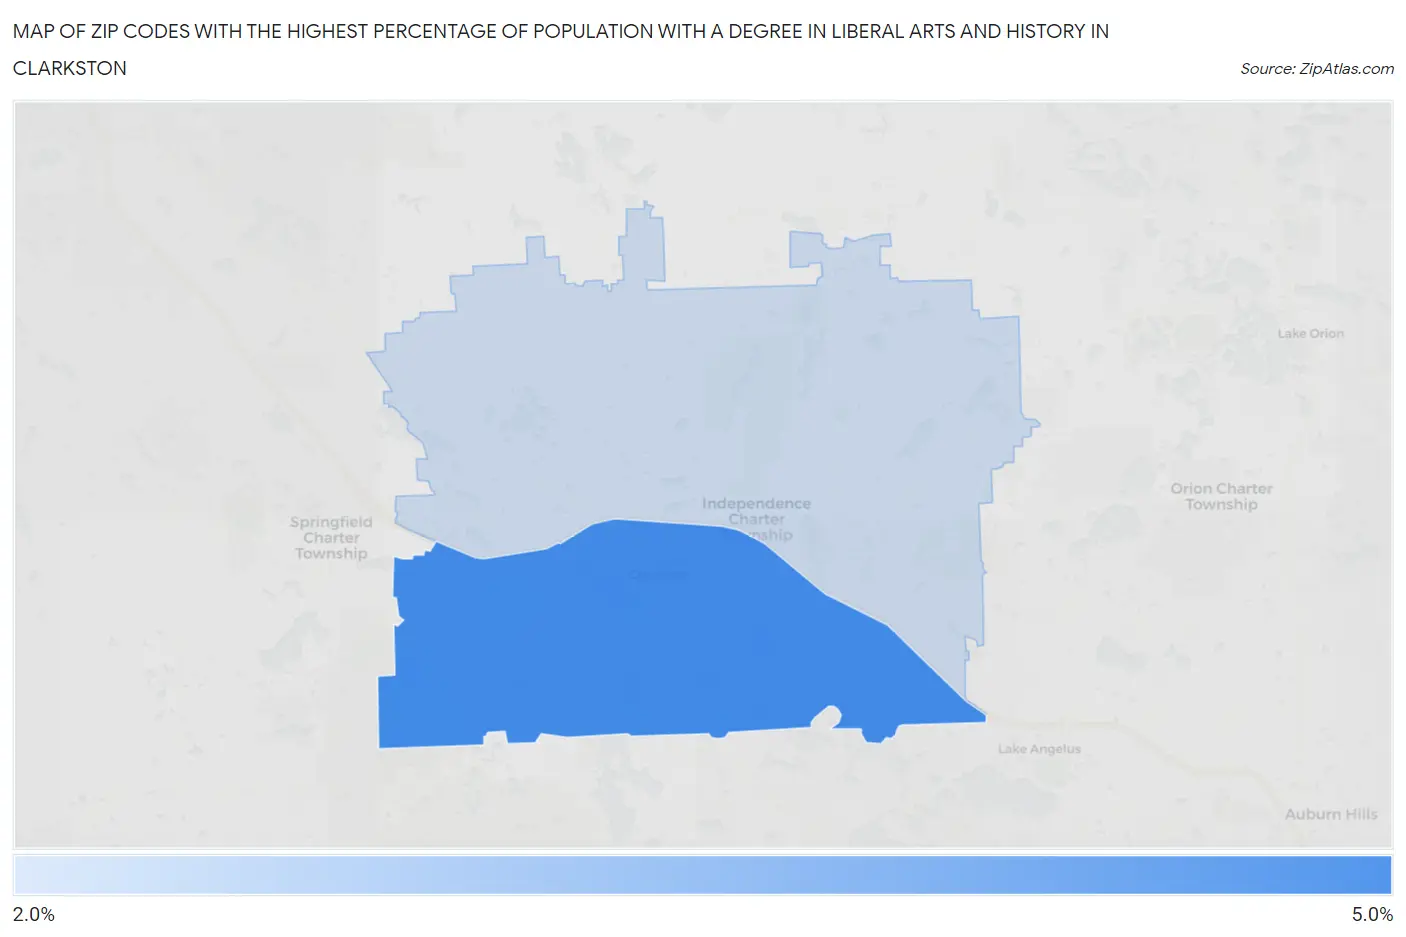
Map of Zip Codes with the Highest Percentage of Population with a Degree in Liberal Arts and History in Clarkston
0.0%
5.0%
Zip Codes with the Highest Percentage of Population with a Degree in Liberal Arts and History in Clarkston, MI
| Zip Code | % Graduates | vs State | vs National | |
| 1. | 48346 | 4.1% | 4.0%(+0.070)#406 | 4.9%(-0.820)#14,576 |
| 2. | 48348 | 2.3% | 4.0%(-1.72)#698 | 4.9%(-2.61)#20,661 |
1
Common Questions
What are the Top Zip Codes with the Highest Percentage of Population with a Degree in Liberal Arts and History in Clarkston, MI?
Top Zip Codes with the Highest Percentage of Population with a Degree in Liberal Arts and History in Clarkston, MI are:
What zip code has the Highest Percentage of Population with a Degree in Liberal Arts and History in Clarkston, MI?
48346 has the Highest Percentage of Population with a Degree in Liberal Arts and History in Clarkston, MI with 4.1%.
What is the Percentage of Population with a Degree in Liberal Arts and History in Michigan?
Percentage of Population with a Degree in Liberal Arts and History in Michigan is 4.0%.
What is the Percentage of Population with a Degree in Liberal Arts and History in the United States?
Percentage of Population with a Degree in Liberal Arts and History in the United States is 4.9%.