Zip Codes with the Highest Percentage of Population with a Degree in Liberal Arts and History in Waterford, MI
RELATED REPORTS & OPTIONS
Liberal Arts and History
Waterford
Compare Zip Codes
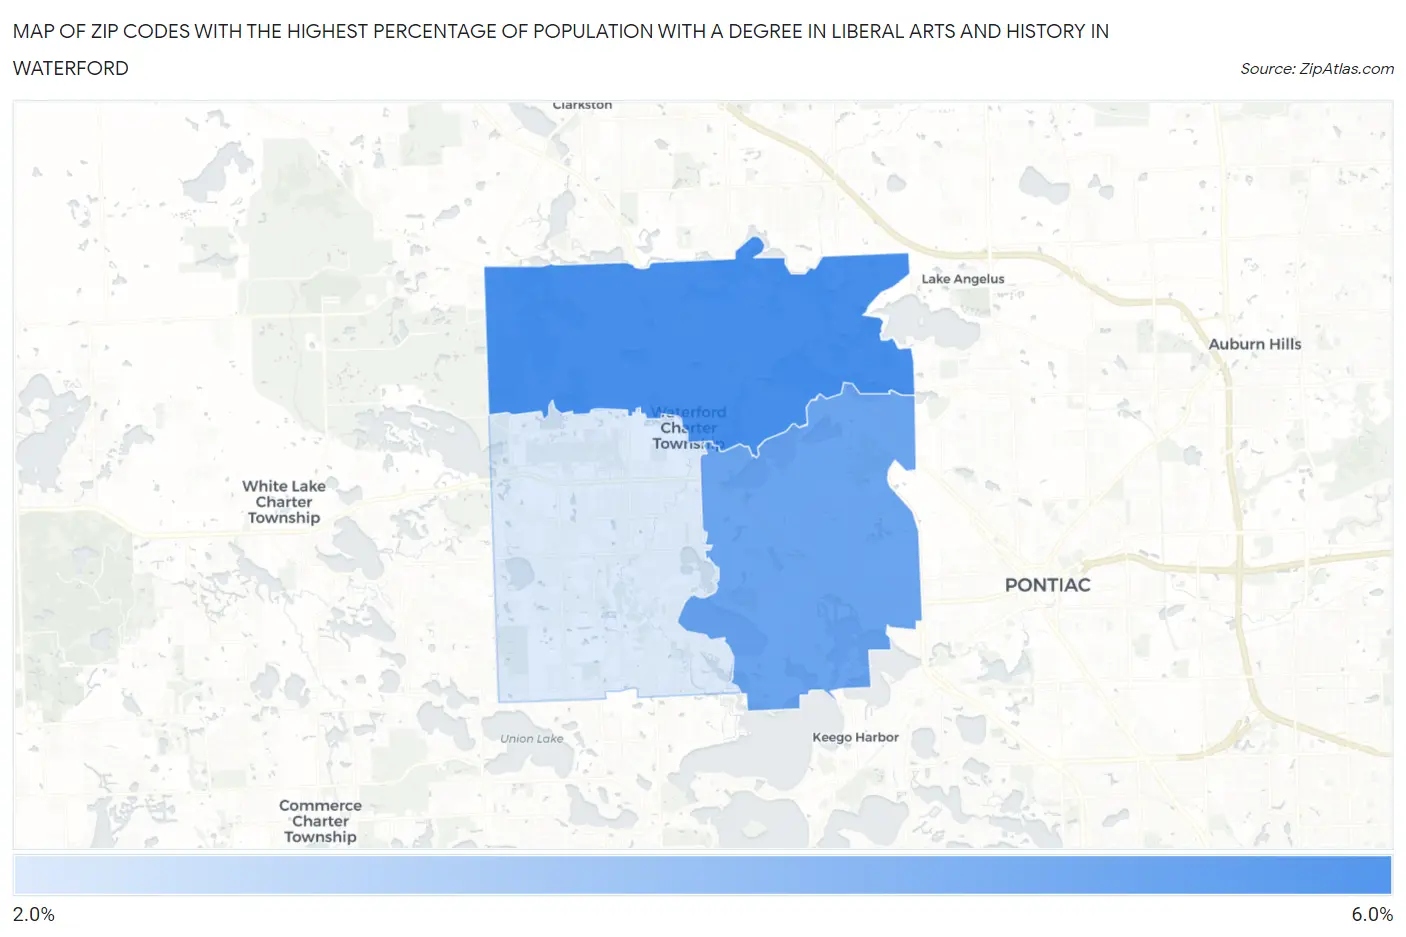
Map of Zip Codes with the Highest Percentage of Population with a Degree in Liberal Arts and History in Waterford
0.0%
6.0%
Zip Codes with the Highest Percentage of Population with a Degree in Liberal Arts and History in Waterford, MI
| Zip Code | % Graduates | vs State | vs National | |
| 1. | 48329 | 5.5% | 4.0%(+1.47)#239 | 4.9%(+0.580)#9,994 |
| 2. | 48328 | 4.8% | 4.0%(+0.781)#311 | 4.9%(-0.109)#12,083 |
| 3. | 48327 | 2.7% | 4.0%(-1.29)#628 | 4.9%(-2.18)#19,369 |
1
Common Questions
What are the Top Zip Codes with the Highest Percentage of Population with a Degree in Liberal Arts and History in Waterford, MI?
Top Zip Codes with the Highest Percentage of Population with a Degree in Liberal Arts and History in Waterford, MI are:
What zip code has the Highest Percentage of Population with a Degree in Liberal Arts and History in Waterford, MI?
48329 has the Highest Percentage of Population with a Degree in Liberal Arts and History in Waterford, MI with 5.5%.
What is the Percentage of Population with a Degree in Liberal Arts and History in Michigan?
Percentage of Population with a Degree in Liberal Arts and History in Michigan is 4.0%.
What is the Percentage of Population with a Degree in Liberal Arts and History in the United States?
Percentage of Population with a Degree in Liberal Arts and History in the United States is 4.9%.