Zip Codes with the Highest Percentage of Population with a Degree in Liberal Arts and History in Livonia, MI
RELATED REPORTS & OPTIONS
Liberal Arts and History
Livonia
Compare Zip Codes
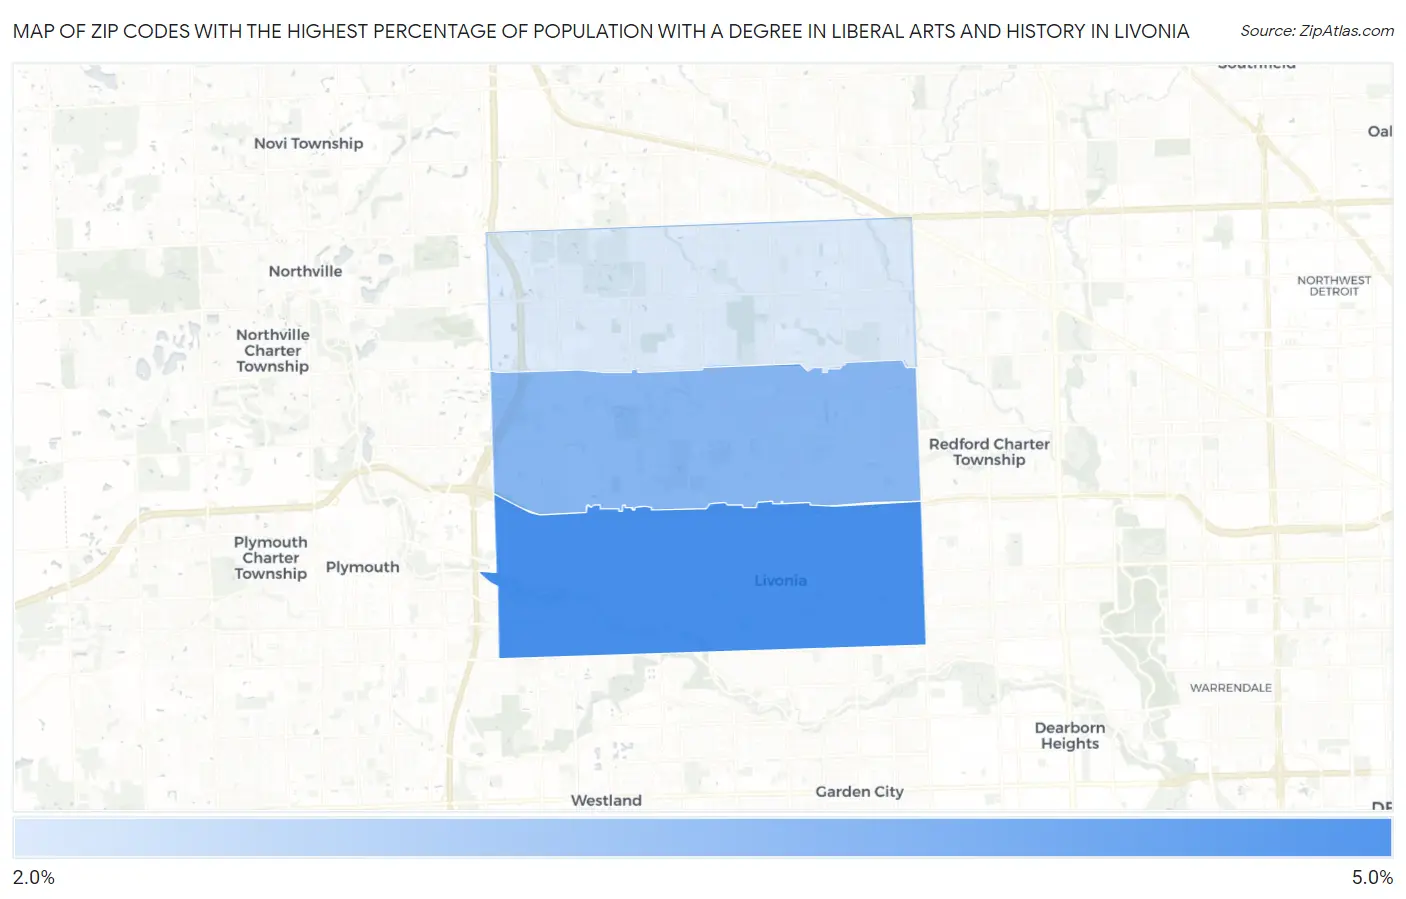
Map of Zip Codes with the Highest Percentage of Population with a Degree in Liberal Arts and History in Livonia
0.0%
5.0%
Zip Codes with the Highest Percentage of Population with a Degree in Liberal Arts and History in Livonia, MI
| Zip Code | % Graduates | vs State | vs National | |
| 1. | 48150 | 4.1% | 4.0%(+0.145)#393 | 4.9%(-0.745)#14,299 |
| 2. | 48154 | 3.5% | 4.0%(-0.508)#507 | 4.9%(-1.40)#16,687 |
| 3. | 48152 | 2.6% | 4.0%(-1.38)#639 | 4.9%(-2.27)#19,641 |
1
Common Questions
What are the Top Zip Codes with the Highest Percentage of Population with a Degree in Liberal Arts and History in Livonia, MI?
Top Zip Codes with the Highest Percentage of Population with a Degree in Liberal Arts and History in Livonia, MI are:
What zip code has the Highest Percentage of Population with a Degree in Liberal Arts and History in Livonia, MI?
48150 has the Highest Percentage of Population with a Degree in Liberal Arts and History in Livonia, MI with 4.1%.
What is the Percentage of Population with a Degree in Liberal Arts and History in Livonia, MI?
Percentage of Population with a Degree in Liberal Arts and History in Livonia is 3.3%.
What is the Percentage of Population with a Degree in Liberal Arts and History in Michigan?
Percentage of Population with a Degree in Liberal Arts and History in Michigan is 4.0%.
What is the Percentage of Population with a Degree in Liberal Arts and History in the United States?
Percentage of Population with a Degree in Liberal Arts and History in the United States is 4.9%.