Zip Codes with the Highest Percentage of Population with a Degree in Liberal Arts and History in Warren, MI
RELATED REPORTS & OPTIONS
Liberal Arts and History
Warren
Compare Zip Codes
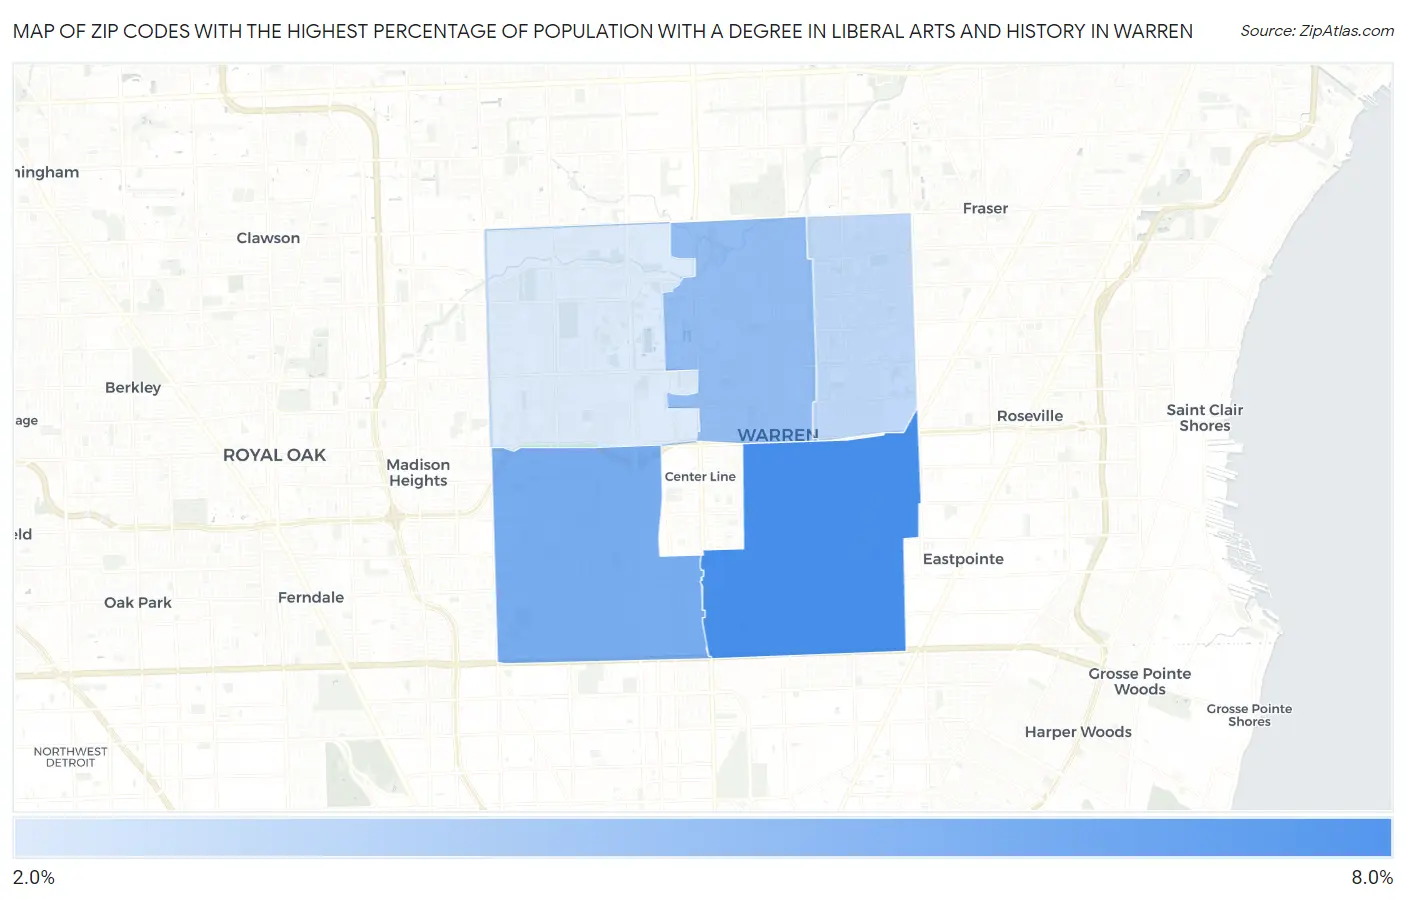
Map of Zip Codes with the Highest Percentage of Population with a Degree in Liberal Arts and History in Warren
0.0%
8.0%
Zip Codes with the Highest Percentage of Population with a Degree in Liberal Arts and History in Warren, MI
| Zip Code | % Graduates | vs State | vs National | |
| 1. | 48089 | 7.5% | 4.0%(+3.56)#116 | 4.9%(+2.67)#5,530 |
| 2. | 48091 | 5.8% | 4.0%(+1.84)#211 | 4.9%(+0.946)#8,992 |
| 3. | 48093 | 4.9% | 4.0%(+0.887)#300 | 4.9%(-0.003)#11,756 |
| 4. | 48088 | 3.4% | 4.0%(-0.533)#512 | 4.9%(-1.42)#16,786 |
| 5. | 48092 | 2.4% | 4.0%(-1.57)#674 | 4.9%(-2.46)#20,237 |
1
Common Questions
What are the Top 3 Zip Codes with the Highest Percentage of Population with a Degree in Liberal Arts and History in Warren, MI?
Top 3 Zip Codes with the Highest Percentage of Population with a Degree in Liberal Arts and History in Warren, MI are:
What zip code has the Highest Percentage of Population with a Degree in Liberal Arts and History in Warren, MI?
48089 has the Highest Percentage of Population with a Degree in Liberal Arts and History in Warren, MI with 7.5%.
What is the Percentage of Population with a Degree in Liberal Arts and History in Warren, MI?
Percentage of Population with a Degree in Liberal Arts and History in Warren is 4.4%.
What is the Percentage of Population with a Degree in Liberal Arts and History in Michigan?
Percentage of Population with a Degree in Liberal Arts and History in Michigan is 4.0%.
What is the Percentage of Population with a Degree in Liberal Arts and History in the United States?
Percentage of Population with a Degree in Liberal Arts and History in the United States is 4.9%.