Zip Codes with the Highest Percentage of Population Employed in Accommodation & Food Services in Battle Creek, MI
RELATED REPORTS & OPTIONS
Accommodation & Food Services
Battle Creek
Compare Zip Codes
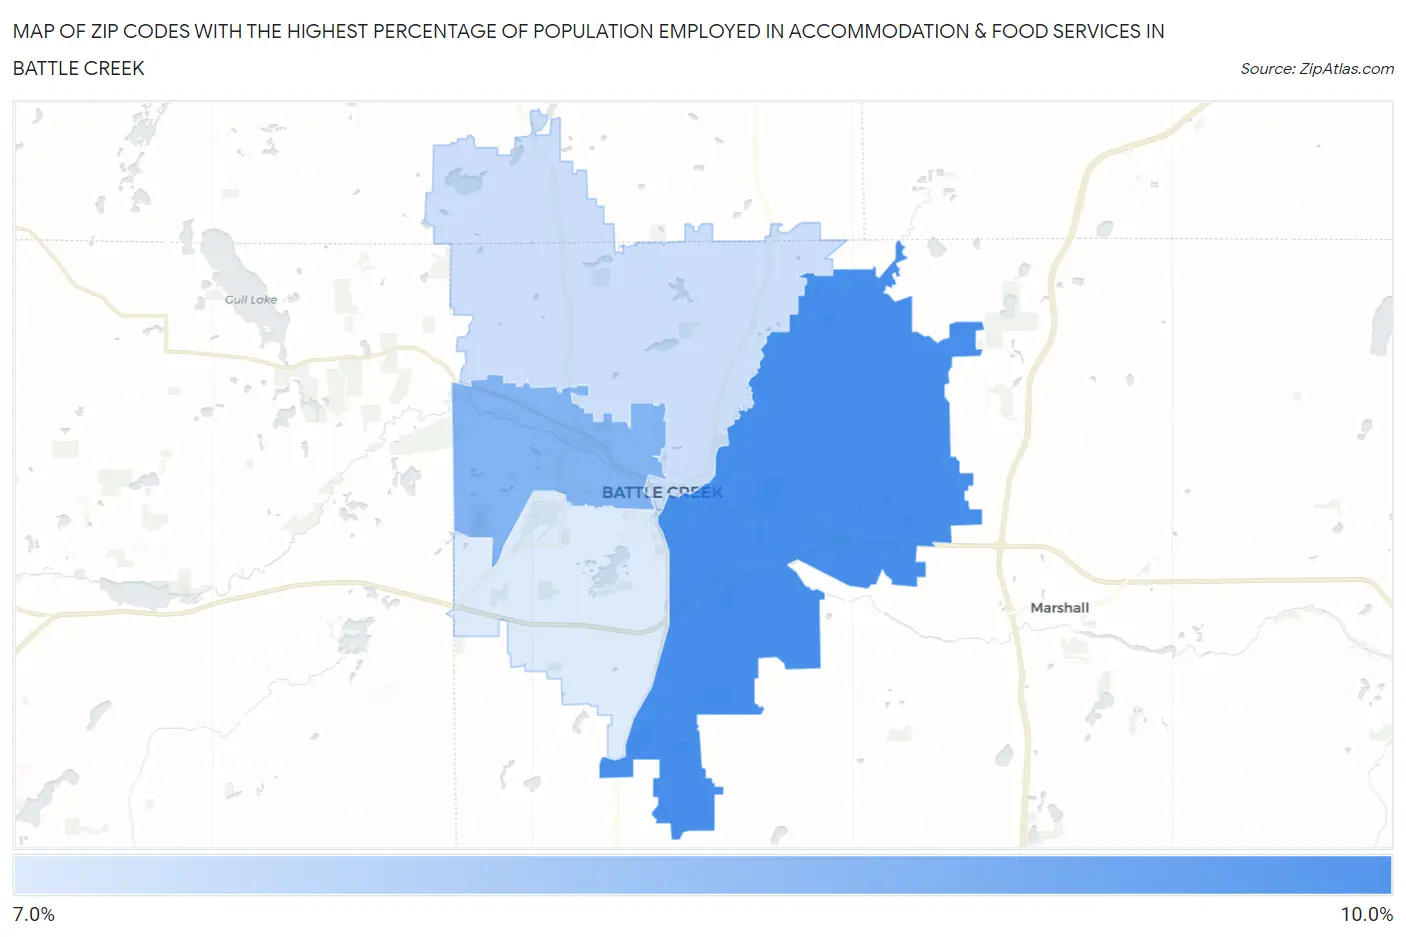
Map of Zip Codes with the Highest Percentage of Population Employed in Accommodation & Food Services in Battle Creek
0.0%
10.0%
Zip Codes with the Highest Percentage of Population Employed in Accommodation & Food Services in Battle Creek, MI
| Zip Code | % Employed | vs State | vs National | |
| 1. | 49014 | 9.9% | 7.1%(+2.85)#148 | 6.9%(+3.05)#4,626 |
| 2. | 49037 | 8.9% | 7.1%(+1.85)#221 | 6.9%(+2.05)#6,072 |
| 3. | 49017 | 7.6% | 7.1%(+0.523)#314 | 6.9%(+0.726)#8,739 |
| 4. | 49015 | 7.3% | 7.1%(+0.215)#361 | 6.9%(+0.418)#9,529 |
1
Common Questions
What are the Top 3 Zip Codes with the Highest Percentage of Population Employed in Accommodation & Food Services in Battle Creek, MI?
Top 3 Zip Codes with the Highest Percentage of Population Employed in Accommodation & Food Services in Battle Creek, MI are:
What zip code has the Highest Percentage of Population Employed in Accommodation & Food Services in Battle Creek, MI?
49014 has the Highest Percentage of Population Employed in Accommodation & Food Services in Battle Creek, MI with 9.9%.
What is the Percentage of Population Employed in Accommodation & Food Services in Battle Creek, MI?
Percentage of Population Employed in Accommodation & Food Services in Battle Creek is 9.2%.
What is the Percentage of Population Employed in Accommodation & Food Services in Michigan?
Percentage of Population Employed in Accommodation & Food Services in Michigan is 7.1%.
What is the Percentage of Population Employed in Accommodation & Food Services in the United States?
Percentage of Population Employed in Accommodation & Food Services in the United States is 6.9%.