Zip Codes with the Highest Percentage of Population with a Degree in Liberal Arts and History in Grosse Pointe, MI
RELATED REPORTS & OPTIONS
Liberal Arts and History
Grosse Pointe
Compare Zip Codes
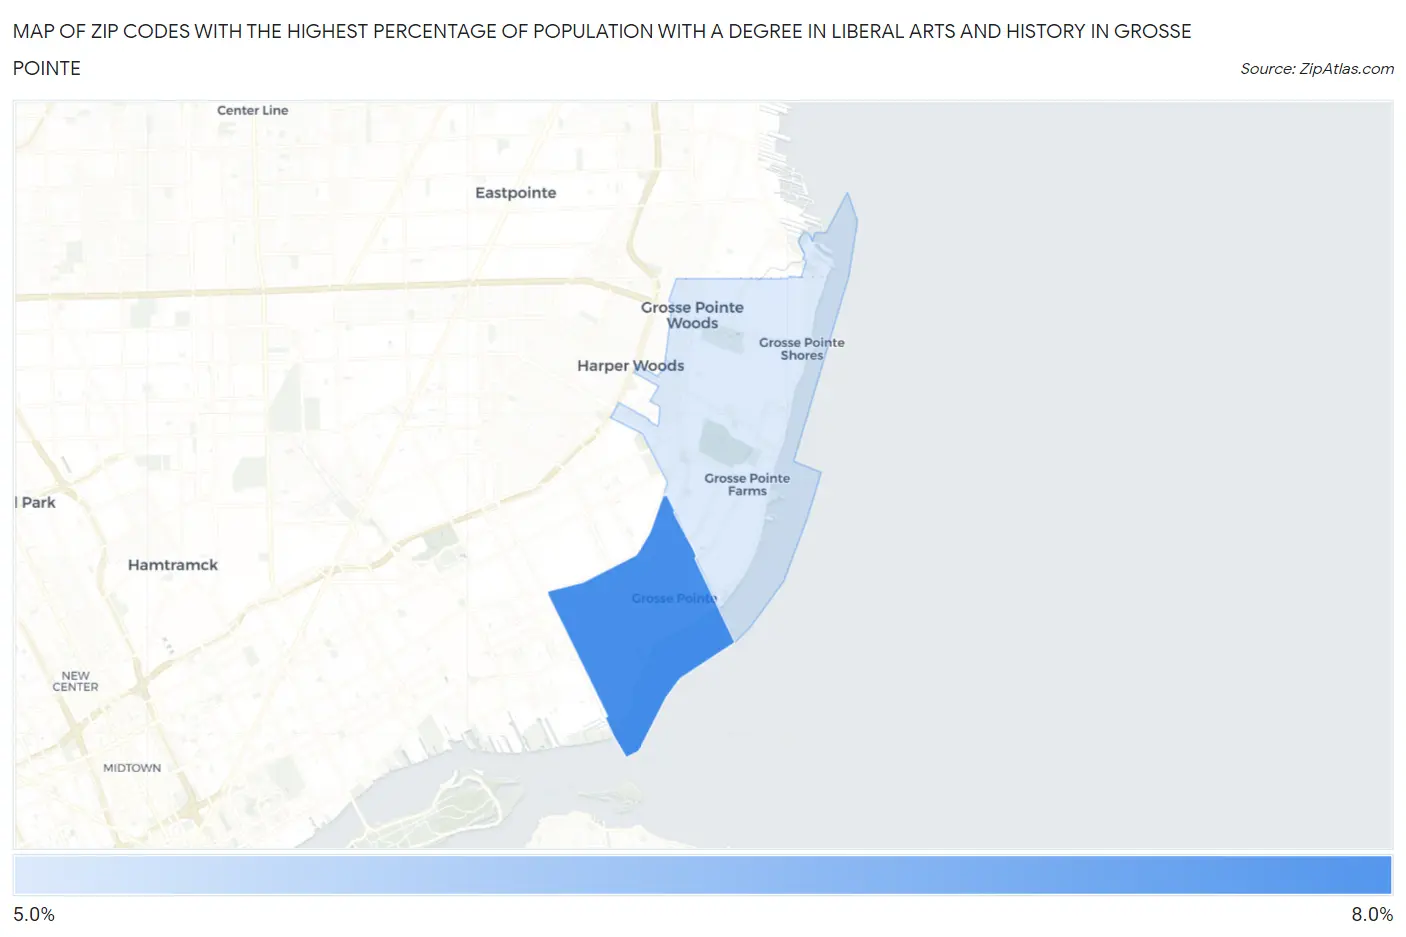
Map of Zip Codes with the Highest Percentage of Population with a Degree in Liberal Arts and History in Grosse Pointe
0.0%
8.0%
Zip Codes with the Highest Percentage of Population with a Degree in Liberal Arts and History in Grosse Pointe, MI
| Zip Code | % Graduates | vs State | vs National | |
| 1. | 48230 | 6.1% | 4.0%(+2.14)#182 | 4.9%(+1.25)#8,215 |
| 2. | 48236 | 5.4% | 4.0%(+1.46)#241 | 4.9%(+0.569)#10,034 |
1
Common Questions
What are the Top Zip Codes with the Highest Percentage of Population with a Degree in Liberal Arts and History in Grosse Pointe, MI?
Top Zip Codes with the Highest Percentage of Population with a Degree in Liberal Arts and History in Grosse Pointe, MI are:
What zip code has the Highest Percentage of Population with a Degree in Liberal Arts and History in Grosse Pointe, MI?
48230 has the Highest Percentage of Population with a Degree in Liberal Arts and History in Grosse Pointe, MI with 6.1%.
What is the Percentage of Population with a Degree in Liberal Arts and History in Grosse Pointe, MI?
Percentage of Population with a Degree in Liberal Arts and History in Grosse Pointe is 6.9%.
What is the Percentage of Population with a Degree in Liberal Arts and History in Michigan?
Percentage of Population with a Degree in Liberal Arts and History in Michigan is 4.0%.
What is the Percentage of Population with a Degree in Liberal Arts and History in the United States?
Percentage of Population with a Degree in Liberal Arts and History in the United States is 4.9%.