Zip Codes with the Highest Percentage of Population Taking Taxi / Cab to Work in Battle Creek, MI
RELATED REPORTS & OPTIONS
Taxi / Cab
Battle Creek
Compare Zip Codes
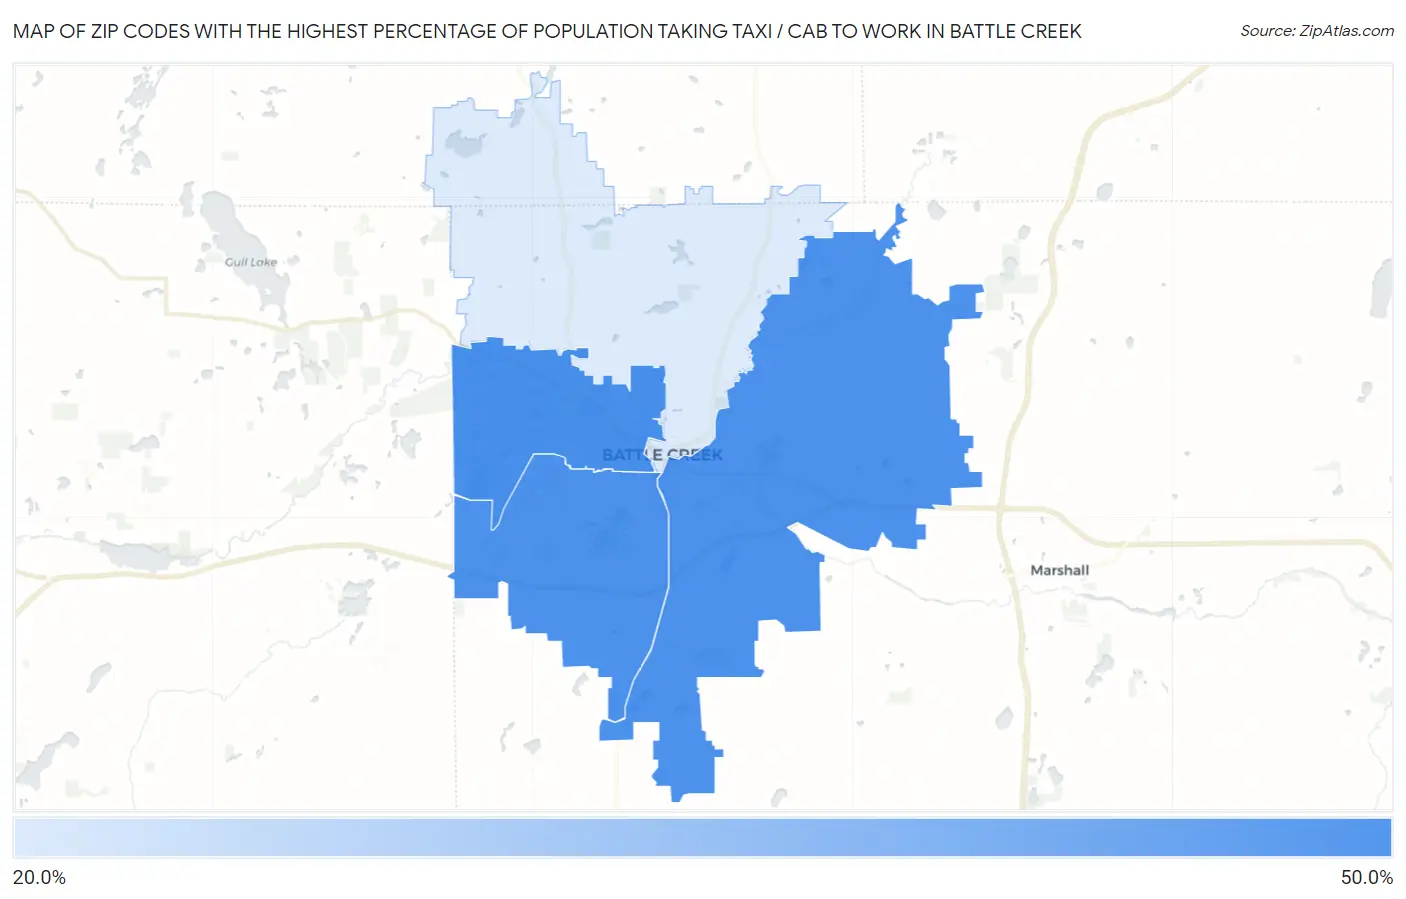
Map of Zip Codes with the Highest Percentage of Population Taking Taxi / Cab to Work in Battle Creek
0.0%
50.0%
Zip Codes with the Highest Percentage of Population Taking Taxi / Cab to Work in Battle Creek, MI
| Zip Code | % Take Taxi / Cab | vs State | vs National | |
| 1. | 49037 | 43.0% | 36.2%(+6.80)#200 | 38.2%(+4.80)#5,354 |
| 2. | 49014 | 42.3% | 36.2%(+6.10)#210 | 38.2%(+4.10)#5,618 |
| 3. | 49015 | 42.2% | 36.2%(+6.00)#211 | 38.2%(+4.00)#5,661 |
| 4. | 49017 | 22.9% | 36.2%(-13.3)#496 | 38.2%(-15.3)#12,639 |
1
Common Questions
What are the Top 3 Zip Codes with the Highest Percentage of Population Taking Taxi / Cab to Work in Battle Creek, MI?
Top 3 Zip Codes with the Highest Percentage of Population Taking Taxi / Cab to Work in Battle Creek, MI are:
What zip code has the Highest Percentage of Population Taking Taxi / Cab to Work in Battle Creek, MI?
49037 has the Highest Percentage of Population Taking Taxi / Cab to Work in Battle Creek, MI with 43.0%.
What is the Percentage of Population Taking Taxi / Cab to Work in Battle Creek, MI?
Percentage of Population Taking Taxi / Cab to Work in Battle Creek is 36.3%.
What is the Percentage of Population Taking Taxi / Cab to Work in Michigan?
Percentage of Population Taking Taxi / Cab to Work in Michigan is 36.2%.
What is the Percentage of Population Taking Taxi / Cab to Work in the United States?
Percentage of Population Taking Taxi / Cab to Work in the United States is 38.2%.