Zip Codes with the Highest Percentage of Population with a Degree in Visual and Performing Arts in Battle Creek, MI
RELATED REPORTS & OPTIONS
Visual and Performing Arts
Battle Creek
Compare Zip Codes
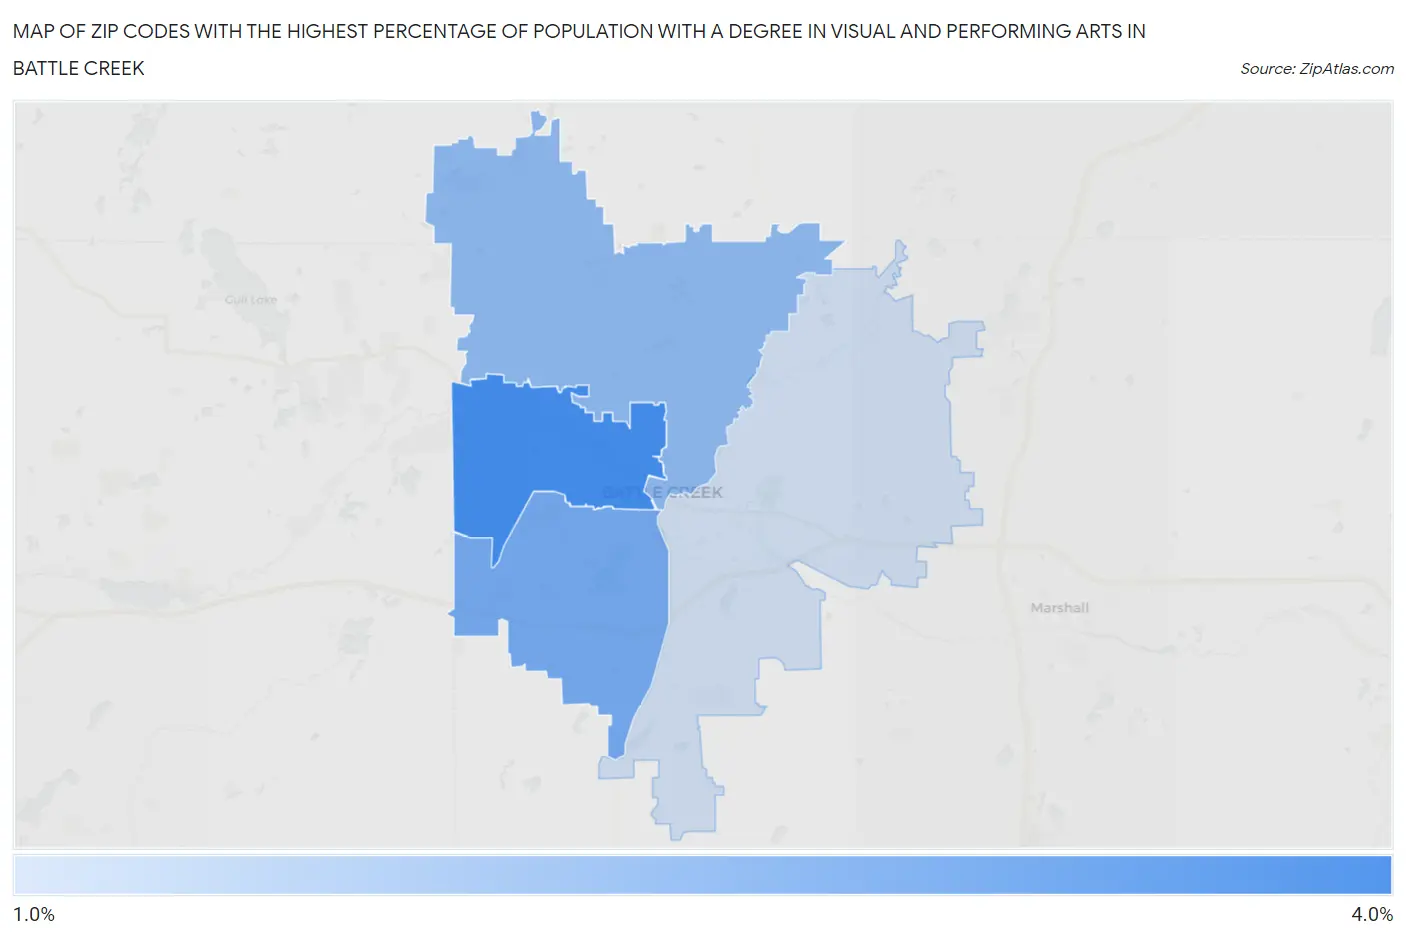
Map of Zip Codes with the Highest Percentage of Population with a Degree in Visual and Performing Arts in Battle Creek
0.0%
4.0%
Zip Codes with the Highest Percentage of Population with a Degree in Visual and Performing Arts in Battle Creek, MI
| Zip Code | % Graduates | vs State | vs National | |
| 1. | 49037 | 3.3% | 3.4%(-0.133)#336 | 4.3%(-0.983)#11,727 |
| 2. | 49015 | 2.6% | 3.4%(-0.825)#433 | 4.3%(-1.68)#14,340 |
| 3. | 49017 | 2.2% | 3.4%(-1.21)#511 | 4.3%(-2.06)#15,724 |
| 4. | 49014 | 1.3% | 3.4%(-2.10)#659 | 4.3%(-2.95)#18,748 |
1
Common Questions
What are the Top 3 Zip Codes with the Highest Percentage of Population with a Degree in Visual and Performing Arts in Battle Creek, MI?
Top 3 Zip Codes with the Highest Percentage of Population with a Degree in Visual and Performing Arts in Battle Creek, MI are:
What zip code has the Highest Percentage of Population with a Degree in Visual and Performing Arts in Battle Creek, MI?
49037 has the Highest Percentage of Population with a Degree in Visual and Performing Arts in Battle Creek, MI with 3.3%.
What is the Percentage of Population with a Degree in Visual and Performing Arts in Battle Creek, MI?
Percentage of Population with a Degree in Visual and Performing Arts in Battle Creek is 2.8%.
What is the Percentage of Population with a Degree in Visual and Performing Arts in Michigan?
Percentage of Population with a Degree in Visual and Performing Arts in Michigan is 3.4%.
What is the Percentage of Population with a Degree in Visual and Performing Arts in the United States?
Percentage of Population with a Degree in Visual and Performing Arts in the United States is 4.3%.