Zip Codes with the Highest Percentage of Population with a Degree in Liberal Arts and History in Holland, MI
RELATED REPORTS & OPTIONS
Liberal Arts and History
Holland
Compare Zip Codes
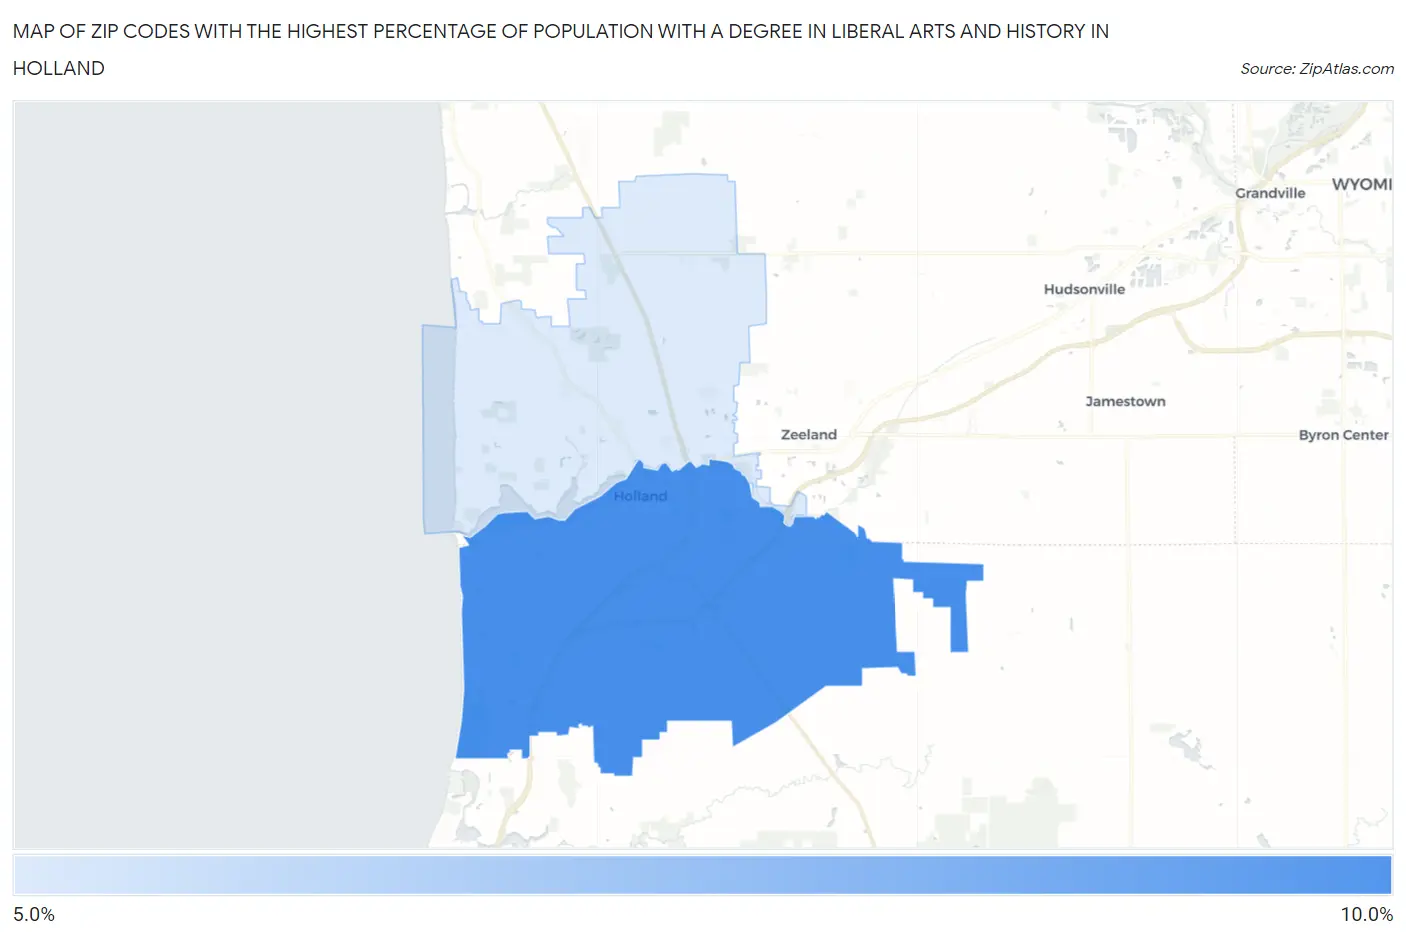
Map of Zip Codes with the Highest Percentage of Population with a Degree in Liberal Arts and History in Holland
0.0%
10.0%
Zip Codes with the Highest Percentage of Population with a Degree in Liberal Arts and History in Holland, MI
| Zip Code | % Graduates | vs State | vs National | |
| 1. | 49423 | 8.3% | 4.0%(+4.34)#89 | 4.9%(+3.45)#4,532 |
| 2. | 49424 | 5.9% | 4.0%(+1.94)#201 | 4.9%(+1.05)#8,720 |
1
Common Questions
What are the Top Zip Codes with the Highest Percentage of Population with a Degree in Liberal Arts and History in Holland, MI?
Top Zip Codes with the Highest Percentage of Population with a Degree in Liberal Arts and History in Holland, MI are:
What zip code has the Highest Percentage of Population with a Degree in Liberal Arts and History in Holland, MI?
49423 has the Highest Percentage of Population with a Degree in Liberal Arts and History in Holland, MI with 8.3%.
What is the Percentage of Population with a Degree in Liberal Arts and History in Holland, MI?
Percentage of Population with a Degree in Liberal Arts and History in Holland is 9.7%.
What is the Percentage of Population with a Degree in Liberal Arts and History in Michigan?
Percentage of Population with a Degree in Liberal Arts and History in Michigan is 4.0%.
What is the Percentage of Population with a Degree in Liberal Arts and History in the United States?
Percentage of Population with a Degree in Liberal Arts and History in the United States is 4.9%.