Zip Codes with the Highest Percentage of Population with a Degree in Visual and Performing Arts in Hammond, IN
RELATED REPORTS & OPTIONS
Visual and Performing Arts
Hammond
Compare Zip Codes
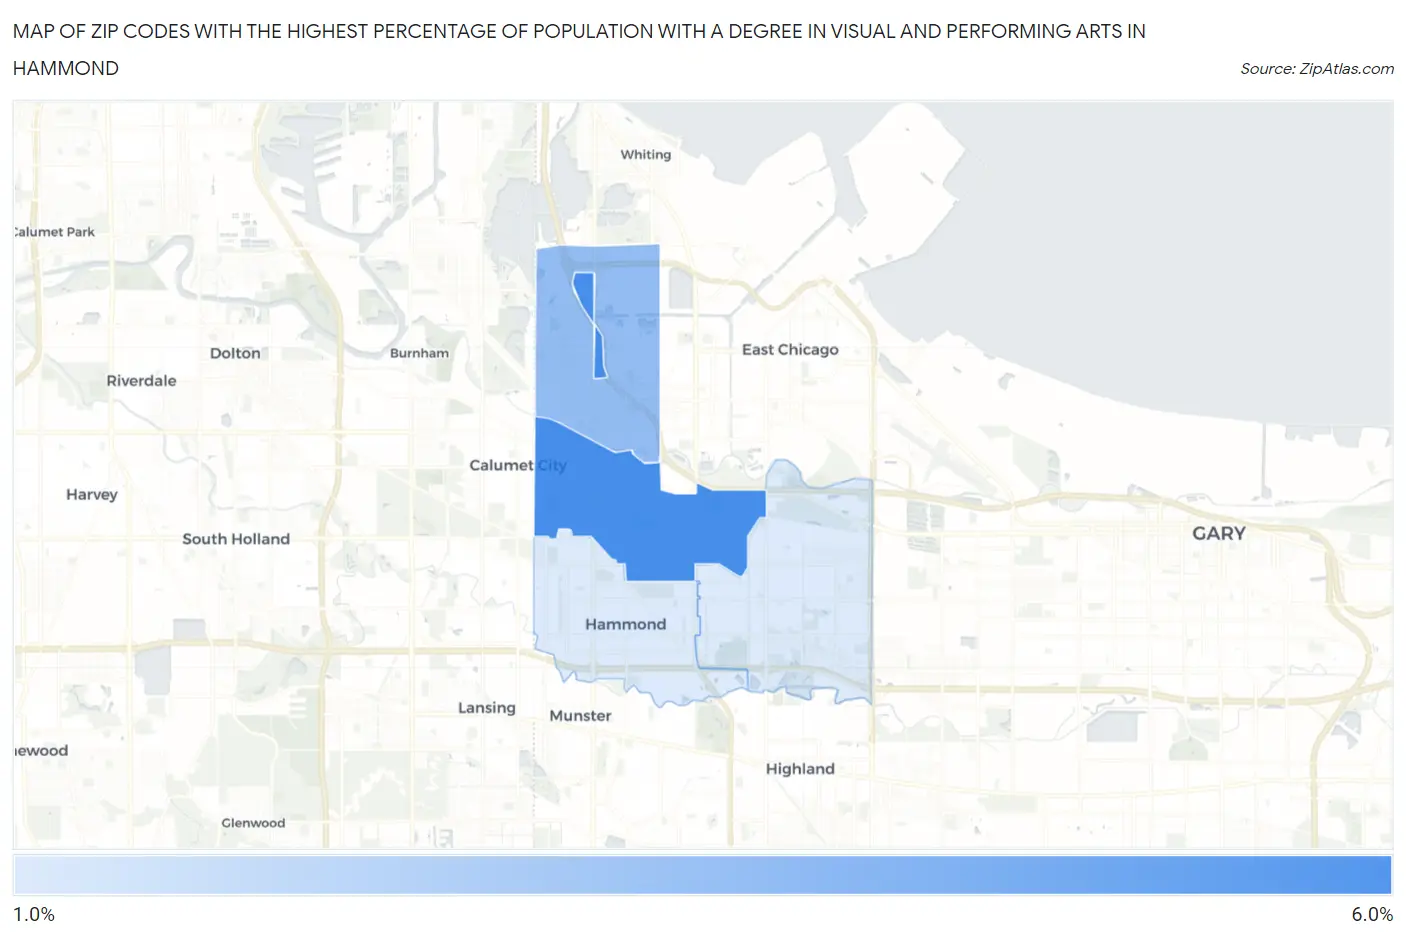
Map of Zip Codes with the Highest Percentage of Population with a Degree in Visual and Performing Arts in Hammond
0.0%
6.0%
Zip Codes with the Highest Percentage of Population with a Degree in Visual and Performing Arts in Hammond, IN
| Zip Code | % Graduates | vs State | vs National | |
| 1. | 46320 | 5.5% | 3.2%(+2.23)#103 | 4.3%(+1.22)#5,725 |
| 2. | 46327 | 3.5% | 3.2%(+0.272)#214 | 4.3%(-0.734)#10,822 |
| 3. | 46324 | 1.7% | 3.2%(-1.55)#383 | 4.3%(-2.56)#17,527 |
| 4. | 46323 | 1.7% | 3.2%(-1.57)#385 | 4.3%(-2.57)#17,573 |
1
Common Questions
What are the Top 3 Zip Codes with the Highest Percentage of Population with a Degree in Visual and Performing Arts in Hammond, IN?
Top 3 Zip Codes with the Highest Percentage of Population with a Degree in Visual and Performing Arts in Hammond, IN are:
What zip code has the Highest Percentage of Population with a Degree in Visual and Performing Arts in Hammond, IN?
46320 has the Highest Percentage of Population with a Degree in Visual and Performing Arts in Hammond, IN with 5.5%.
What is the Percentage of Population with a Degree in Visual and Performing Arts in Hammond, IN?
Percentage of Population with a Degree in Visual and Performing Arts in Hammond is 2.7%.
What is the Percentage of Population with a Degree in Visual and Performing Arts in Indiana?
Percentage of Population with a Degree in Visual and Performing Arts in Indiana is 3.2%.
What is the Percentage of Population with a Degree in Visual and Performing Arts in the United States?
Percentage of Population with a Degree in Visual and Performing Arts in the United States is 4.3%.