Zip Codes with the Highest Percentage of Population with a Degree in Visual and Performing Arts in Noblesville, IN
RELATED REPORTS & OPTIONS
Visual and Performing Arts
Noblesville
Compare Zip Codes
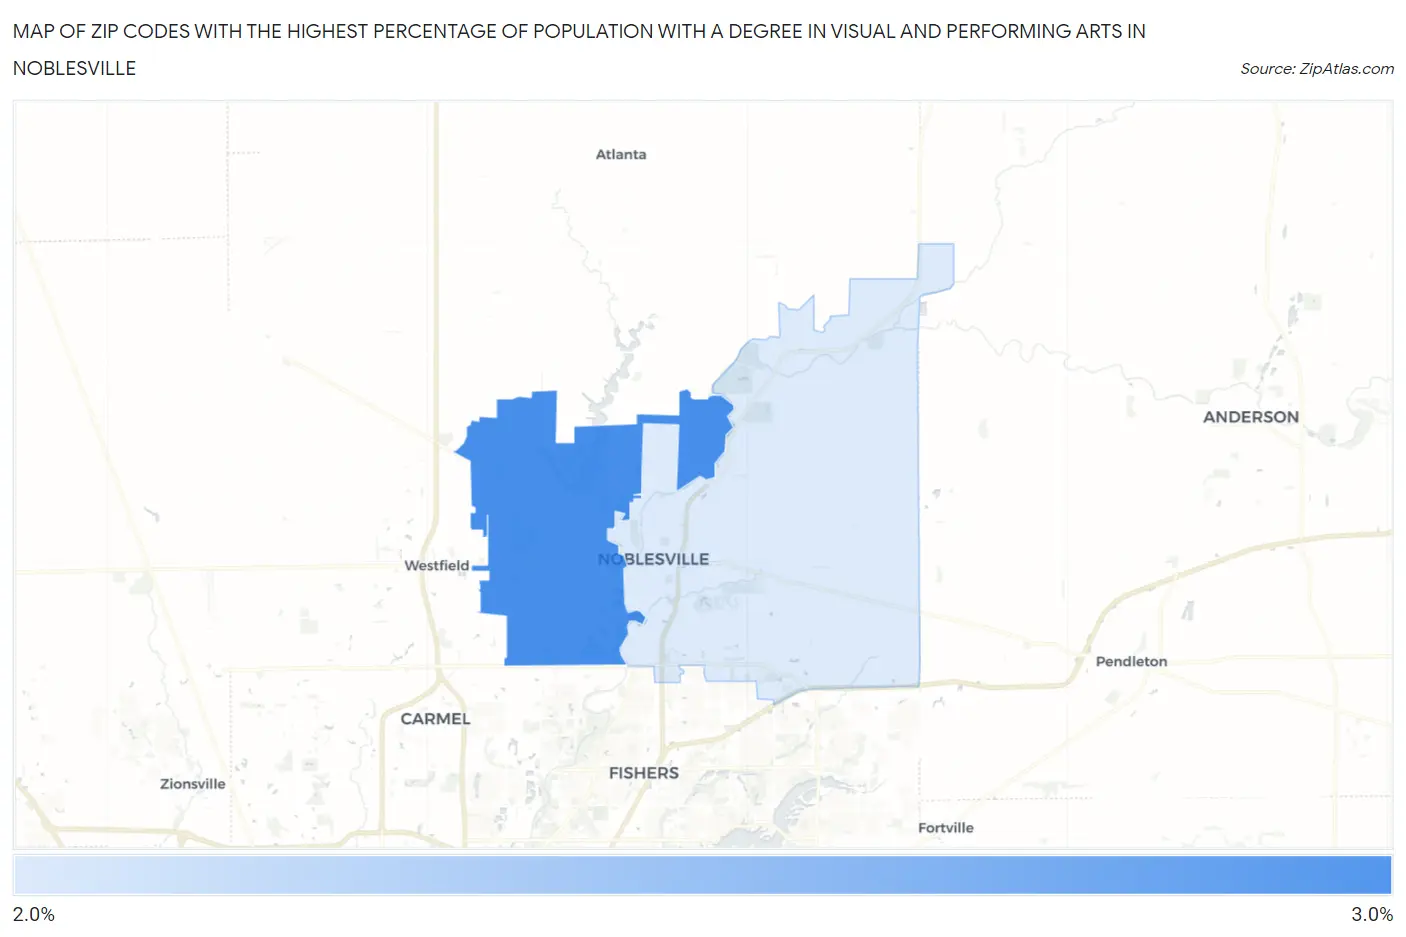
Map of Zip Codes with the Highest Percentage of Population with a Degree in Visual and Performing Arts in Noblesville
0.0%
3.0%
Zip Codes with the Highest Percentage of Population with a Degree in Visual and Performing Arts in Noblesville, IN
| Zip Code | % Graduates | vs State | vs National | |
| 1. | 46062 | 2.9% | 3.2%(-0.340)#272 | 4.3%(-1.35)#13,082 |
| 2. | 46060 | 2.5% | 3.2%(-0.768)#311 | 4.3%(-1.77)#14,700 |
1
Common Questions
What are the Top Zip Codes with the Highest Percentage of Population with a Degree in Visual and Performing Arts in Noblesville, IN?
Top Zip Codes with the Highest Percentage of Population with a Degree in Visual and Performing Arts in Noblesville, IN are:
What zip code has the Highest Percentage of Population with a Degree in Visual and Performing Arts in Noblesville, IN?
46062 has the Highest Percentage of Population with a Degree in Visual and Performing Arts in Noblesville, IN with 2.9%.
What is the Percentage of Population with a Degree in Visual and Performing Arts in Noblesville, IN?
Percentage of Population with a Degree in Visual and Performing Arts in Noblesville is 2.9%.
What is the Percentage of Population with a Degree in Visual and Performing Arts in Indiana?
Percentage of Population with a Degree in Visual and Performing Arts in Indiana is 3.2%.
What is the Percentage of Population with a Degree in Visual and Performing Arts in the United States?
Percentage of Population with a Degree in Visual and Performing Arts in the United States is 4.3%.