Zip Codes with the Highest Percentage of Population with a Degree in Communications in Hammond, IN
RELATED REPORTS & OPTIONS
Communications
Hammond
Compare Zip Codes
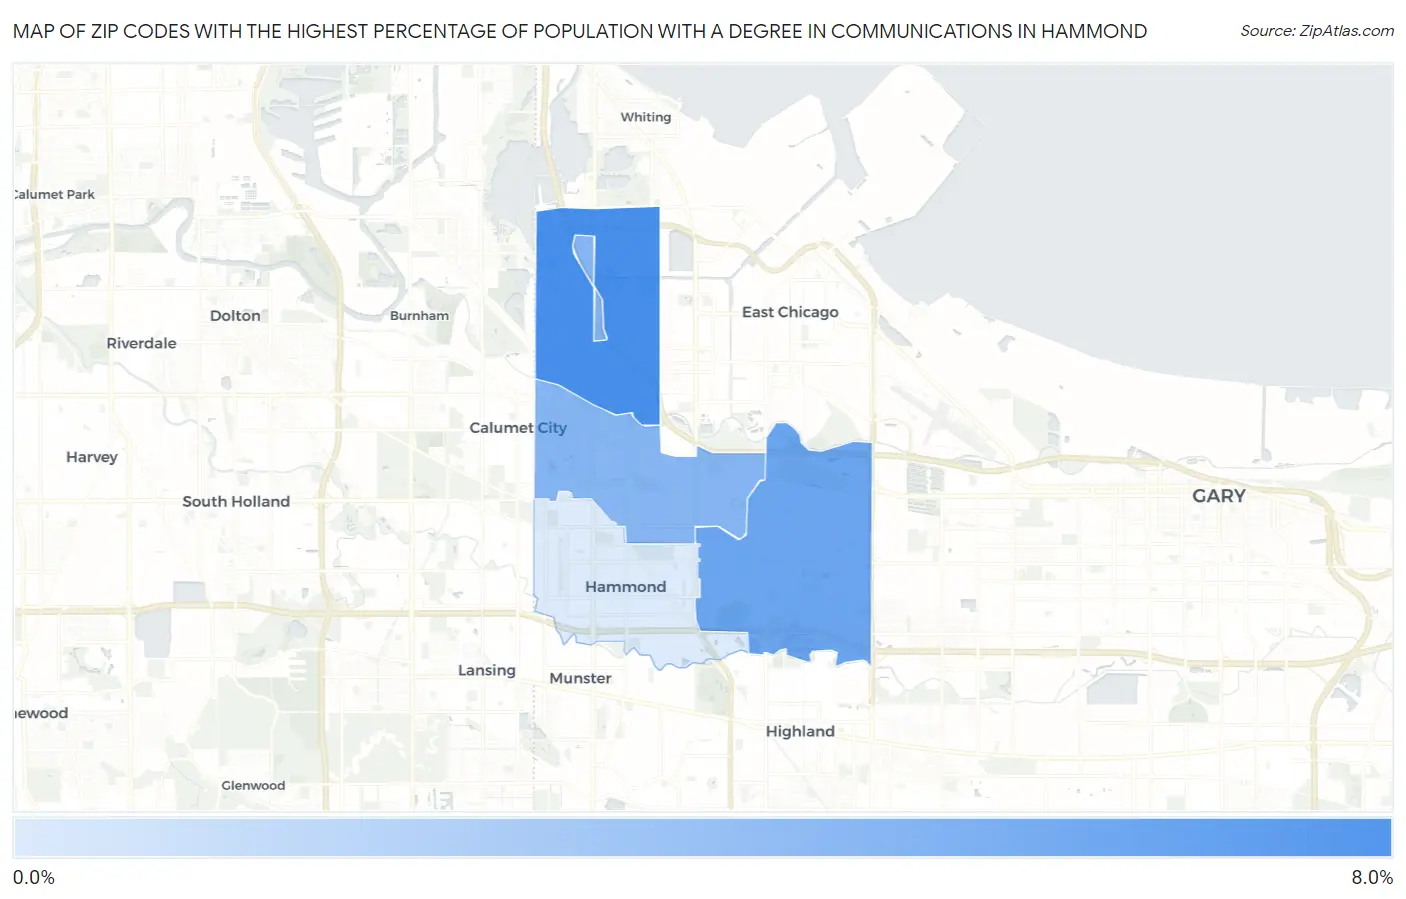
Map of Zip Codes with the Highest Percentage of Population with a Degree in Communications in Hammond
0.0%
8.0%
Zip Codes with the Highest Percentage of Population with a Degree in Communications in Hammond, IN
| Zip Code | % Graduates | vs State | vs National | |
| 1. | 46327 | 6.2% | 3.7%(+2.57)#81 | 4.1%(+2.09)#3,459 |
| 2. | 46323 | 4.9% | 3.7%(+1.30)#127 | 4.1%(+0.812)#5,814 |
| 3. | 46320 | 4.1% | 3.7%(+0.412)#180 | 4.1%(-0.071)#8,366 |
| 4. | 46324 | 1.1% | 3.7%(-2.56)#419 | 4.1%(-3.05)#18,713 |
1
Common Questions
What are the Top 3 Zip Codes with the Highest Percentage of Population with a Degree in Communications in Hammond, IN?
Top 3 Zip Codes with the Highest Percentage of Population with a Degree in Communications in Hammond, IN are:
What zip code has the Highest Percentage of Population with a Degree in Communications in Hammond, IN?
46327 has the Highest Percentage of Population with a Degree in Communications in Hammond, IN with 6.2%.
What is the Percentage of Population with a Degree in Communications in Hammond, IN?
Percentage of Population with a Degree in Communications in Hammond is 3.8%.
What is the Percentage of Population with a Degree in Communications in Indiana?
Percentage of Population with a Degree in Communications in Indiana is 3.7%.
What is the Percentage of Population with a Degree in Communications in the United States?
Percentage of Population with a Degree in Communications in the United States is 4.1%.