Zip Codes with the Highest Percentage of Families with Income Below $10,000 in Hammond, IN
RELATED REPORTS & OPTIONS
Family Income | $0-10k
Hammond
Compare Zip Codes
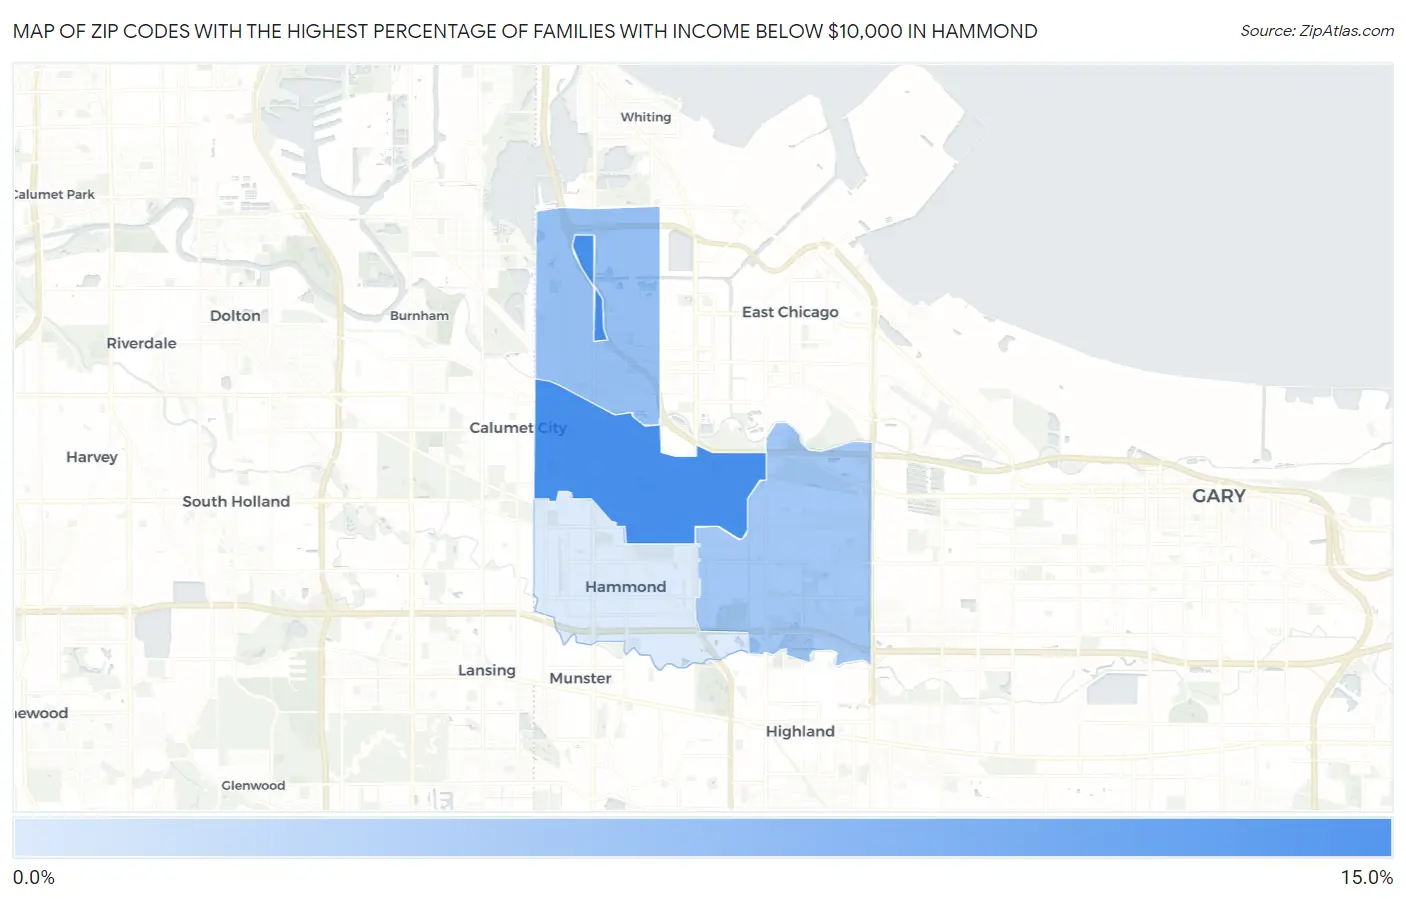
Map of Zip Codes with the Highest Percentage of Families with Income Below $10,000 in Hammond
0.0%
15.0%
Zip Codes with the Highest Percentage of Families with Income Below $10,000 in Hammond, IN
| Zip Code | Families with Income < $10k | vs State | vs National | |
| 1. | 46320 | 11.9% | 3.1%(+8.80)#23 | 3.1%(+8.80)#1,342 |
| 2. | 46327 | 6.6% | 3.1%(+3.50)#72 | 3.1%(+3.50)#4,013 |
| 3. | 46323 | 5.8% | 3.1%(+2.70)#100 | 3.1%(+2.70)#4,912 |
| 4. | 46324 | 2.1% | 3.1%(-1.000)#347 | 3.1%(-1.000)#14,898 |
1
Common Questions
What are the Top 3 Zip Codes with the Highest Percentage of Families with Income Below $10,000 in Hammond, IN?
Top 3 Zip Codes with the Highest Percentage of Families with Income Below $10,000 in Hammond, IN are:
What zip code has the Highest Percentage of Families with Income Below $10,000 in Hammond, IN?
46320 has the Highest Percentage of Families with Income Below $10,000 in Hammond, IN with 11.9%.
What is the Percentage of Families with Income Below $10,000 in Hammond, IN?
Percentage of Families with Income Below $10,000 in Hammond is 5.6%.
What is the Percentage of Families with Income Below $10,000 in Indiana?
Percentage of Families with Income Below $10,000 in Indiana is 3.1%.
What is the Percentage of Families with Income Below $10,000 in the United States?
Percentage of Families with Income Below $10,000 in the United States is 3.1%.