Zip Codes with the Highest Percentage of Population Employed in Life, Physical & Social Science in Hammond, IN
RELATED REPORTS & OPTIONS
Life, Physical & Social Science
Hammond
Compare Zip Codes
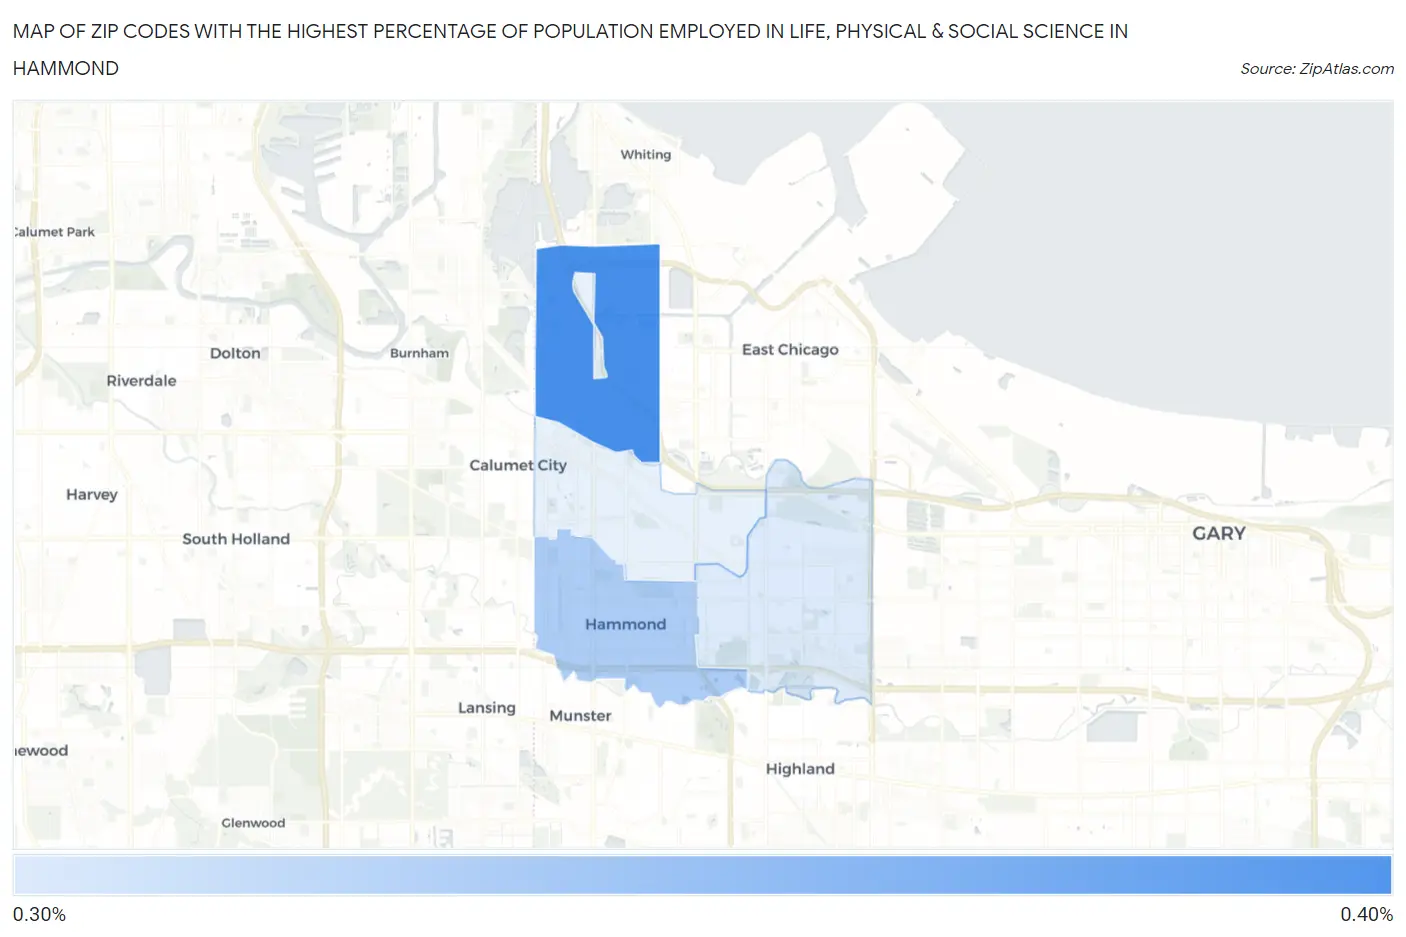
Map of Zip Codes with the Highest Percentage of Population Employed in Life, Physical & Social Science in Hammond
0.0%
0.40%
Zip Codes with the Highest Percentage of Population Employed in Life, Physical & Social Science in Hammond, IN
| Zip Code | % Employed | vs State | vs National | |
| 1. | 46327 | 0.38% | 0.83%(-0.453)#315 | 1.1%(-0.712)#16,036 |
| 2. | 46324 | 0.33% | 0.83%(-0.499)#330 | 1.1%(-0.759)#16,643 |
| 3. | 46323 | 0.31% | 0.83%(-0.521)#340 | 1.1%(-0.780)#16,937 |
1
Common Questions
What are the Top 3 Zip Codes with the Highest Percentage of Population Employed in Life, Physical & Social Science in Hammond, IN?
Top 3 Zip Codes with the Highest Percentage of Population Employed in Life, Physical & Social Science in Hammond, IN are:
What zip code has the Highest Percentage of Population Employed in Life, Physical & Social Science in Hammond, IN?
46327 has the Highest Percentage of Population Employed in Life, Physical & Social Science in Hammond, IN with 0.38%.
What is the Percentage of Population Employed in Life, Physical & Social Science in Hammond, IN?
Percentage of Population Employed in Life, Physical & Social Science in Hammond is 0.36%.
What is the Percentage of Population Employed in Life, Physical & Social Science in Indiana?
Percentage of Population Employed in Life, Physical & Social Science in Indiana is 0.83%.
What is the Percentage of Population Employed in Life, Physical & Social Science in the United States?
Percentage of Population Employed in Life, Physical & Social Science in the United States is 1.1%.