Zip Codes with the Highest Percentage of Population with a Degree in Visual and Performing Arts in Indianapolis, IN
RELATED REPORTS & OPTIONS
Visual and Performing Arts
Indianapolis
Compare Zip Codes
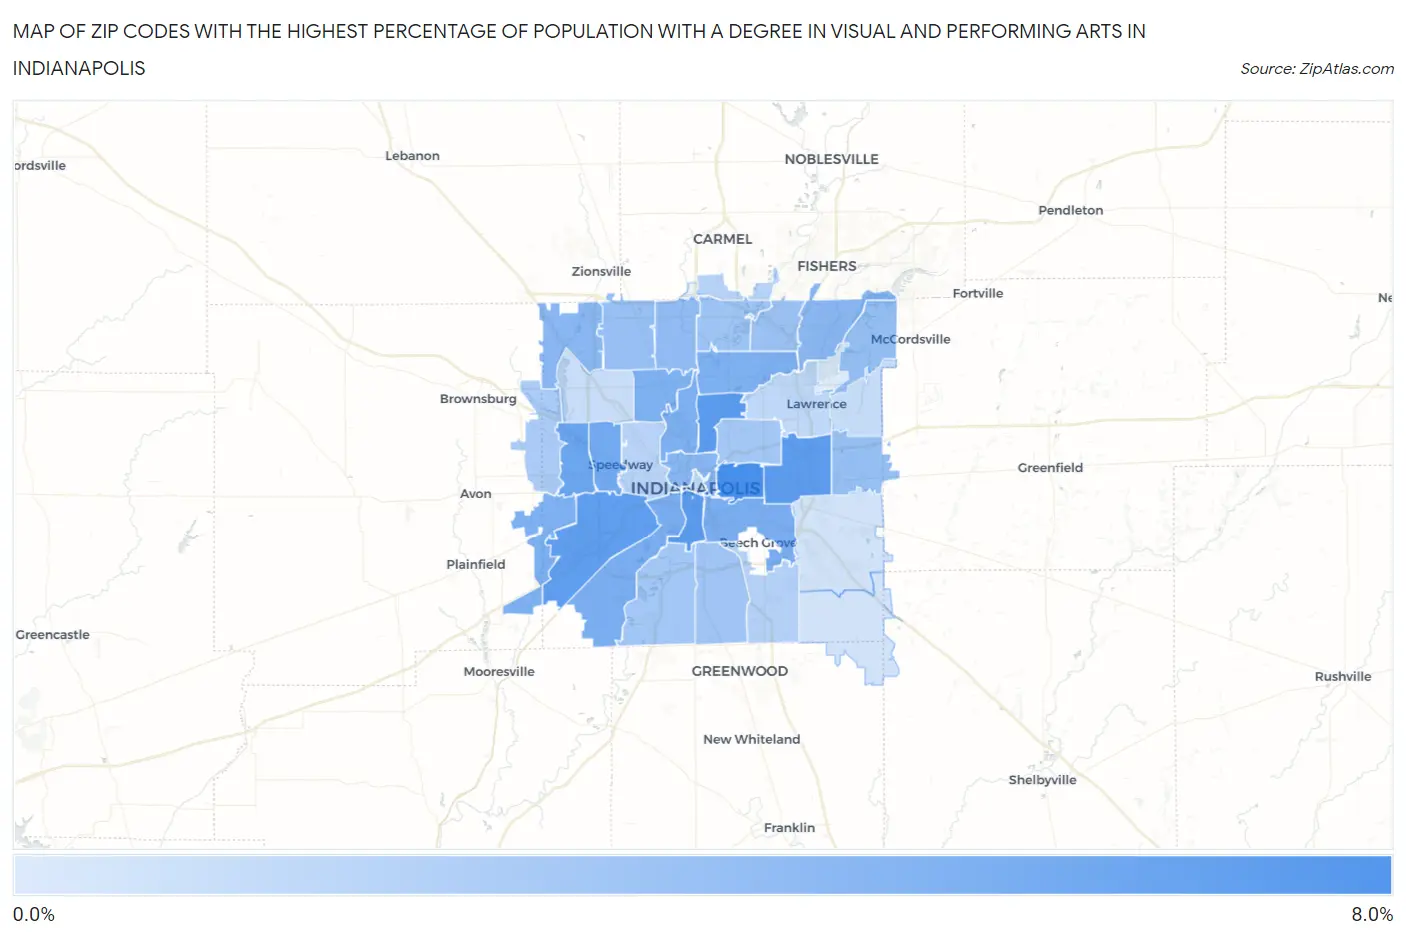
Map of Zip Codes with the Highest Percentage of Population with a Degree in Visual and Performing Arts in Indianapolis
0.0%
8.0%
Zip Codes with the Highest Percentage of Population with a Degree in Visual and Performing Arts in Indianapolis, IN
| Zip Code | % Graduates | vs State | vs National | |
| 1. | 46201 | 7.0% | 3.2%(+3.75)#74 | 4.3%(+2.74)#3,669 |
| 2. | 46205 | 6.2% | 3.2%(+2.96)#84 | 4.3%(+1.95)#4,587 |
| 3. | 46225 | 6.1% | 3.2%(+2.90)#86 | 4.3%(+1.89)#4,684 |
| 4. | 46219 | 6.0% | 3.2%(+2.77)#91 | 4.3%(+1.77)#4,842 |
| 5. | 46241 | 5.9% | 3.2%(+2.68)#96 | 4.3%(+1.68)#4,966 |
| 6. | 46214 | 5.4% | 3.2%(+2.16)#105 | 4.3%(+1.15)#5,850 |
| 7. | 46224 | 5.1% | 3.2%(+1.87)#120 | 4.3%(+0.864)#6,392 |
| 8. | 46221 | 4.9% | 3.2%(+1.62)#127 | 4.3%(+0.616)#6,931 |
| 9. | 46203 | 4.8% | 3.2%(+1.55)#132 | 4.3%(+0.545)#7,081 |
| 10. | 46208 | 4.7% | 3.2%(+1.43)#137 | 4.3%(+0.424)#7,355 |
| 11. | 46228 | 4.6% | 3.2%(+1.39)#142 | 4.3%(+0.379)#7,471 |
| 12. | 46231 | 4.6% | 3.2%(+1.38)#143 | 4.3%(+0.378)#7,472 |
| 13. | 46220 | 4.6% | 3.2%(+1.37)#144 | 4.3%(+0.365)#7,507 |
| 14. | 46202 | 4.3% | 3.2%(+1.04)#159 | 4.3%(+0.035)#8,387 |
| 15. | 46278 | 4.2% | 3.2%(+0.928)#167 | 4.3%(-0.078)#8,702 |
| 16. | 46256 | 4.1% | 3.2%(+0.900)#169 | 4.3%(-0.106)#8,778 |
| 17. | 46260 | 3.9% | 3.2%(+0.666)#180 | 4.3%(-0.340)#9,536 |
| 18. | 46229 | 3.7% | 3.2%(+0.415)#199 | 4.3%(-0.592)#10,298 |
| 19. | 46236 | 3.6% | 3.2%(+0.388)#203 | 4.3%(-0.618)#10,389 |
| 20. | 46268 | 3.6% | 3.2%(+0.314)#210 | 4.3%(-0.692)#10,660 |
| 21. | 46250 | 3.5% | 3.2%(+0.207)#221 | 4.3%(-0.799)#11,060 |
| 22. | 46240 | 3.3% | 3.2%(+0.064)#232 | 4.3%(-0.943)#11,573 |
| 23. | 46227 | 3.2% | 3.2%(-0.067)#246 | 4.3%(-1.07)#12,061 |
| 24. | 46218 | 3.1% | 3.2%(-0.140)#253 | 4.3%(-1.15)#12,328 |
| 25. | 46217 | 3.1% | 3.2%(-0.176)#256 | 4.3%(-1.18)#12,457 |
| 26. | 46234 | 2.9% | 3.2%(-0.395)#275 | 4.3%(-1.40)#13,298 |
| 27. | 46237 | 2.4% | 3.2%(-0.818)#315 | 4.3%(-1.82)#14,886 |
| 28. | 46280 | 2.3% | 3.2%(-0.918)#325 | 4.3%(-1.92)#15,252 |
| 29. | 46222 | 2.2% | 3.2%(-1.02)#334 | 4.3%(-2.02)#15,611 |
| 30. | 46204 | 2.0% | 3.2%(-1.28)#361 | 4.3%(-2.29)#16,562 |
| 31. | 46226 | 1.9% | 3.2%(-1.30)#365 | 4.3%(-2.31)#16,647 |
| 32. | 46235 | 1.7% | 3.2%(-1.58)#387 | 4.3%(-2.58)#17,593 |
| 33. | 46254 | 1.6% | 3.2%(-1.68)#394 | 4.3%(-2.69)#17,967 |
| 34. | 46239 | 1.2% | 3.2%(-2.04)#428 | 4.3%(-3.05)#19,080 |
| 35. | 46259 | 1.2% | 3.2%(-2.08)#432 | 4.3%(-3.09)#19,196 |
| 36. | 46216 | 0.73% | 3.2%(-2.51)#463 | 4.3%(-3.52)#20,287 |
1
Common Questions
What are the Top 10 Zip Codes with the Highest Percentage of Population with a Degree in Visual and Performing Arts in Indianapolis, IN?
Top 10 Zip Codes with the Highest Percentage of Population with a Degree in Visual and Performing Arts in Indianapolis, IN are:
What zip code has the Highest Percentage of Population with a Degree in Visual and Performing Arts in Indianapolis, IN?
46201 has the Highest Percentage of Population with a Degree in Visual and Performing Arts in Indianapolis, IN with 7.0%.
What is the Percentage of Population with a Degree in Visual and Performing Arts in Indianapolis, IN?
Percentage of Population with a Degree in Visual and Performing Arts in Indianapolis is 3.9%.
What is the Percentage of Population with a Degree in Visual and Performing Arts in Indiana?
Percentage of Population with a Degree in Visual and Performing Arts in Indiana is 3.2%.
What is the Percentage of Population with a Degree in Visual and Performing Arts in the United States?
Percentage of Population with a Degree in Visual and Performing Arts in the United States is 4.3%.