Zip Codes with the Highest Percentage of Population Employed in Utilities in Hammond, IN
RELATED REPORTS & OPTIONS
Utilities
Hammond
Compare Zip Codes
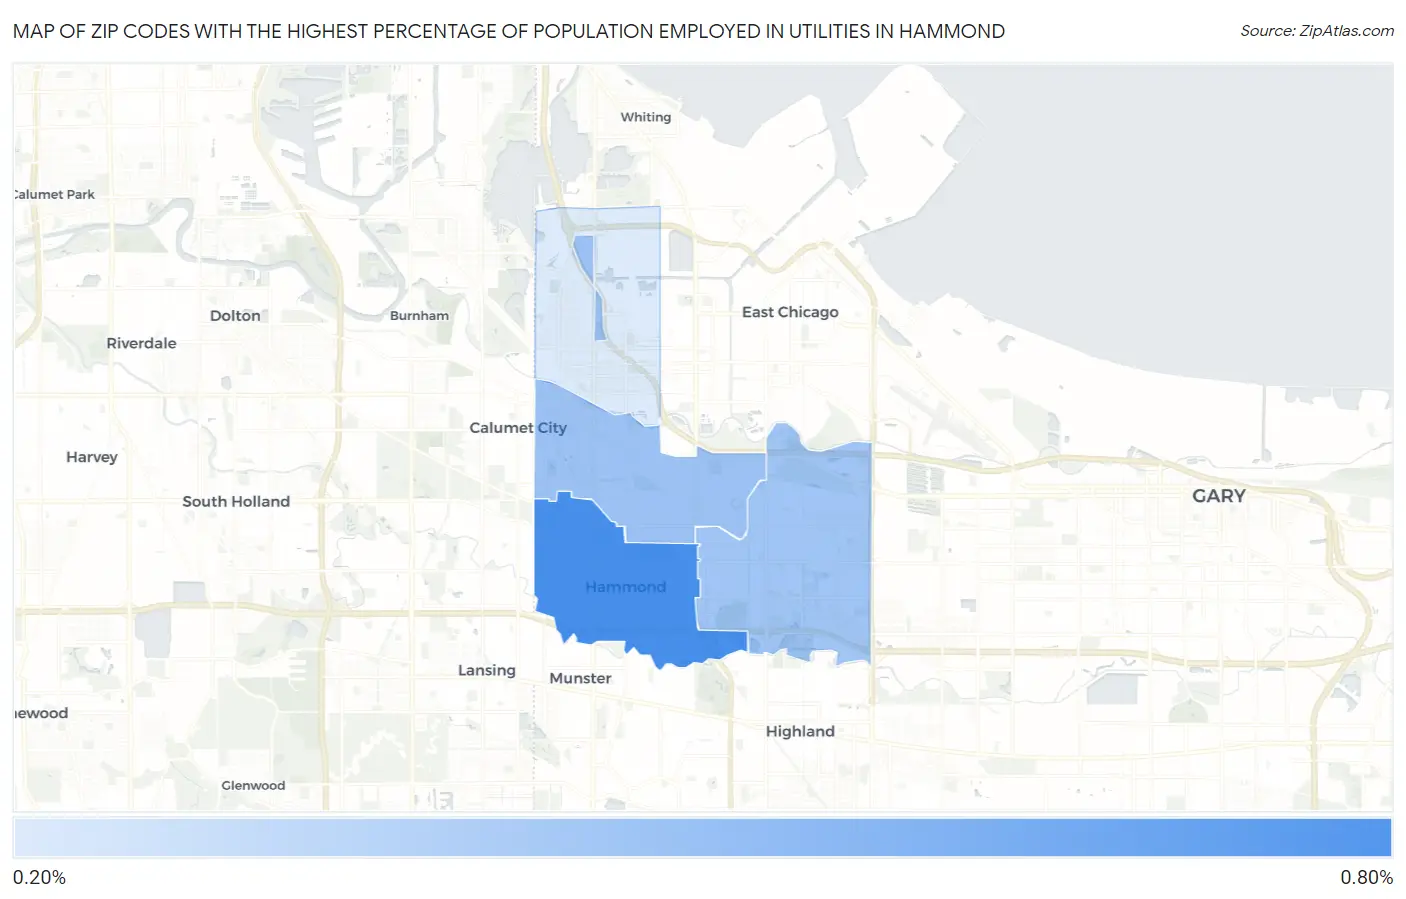
Map of Zip Codes with the Highest Percentage of Population Employed in Utilities in Hammond
0.0%
0.80%
Zip Codes with the Highest Percentage of Population Employed in Utilities in Hammond, IN
| Zip Code | % Employed | vs State | vs National | |
| 1. | 46324 | 0.71% | 0.79%(-0.077)#294 | 0.84%(-0.124)#13,347 |
| 2. | 46320 | 0.42% | 0.79%(-0.370)#401 | 0.84%(-0.417)#17,267 |
| 3. | 46323 | 0.40% | 0.79%(-0.388)#406 | 0.84%(-0.435)#17,520 |
| 4. | 46327 | 0.20% | 0.79%(-0.590)#474 | 0.84%(-0.637)#20,256 |
1
Common Questions
What are the Top 3 Zip Codes with the Highest Percentage of Population Employed in Utilities in Hammond, IN?
Top 3 Zip Codes with the Highest Percentage of Population Employed in Utilities in Hammond, IN are:
What zip code has the Highest Percentage of Population Employed in Utilities in Hammond, IN?
46324 has the Highest Percentage of Population Employed in Utilities in Hammond, IN with 0.71%.
What is the Percentage of Population Employed in Utilities in Hammond, IN?
Percentage of Population Employed in Utilities in Hammond is 0.43%.
What is the Percentage of Population Employed in Utilities in Indiana?
Percentage of Population Employed in Utilities in Indiana is 0.79%.
What is the Percentage of Population Employed in Utilities in the United States?
Percentage of Population Employed in Utilities in the United States is 0.84%.