Zip Codes with the Highest Percentage of Population Employed in Computer & Mathematics in Hammond, IN
RELATED REPORTS & OPTIONS
Computer & Mathematics
Hammond
Compare Zip Codes
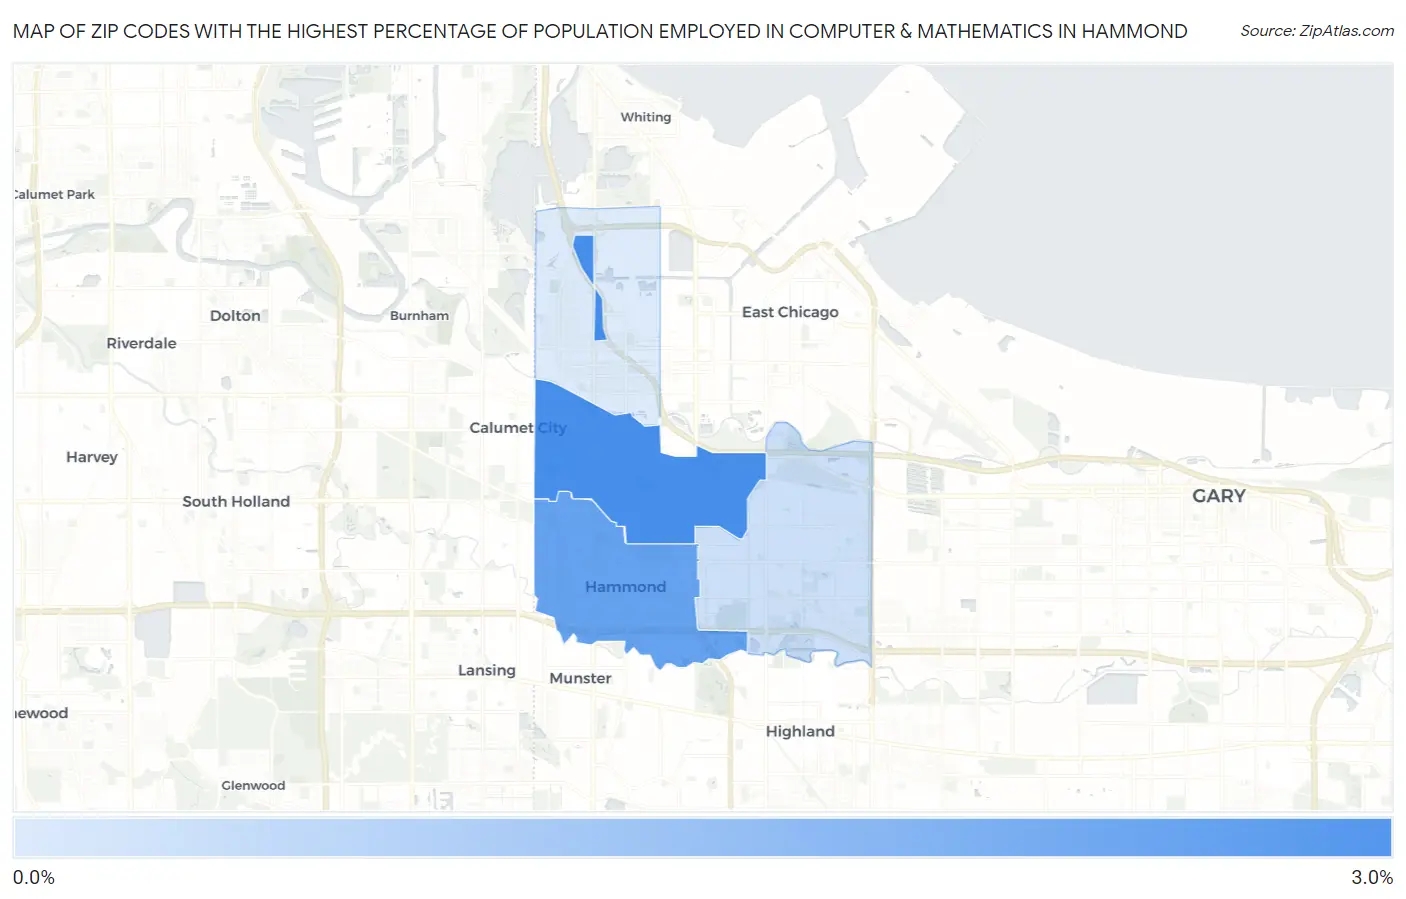
Map of Zip Codes with the Highest Percentage of Population Employed in Computer & Mathematics in Hammond
0.0%
3.0%
Zip Codes with the Highest Percentage of Population Employed in Computer & Mathematics in Hammond, IN
| Zip Code | % Employed | vs State | vs National | |
| 1. | 46320 | 2.7% | 2.4%(+0.278)#161 | 3.5%(-0.832)#8,853 |
| 2. | 46324 | 2.3% | 2.4%(-0.119)#202 | 3.5%(-1.23)#10,476 |
| 3. | 46323 | 0.88% | 2.4%(-1.54)#433 | 3.5%(-2.65)#18,174 |
| 4. | 46327 | 0.65% | 2.4%(-1.77)#486 | 3.5%(-2.88)#19,584 |
1
Common Questions
What are the Top 3 Zip Codes with the Highest Percentage of Population Employed in Computer & Mathematics in Hammond, IN?
Top 3 Zip Codes with the Highest Percentage of Population Employed in Computer & Mathematics in Hammond, IN are:
What zip code has the Highest Percentage of Population Employed in Computer & Mathematics in Hammond, IN?
46320 has the Highest Percentage of Population Employed in Computer & Mathematics in Hammond, IN with 2.7%.
What is the Percentage of Population Employed in Computer & Mathematics in Hammond, IN?
Percentage of Population Employed in Computer & Mathematics in Hammond is 1.7%.
What is the Percentage of Population Employed in Computer & Mathematics in Indiana?
Percentage of Population Employed in Computer & Mathematics in Indiana is 2.4%.
What is the Percentage of Population Employed in Computer & Mathematics in the United States?
Percentage of Population Employed in Computer & Mathematics in the United States is 3.5%.