Zip Codes with the Highest Percentage of Population Employed in Sales & Related in Hammond, IN
RELATED REPORTS & OPTIONS
Sales & Related
Hammond
Compare Zip Codes
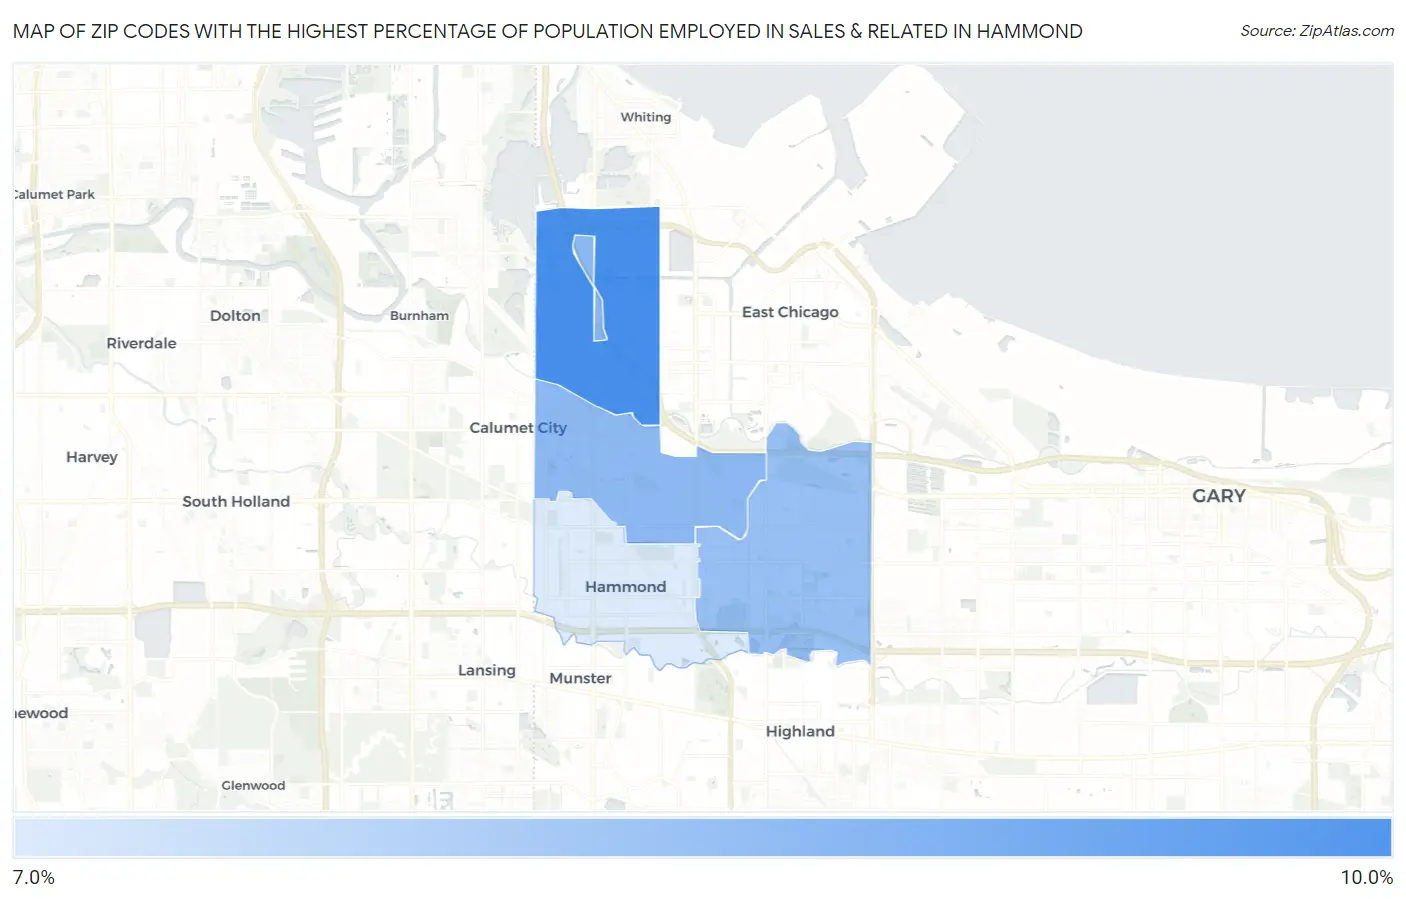
Map of Zip Codes with the Highest Percentage of Population Employed in Sales & Related in Hammond
0.0%
10.0%
Zip Codes with the Highest Percentage of Population Employed in Sales & Related in Hammond, IN
| Zip Code | % Employed | vs State | vs National | |
| 1. | 46327 | 9.7% | 8.8%(+0.825)#236 | 9.6%(+0.071)#12,155 |
| 2. | 46320 | 8.6% | 8.8%(-0.220)#311 | 9.6%(-0.975)#15,908 |
| 3. | 46323 | 8.5% | 8.8%(-0.377)#325 | 9.6%(-1.13)#16,479 |
| 4. | 46324 | 7.4% | 8.8%(-1.40)#426 | 9.6%(-2.15)#19,850 |
1
Common Questions
What are the Top 3 Zip Codes with the Highest Percentage of Population Employed in Sales & Related in Hammond, IN?
Top 3 Zip Codes with the Highest Percentage of Population Employed in Sales & Related in Hammond, IN are:
What zip code has the Highest Percentage of Population Employed in Sales & Related in Hammond, IN?
46327 has the Highest Percentage of Population Employed in Sales & Related in Hammond, IN with 9.7%.
What is the Percentage of Population Employed in Sales & Related in Hammond, IN?
Percentage of Population Employed in Sales & Related in Hammond is 8.1%.
What is the Percentage of Population Employed in Sales & Related in Indiana?
Percentage of Population Employed in Sales & Related in Indiana is 8.8%.
What is the Percentage of Population Employed in Sales & Related in the United States?
Percentage of Population Employed in Sales & Related in the United States is 9.6%.