Zip Codes with the Highest Percentage of Population with a Degree in Arts and Humanities in Hammond, IN
RELATED REPORTS & OPTIONS
Arts and Humanities
Hammond
Compare Zip Codes
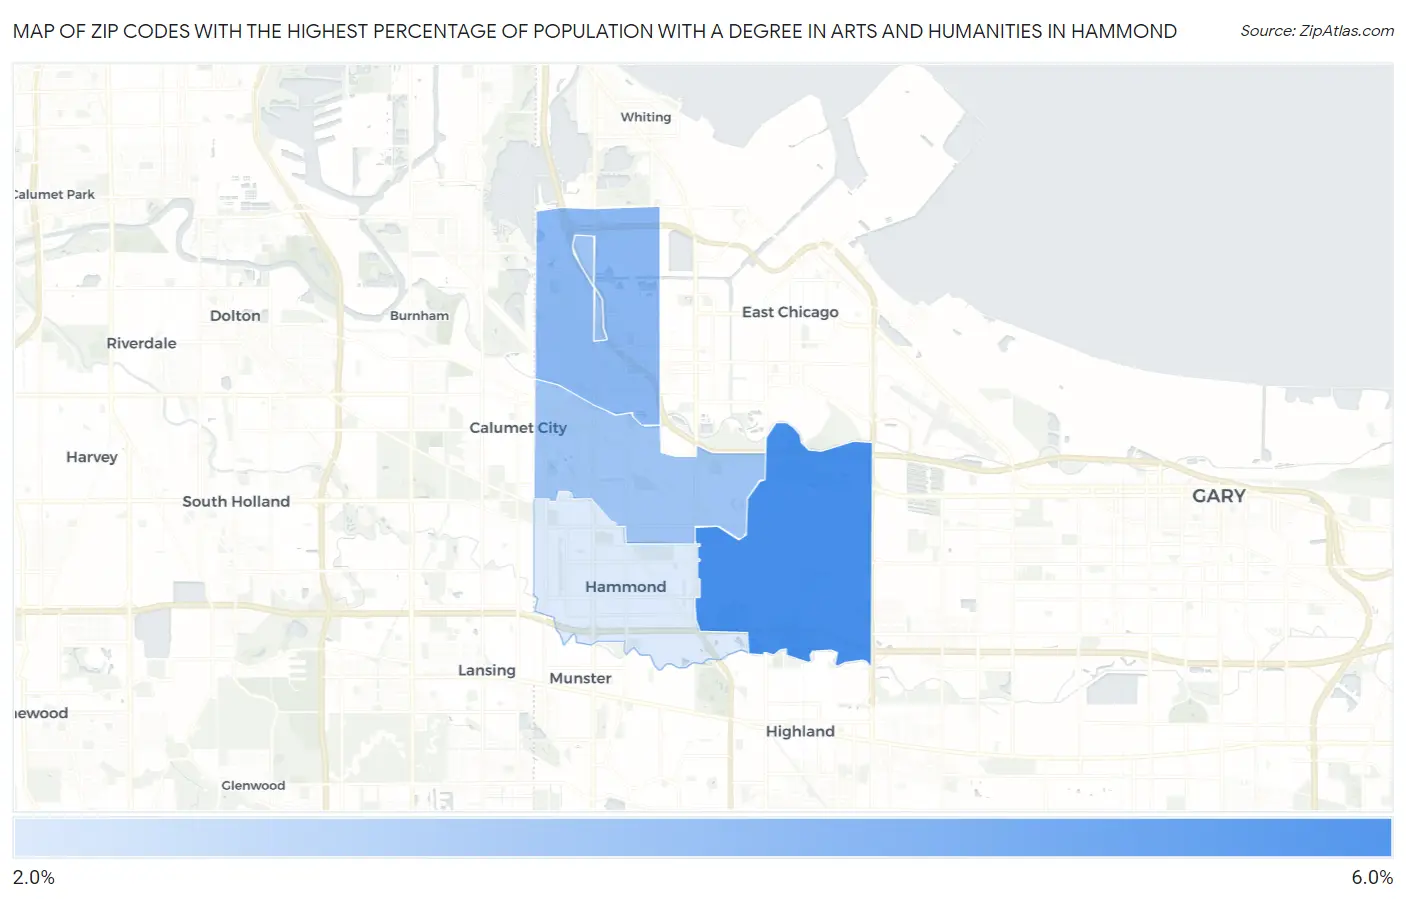
Map of Zip Codes with the Highest Percentage of Population with a Degree in Arts and Humanities in Hammond
0.0%
6.0%
Zip Codes with the Highest Percentage of Population with a Degree in Arts and Humanities in Hammond, IN
| Zip Code | % Graduates | vs State | vs National | |
| 1. | 46323 | 5.8% | 6.3%(-0.519)#348 | 6.0%(-0.209)#15,276 |
| 2. | 46327 | 4.5% | 6.3%(-1.84)#443 | 6.0%(-1.53)#19,100 |
| 3. | 46320 | 4.1% | 6.3%(-2.24)#467 | 6.0%(-1.93)#20,171 |
| 4. | 46324 | 2.8% | 6.3%(-3.49)#534 | 6.0%(-3.18)#23,006 |
1
Common Questions
What are the Top 3 Zip Codes with the Highest Percentage of Population with a Degree in Arts and Humanities in Hammond, IN?
Top 3 Zip Codes with the Highest Percentage of Population with a Degree in Arts and Humanities in Hammond, IN are:
What zip code has the Highest Percentage of Population with a Degree in Arts and Humanities in Hammond, IN?
46323 has the Highest Percentage of Population with a Degree in Arts and Humanities in Hammond, IN with 5.8%.
What is the Percentage of Population with a Degree in Arts and Humanities in Hammond, IN?
Percentage of Population with a Degree in Arts and Humanities in Hammond is 5.2%.
What is the Percentage of Population with a Degree in Arts and Humanities in Indiana?
Percentage of Population with a Degree in Arts and Humanities in Indiana is 6.3%.
What is the Percentage of Population with a Degree in Arts and Humanities in the United States?
Percentage of Population with a Degree in Arts and Humanities in the United States is 6.0%.