Zip Codes with the Highest Percentage of Population Employed in Computer, Engineering & Science in Hammond, IN
RELATED REPORTS & OPTIONS
Computer, Engineering & Science
Hammond
Compare Zip Codes
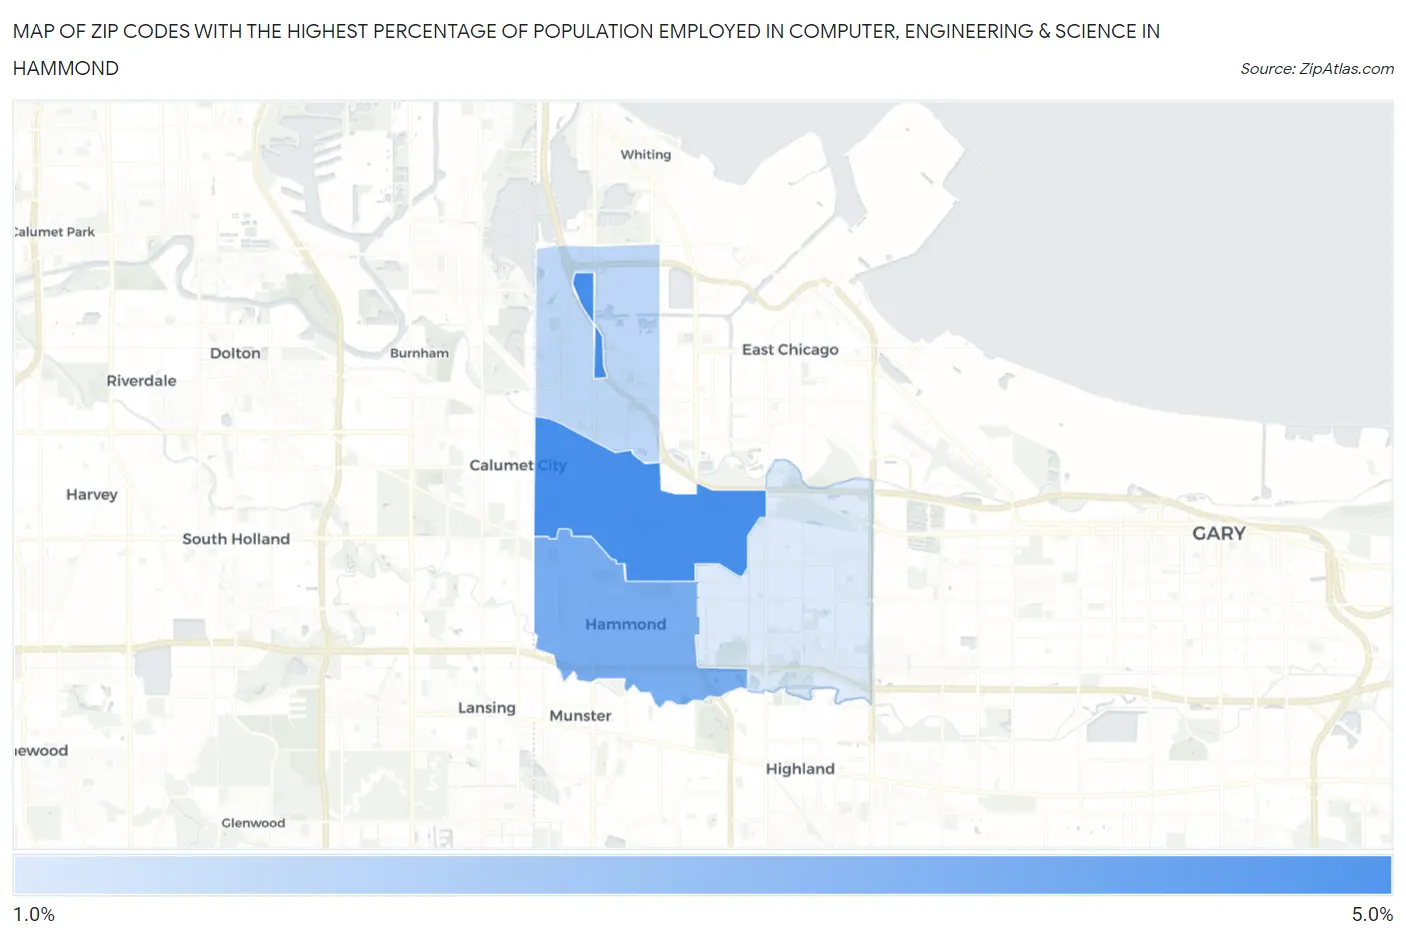
Map of Zip Codes with the Highest Percentage of Population Employed in Computer, Engineering & Science in Hammond
0.0%
5.0%
Zip Codes with the Highest Percentage of Population Employed in Computer, Engineering & Science in Hammond, IN
| Zip Code | % Employed | vs State | vs National | |
| 1. | 46320 | 4.8% | 5.5%(-0.694)#256 | 6.8%(-1.99)#12,014 |
| 2. | 46324 | 3.8% | 5.5%(-1.68)#349 | 6.8%(-2.97)#15,186 |
| 3. | 46327 | 2.4% | 5.5%(-3.11)#509 | 6.8%(-4.40)#20,541 |
| 4. | 46323 | 1.7% | 5.5%(-3.75)#573 | 6.8%(-5.05)#22,866 |
1
Common Questions
What are the Top 3 Zip Codes with the Highest Percentage of Population Employed in Computer, Engineering & Science in Hammond, IN?
Top 3 Zip Codes with the Highest Percentage of Population Employed in Computer, Engineering & Science in Hammond, IN are:
What zip code has the Highest Percentage of Population Employed in Computer, Engineering & Science in Hammond, IN?
46320 has the Highest Percentage of Population Employed in Computer, Engineering & Science in Hammond, IN with 4.8%.
What is the Percentage of Population Employed in Computer, Engineering & Science in Hammond, IN?
Percentage of Population Employed in Computer, Engineering & Science in Hammond is 4.0%.
What is the Percentage of Population Employed in Computer, Engineering & Science in Indiana?
Percentage of Population Employed in Computer, Engineering & Science in Indiana is 5.5%.
What is the Percentage of Population Employed in Computer, Engineering & Science in the United States?
Percentage of Population Employed in Computer, Engineering & Science in the United States is 6.8%.