Zip Codes with the Highest Percentage of Population Employed in Accommodation & Food Services in Hoffman Estates, IL
RELATED REPORTS & OPTIONS
Accommodation & Food Services
Hoffman Estates
Compare Zip Codes
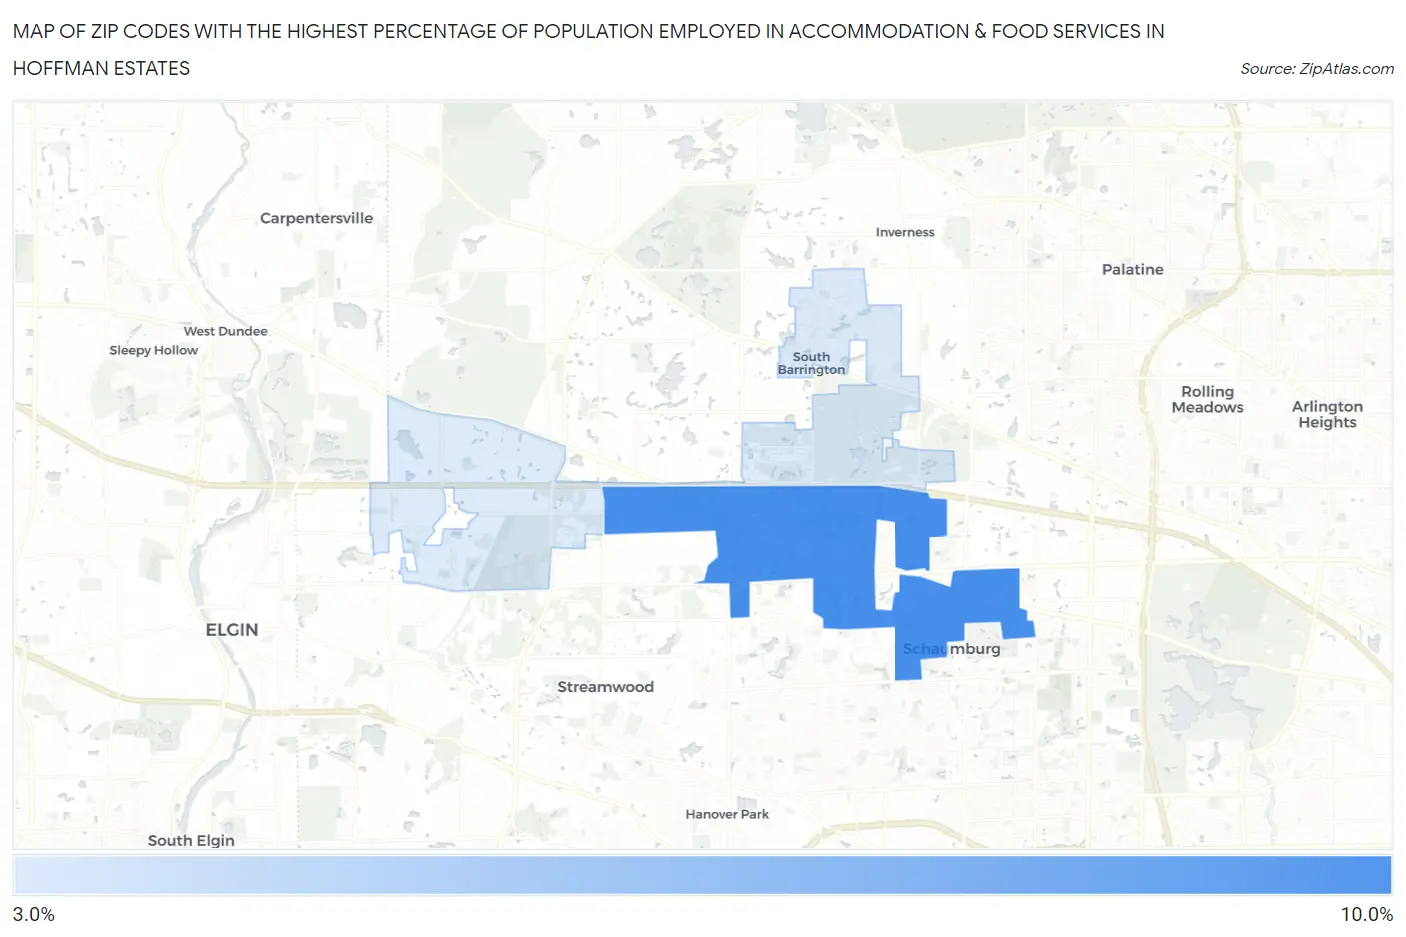
Map of Zip Codes with the Highest Percentage of Population Employed in Accommodation & Food Services in Hoffman Estates
0.0%
10.0%
Zip Codes with the Highest Percentage of Population Employed in Accommodation & Food Services in Hoffman Estates, IL
| Zip Code | % Employed | vs State | vs National | |
| 1. | 60169 | 9.3% | 6.5%(+2.84)#163 | 6.9%(+2.43)#5,489 |
| 2. | 60192 | 3.7% | 6.5%(-2.74)#877 | 6.9%(-3.15)#21,021 |
1
Common Questions
What are the Top Zip Codes with the Highest Percentage of Population Employed in Accommodation & Food Services in Hoffman Estates, IL?
Top Zip Codes with the Highest Percentage of Population Employed in Accommodation & Food Services in Hoffman Estates, IL are:
What zip code has the Highest Percentage of Population Employed in Accommodation & Food Services in Hoffman Estates, IL?
60169 has the Highest Percentage of Population Employed in Accommodation & Food Services in Hoffman Estates, IL with 9.3%.
What is the Percentage of Population Employed in Accommodation & Food Services in Hoffman Estates, IL?
Percentage of Population Employed in Accommodation & Food Services in Hoffman Estates is 7.4%.
What is the Percentage of Population Employed in Accommodation & Food Services in Illinois?
Percentage of Population Employed in Accommodation & Food Services in Illinois is 6.5%.
What is the Percentage of Population Employed in Accommodation & Food Services in the United States?
Percentage of Population Employed in Accommodation & Food Services in the United States is 6.9%.